The latest issue of RJO FuturesCast Newsletter is available now! Timely futures market commentary by RJO Market Strategists.
Not a subscriber? Click here to access the latest issue

Wednesday, May 5 at 11 a.m. CT
In this session you will learn:
![]()

The grain markets are on fire lately nearing all-time highs. Many expert believe we will break those highs. Learn to navigate the market with this Special Report!
![]()
The latest issue of RJO FuturesCast Newsletter is available now! Timely futures market commentary by RJO Market Strategists.
Not a subscriber? Click here to access the latest issue

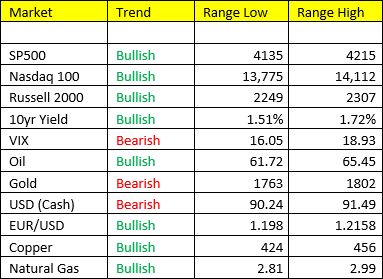
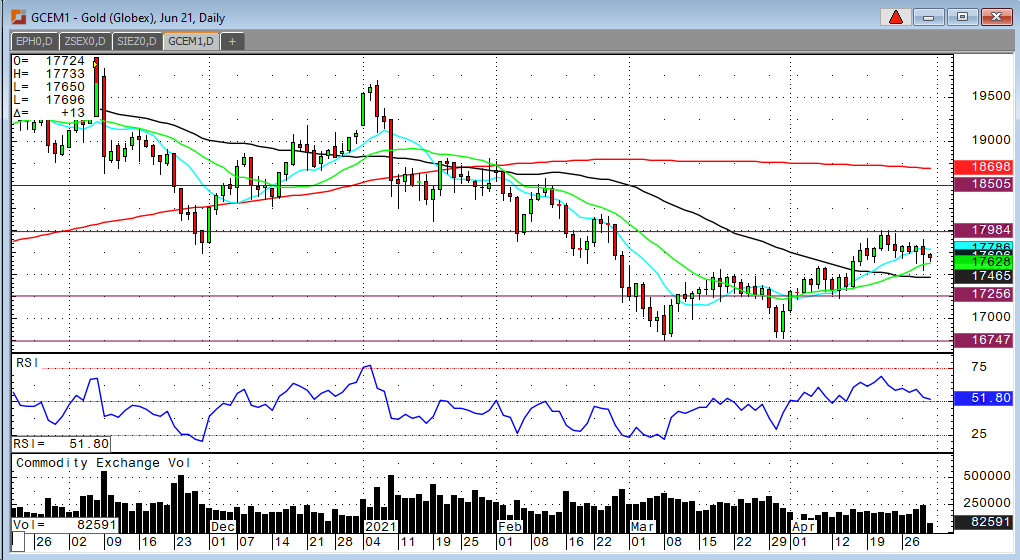
Gold has a new trading range as it bases another new bottom and gradually grinds its way higher. At some level gold will have an explosive type breakout to the upside and I think that level may well be $1,800. Gold had an impressive rally from $1,725 to $1,798.40. In my opinion the rally was rooted in Dollar weakness. After three failed attempts to move the rally above $1,800 we are now experiencing some simple back and fill action. So, the “new” trading range for now, is $1,750 to $1,800. The next attempt to take out $1,800 should quickly take gold prices towards $1,850. Dollar bounces cause gold pull backs. The Dollar cannot sustain any type of meaningful rally while the printing press runs full speed without interruption. Monetary policy will not change any time soon and gold will necessarily move higher as currencies around the globe are de-valued.
Platinum struggles to breakout and hold a close above $1,250. This too shall pass. Palladium has just made an all time new high and should also help support platinum. Platinum is a good long-term value in the $1,200 range. I would expect that when gold moves above $1,800 we will see platinum testing $1,300.

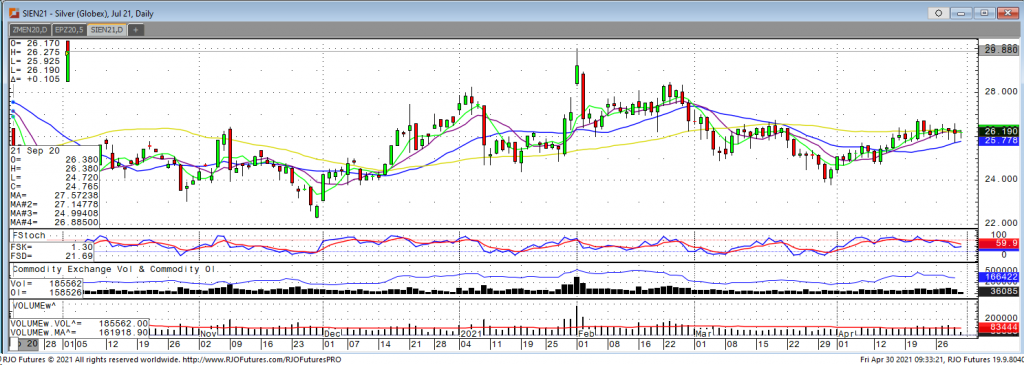
Last week’s end of week pullback kept pressure on the silver market this week, trading in an 83 ½ cent range where both extremes were seen during Thursday’s session. We are seeing an increase in gold demand from China which normally should be favorable for the precious metals but even with that year over year increase, global demand is still lacking with the US and Europe seeing declines. Silver got some support with President Biden’s speech this week but better than expected US GDP data caused a rise in US yields and the dollar which added pressure. The Fed continues to state that there is no inflation risk as they have the necessary tools to control it. It seems that with every piece of bullish fundamental news that we get, the silver market fails to get any real footing for a push higher and remains coiling in a sideways range. The bulls need to see a push above 26.75 to regain the trend higher while a break of support at 25.75 would likely see a move down to the 24.90-25.20 range. Things to keep an eye on next week are a speech from Fed Chairman Powell on Monday and nonfarm payrolls to end the week.

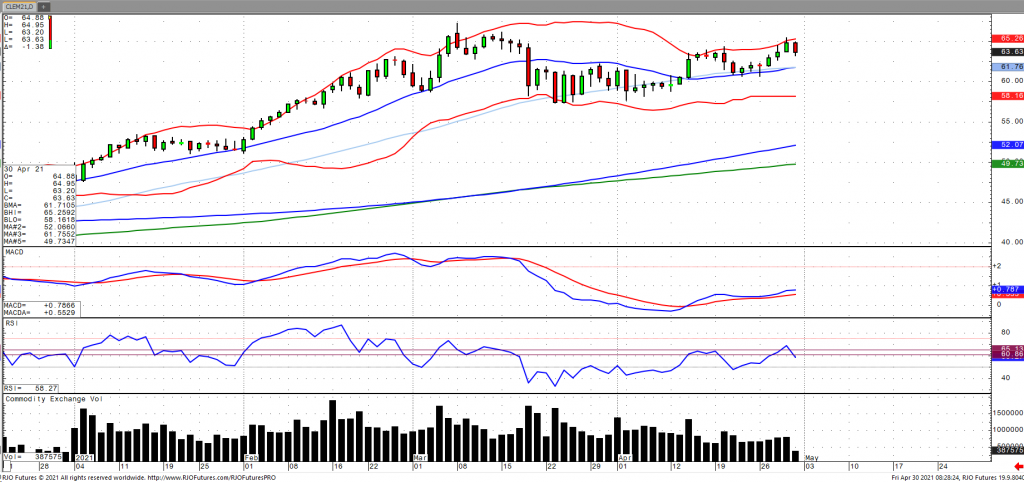
Oil prices are correcting after signaling immediate term overbought and touching a six-week high as enhanced restrictions in Japan, Brazil and India are dampening the outlook for the global recovery and subsequent fuel demand with Indian oil imports reportedly falling 1 million barrels per day. Despite the softening demand outlook, WTI is poised for a nearly 8% gain for the month of April, notwithstanding reports of some Chinese port stockpiles at 4-week highs as well as higher Libyan exports. OPEC+ confirmed earlier this week of a gradual easing of production over the course of the next coming months. Crude stocks rose 90k with the yearly deficit increasing to -34.524 million barrels and total stocks down 1.697 million barrels relative to the five-year average, according to the EIA. The market remains bullish trend with today’s range seen between 61.86 – 65.17.
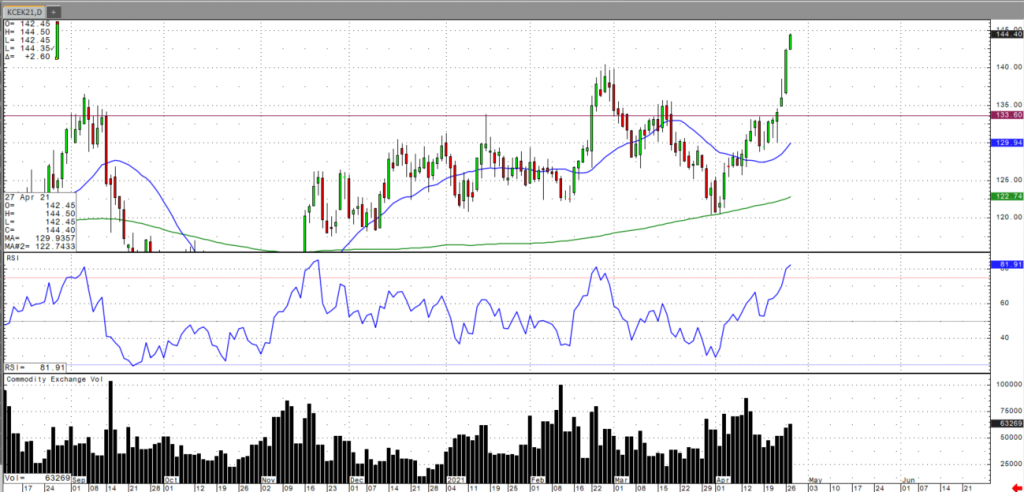
Dry weather in Brazil has precipitated this aggressive rally, allowing May coffee futures prices to easily clear the 50-day moving average, with the 1.50 level on the horizon. Tight supply outlook, coupled with increasing demand have prompted the May coffee futures prices to break above the February 140 highs, but RSI levels are in extremely overbought territories at this point.
In my last article, I stated that “May coffee has is beginning a reversal up H&S pattern with a break above the pattern’s 1.30 neckline. If this pattern follows through to completion, it carries a measuring objective to 1.39.” This head and shoulder reversal pattern was successfully completed and May coffee now holds support above the last rally high of 1.4045 from February 25th. May coffee will likely retrace back to the 1.40 level before consolidating, which will then determine whether a reversal, or another leg higher will take place.
For more frequent commentary, please check out and subscribe to my daily futures market videos on coffee and other commodities.
Posted on Oct 14, 2022, 07:42 by Dave Toth
On the heels of mid-Sep-to-early-Oct's steeper, accelerated, 3rd-wave-looking recovery, the past week-and-a-half's boringly lateral chop is first considered a corrective/consolidative event that warns of a continuation of the uptrend that preceded it to new highs above 04-Oct's 891.0 high. This count remains consistent with our broader base/correction/recovery count introduced in 13-Sep's Technical Blog following that day's bullish divergence in short-term momentum above 07-Sep's 809.5 minor corrective high detailed in the hourly chart below.
The important takeaway from this month's lateral, sleepy price action is the definition of Wed's 851.5 low as the end or lower boundary of a suspected 4th-Wave correction. A failure below 851.5 will confirm a bearish divergence in daily momentum and defer or threaten a bullish count enough to warrant non-bullish decisions like long-covers. A failure below 851.5 will not necessarily negate a broader bullish count, but it will threaten it enough to warrant defensive measures as the next pertinent technical levels below 851.5 are 13-Sep's prospective minor 1st-Wave high at 813.8 and obviously 08-Sep's 766.0 low. And making non-bullish decisions "down there" is sub-optimal to say the least. Per such, both short- and longer-term commercial traders are advised to pare or neutralize bullish exposure on a failure below 851.5, acknowledging and accepting whipsaw risk- back above 04-Oct's 891.0 high- in exchange for much deeper and sub-optimal nominal risk below 766.0.


On a broader scale, the daily log scale chart above shows the developing potential for a bearish divergence in daily momentum that will be considered confirmed below 851.5. This chart also shows the past month's recovery thus far stalling in the immediate neighborhood of the (888.0) Fibonacci minimum 38.2% retrace of Apr-Sep's entire 1128 - 766 decline). COMBINED with a failure below 851.5, traders would then need to be concerned with at least a larger-degree correction pf the past month's rally and possibly a resumption of Apr-Sep's major downtrend.
Until and unless the market fails below 851.5 however, we would remind longer-term players of the key elements on which our bullish count is predicated:
Thus far, the market is only a month into correcting a 4-MONTH, 32% drawdown, so further and possibly protracted gains remain well within the bounds of a major (suspected 2nd-Wave) correction of Apr-Sep's decline within an even more massive PEAK/reversal process from 17-May's 1219 high on an active continuation basis below.
These issues considered, a bullish policy and exposure remain advised with a failure below 851.5 required to defer or threaten this call enough to warrant moving to a neutral/sideline position. In lieu of such weakness, we anticipate a continuation of the past month's rally to new highs and potentially significant gains above 891.0.


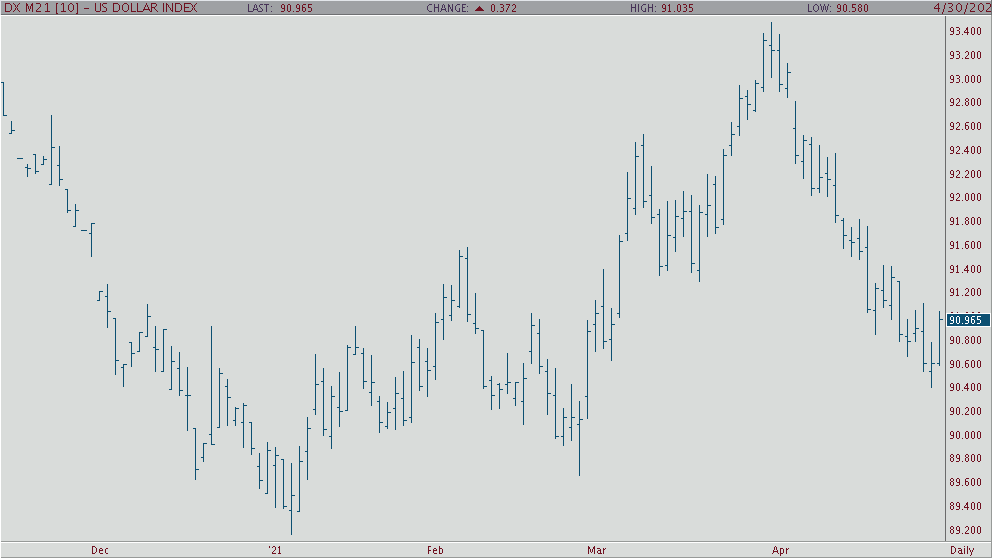
While the press is touting the lengthening of weakness in the USD, it should be noted that the index aggressively rejected yesterdays spike lower move definitively. We think the USD is getting a lift from slightly disappointing Chinese economic data overnight and also from the slight track lower in US treasury prices. From a technical standpoint, daily stochastics are trending lower but have declined into oversold territory now. The short term down trend remains intact with the close below the 9 day MA. Resistance comes in at 9075 and 9095 with support at 9040 and 9020.

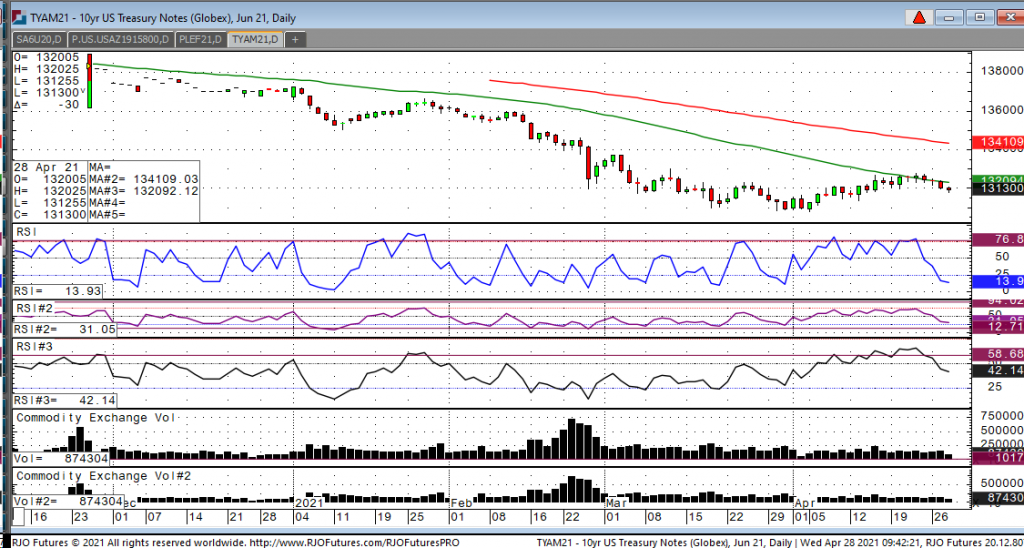
Looking at the June 10-year, we saw a narrow range overnight that has continued into today with a high of 132-025 and a low of 131-255, currently the note sits at 132-01. The market is on guard today with the announcement of the FOMC decision at 1:00p.m. followed by Chairman Powell’s Q&A at 1:30p.m. The market sees no change in rates and expects Powell to continue to remain dovish. The risk lies that Powell hints he is seeing a faster than anticipated uptick in inflation. All one must do is look at recent price action in the grain and lumber contracts to know inflation is already picking up. Another risk the market faces is that Powell hints that the fed will start to taper its bond purchases. Both risks are high because most expect Powell to remain consistent with being dovish. Looking at the charts, I see stiff resistance at the 50-day moving average at 132-095 and support way down at the April 5th low at 130-255. I would look to sell rallies near the 132-095 level if given the opportunity.

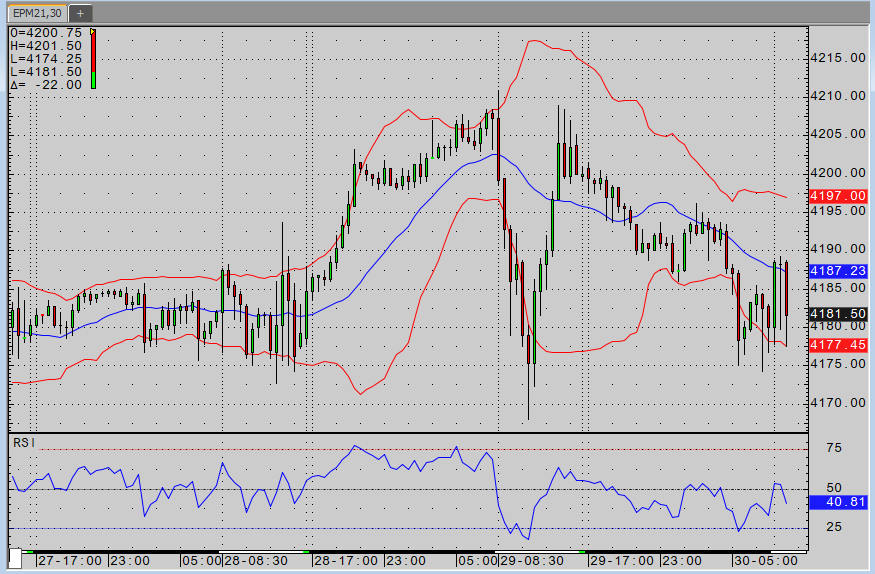
The market is struggling this morning to build on yesterday’s new all-time highs in the S&P and Nasdaq. The four major indices are currently trading about 0.4-0.6% lower on the day. We registered immediate-term overbought signals (I know…) yesterday, taxes are the talk of the town, and rising yields seem to be weighing on tech stocks again. That said, people accumulated piles of cash during the lockdowns, the government is in going full speed ahead on stimulus, many are making more through unemployment than they were while working , earnings have been good, and the Fed has no intention of tapering anytime soon. As such, there continues to be a tremendous desire to accumulate on every dip. It keeps working, so why change up the strategy?
Personal incomes saw a month over month rise of 21.1% thanks to people getting another round of stimulus checks. Chicago PMI came in at 72.1! We haven’t seen a reading that high since the early 80’s. Consumer sentiment rose slightly to 88.3 from the prior reading of 86.5. Next week’s data slate is fairly light, but it will include non-farm payrolls on Friday. Have a great weekend.
Posted on Nov 08, 2022, 07:51 by Dave Toth
In Fri's Technical Webcast we identified a minor corrective low at 2.6328 from Thur as a mini risk parameter the market needed to sustain gains above to maintain a more immediate bullish count. The 240-min chart below shows the market's failure overnight below this level, confirming a bearish divergence in very short-term momentum. This mo failure defines Fri's 2.8172 high as one of developing importance and a parameter from which very short-term traders can objectively base non-bullish decisions like long-covers.
Given the magnitude of the past three weeks' broader recovery however, this short-term momentum failure is of an insufficient scale to conclude anything more than another correction within this broader recovery from 26-Sep's 2.1877 low. Indeed, overnights failure below 2.6328 only allows us to conclude the end of the portion of the month-and-a-half rally from 31-Oct's 2.4822 next larger-degree corrective low. 2.4822 is the risk parameter this market still needs to fail below to break the uptrend from 18-Oct's 2.3526 low while this 2.3526 low remains intact as the risk parameter this market needs to fail below to break the month-and-a-half uptrend. From an intermediate-to-longer-term perspective, this week's setback falls well within the bounds of another correction ahead of further gains. This is another excellent example of the importance of technical and trading SCALE and understanding and matching directional risk exposure to one's personal risk profile.


The reason overnight's admittedly minor mo failure might have longer-term importance is the 2.8172-area from which it stemmed. In Fri's Technical Blog we also noted the market's engagement of the 2.8076-to-2.8159-area marked by the 61.8% retrace of Jun0-Sewp's 3.2758 -2.1877 decline and the 1.000 progression of Sep-Oct's initial 2.1877 - 2.6185 (suspected a-Wave) rally from 18-Oct's 2.3526 (suspected b-Wave) low. We remind longer-term players that because of the unique and compelling confluence of:
The recovery attempt from 26-Sep's 2.1877 low is arguably only a 3-wave (Wave-2) corrective rebuttal to Jun-Sep's decline within a massive, multi-quarter PEAK/reversal process. Now granted, due to the magnitude of 2020 -2022's secular bull market, we discussed the prospect for this (2nd-Wave corrective) recovery to be "extensive" in terms of both price and time. A "more extensive" correction is typified by a retracement of 61.8% or more and spanning weeks or even months following a 3-month decline. Per such, the (suspected corrective) recovery from 26-Sep's 2.1877 low could easily have further to go, with commensurately larger-degree weakness than that exhibited this week (i.e., a failure below at least 2.4822) required to consider the correction complete. Indeed, the daily log chart above shows the market thus far respecting former 2.6185-area resistance from 10-Oct as a new support candidate.
These issues considered, very shorter-term traders have been advised to move to a neutral/sideline position following overnight's momentum failure below 2.6328, with a recovery above 2.8172 required to negate this call, reaffirm the recovery and re-expose potentially significant gains thereafter. For intermediate- and longer-term players, a bullish policy and exposure remain advised with a failure below 2.4822 required to threaten this call enough to warrant neutralizing exposure. We will be watchful for another bearish divergence in momentum following a recovery attempt that falls short of Fri's 2.8172 high that would be considered the next reinforcing factor to a count calling that 2.8172 high the prospective end to the month-and-a-half 2nd-Wave correction. In lieu of such, a resumption of the current rally to eventual new highs above 2.8172 should not surprise.


Good morning,
Out with April, in with May. Looks like we’ve got a little distribution happening this morning in equities, its about time we’d say to that. Likely profit taking into month end, hopefully opening up some long side entries over the next few weeks.
SPY -0.51%, NQ -0.64%, RTY -0.78%
My take on markets at present:
Europe: Europe looks mixed to higher following a host of European data released overnight. Euro Zone Unemployment Rate fell to 8.1% vs from 8.2% previous and toppling expectations of a RISE of 8.3%.
GER GDP missed Q/Q, but beat expectations Y/Y, the same goes for SPAIN.
European inflation data looks to be accelerating – which may begin to open up opportunities the Short the European Bond market as we think a rise in yields across the pond is likely coming over the next few months. If you’re set up to trade on the EUREX, we may begin so soon.
Energy: We’re getting some back and fill here today, we’re still interested in Oil, Heating Oil, Gasoline, and Natural Gas on the long side. Natural Gas in particular has a much improved situation happening as we speak. Natural Gas is rounding out the month +8.8%. Still more upside we think over the next 2-3 months, we’ll look for long side entries within the range.
Metals: The industrial metals continue to outperform the precious metals space. Copper 4.52, showing few signs of fatigue and +13.5% for the month - $5.00 look to be in play, $4.26 looks like a favorable entry point if we can get some price distribution there.
Silver looks ok for long side trade entries between here and 25.80 we think. The chart remains in a consolidating phase (which leads me to believe it’ll likely be the last commodity to breakout, if at all of course), just lacking a good fundamental demand side story to help lift prices to 27.00 and beyond we think.
Gold, doesn’t look good from a longer-term perspective, but holding 1760-1750 level which keeps 1800 in the cards for Gold. We suppose if Silver can pull it together here, Gold should follow price action higher. Still not a fan of Gold in the current cycle.
Yields/Rates: Still look favorable for further asset price inflation. Interest rates are struggling to find any traction higher (or lower) at the moment. Just chopping around in a 15bps range for the 10yr yield.
US Dollar: There’s a small pocket of the Dollar “doing better” in May we think. Price won’t likely get too far on the upside based on the Monthly chart view. Interest rate markets don’t look favorably for a dollar rally at the moment.
Stocks: We’ll likely wake up to a “scary” story for equity markets, that creates some selling over the next few weeks, and a move in the VIX to the low to mid 20s. What that “narrative” will be, I’ve no idea. The Monthly view of the SP500 is parabolic, so we’re due. BUT, the Fed put is still in place. Any downside we think will be brief in the near-term, and create long side entry opportunities. There’s a bigger period of risk that happens out into mid-summer we think, which we’ve of course been saying Scenario 4 (Growth/Inflation Slowing) is likely in Q3.
The 2 commodity related holdings in my PA are Silver and Nat Gas proxies – they may work, they may not, but….I’m holding because I don’t see any imminent threats of a breakdown in either markets at the present time.