Looking to diversify your investment portfolio with futures trading, but lack the expertise on your own? Trading Systems and their programs are now listed on our website complete with track records, products traded and minimum account requirements and fees. If you need help navigating the site and viewing the results, give us a call.
New: Micro Bitcoin Investor Kit
Bitcoin is on an unprecedented run and is at the forefront of the trend in cryptocurrency and as a response, the CME has released a micro Bitcoin futures contract that is 1/10th the size of a regular Bitcoin futures contract. Learn everything you need to trade the micro Bitcoin futures contract with this Investor Kit!
The Markets
Metals - Gold is Breaking Out to the Upside
Gold is Breaking Out to the Upside
By: Frank J. Cholly, Senior Market StrategistPosted May 7, 2021 8:28AM CT
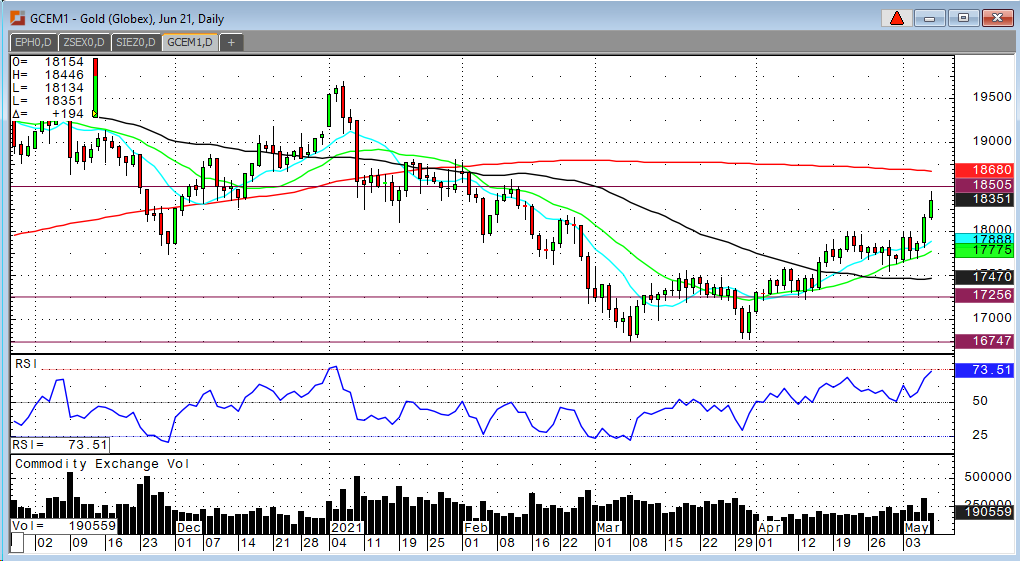
Gold futures had a definitive break out to the upside
yesterday. Early in the session this morning seems to be confirming that the breakout
is real. A close over $1,820 is necessary today. A close over $1,840 would be
very strong.
I don’t think that you can look at commodity prices and NOT see inflation. Energy markets, agricultural markets, copper and lumber are all inflationary and this is not just transitory. This is not like last year’s toilet paper shortage! It’s the real deal inflation beginning to heat up. Gold is continuing to climb away from the $1,675 lows. Another period of consolidation would be in order after this type of break out. The 10 and 20-day moving averages are pointing higher and beginning to fan out. The 50-day moving average looks like it’s about to curve upward now too. The next big level to watch is the 200-day moving average which is at $1,868. Some sideways between $1,825 to $1,850 is more likely over the next week or two.
Gold Jun '21 Daily Chart If you have any questions or would like to discuss the markets further, please feel free to contact me at 800-826-4124 or fcholly@rjofutures.com. Metals - Silver Climbing a Stairway to Heaven?
Silver Climbing a Stairway to Heaven?
By: Eli Tesfaye, Senior Market StrategistPosted May 7, 2021 10:38AM CT
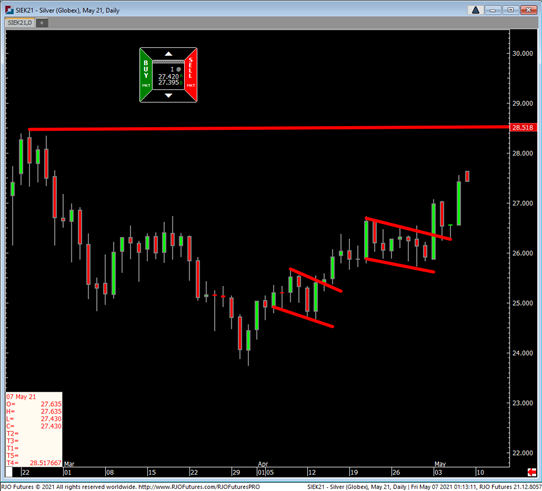
The Silver market is heading higher simply because it is hard to ignore the inflation pressure looming in the background. A quick glance at aggregate CRB commodity index shows that inflation is just around the corner. The list of commodities that are heading higher and making all-time highs are numerous. Have you seen lumber price lately? How about corn, beans and wheat? They are making multi-year highs. You can look at my previous notes to see that I have been keeping potential inflation concern into consideration in projecting silver direction. Current Silver price is $27.47 and most likely heading over $30.00 and staying there. The Fed has mentioned their concerns about inflation, and overall, I think that commodities will remain in bull camp in 2021. So, any strong break in silver price will probably be considered as a buying opportunity rather than a selling opportunity.
Silver May '21 Daily Chart
If you have any questions or would like to discuss the markets further, please feel free to contact me at 800-367-7290 or etesfaye@rjofutures.com. Energy - Oil Poised for Weekly Gain
Oil Poised for Weekly Gain
By: Alex Turro, Senior Market StrategistPosted May 7, 2021 9:44AM CT
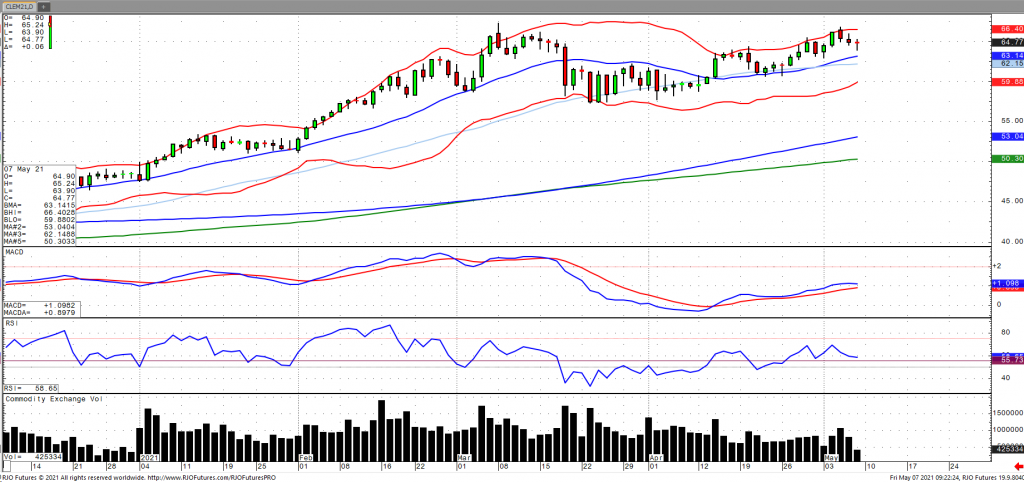
Oil is poised for a weekly gain despite the recent surge in Covid cases in India as optimism surrounding the global economic recovery continues to accelerate as well as subsequent impact on fuel demand. This comes amid reports that Chinese April crude oil imports fell 18.7% month over month as well as reports that key Chinese port levels have reached six-week highs. Notwithstanding, Chinese data showed export growth unexpectedly accelerated in April and the private survey demonstrated an expansion in the activity of the service sector. US inventories fell more than expected by 8 million barrels with exports rising 4.1 million barrels, the most since last March of last year according to the EIA. The market remains bullish trend with today’s range seen between 62.74 – 66.83.
Oil Jun '21 Daily Chart If you have any questions or would like to discuss the markets further, please feel free to contact me at 800-438-4805 or aturro@rjofutures.com. Softs - Slower Recovery Than Expected in Cocoa
Slower Recovery Than Expected in Cocoa
By: Peter MoosesPosted 05/07/2021
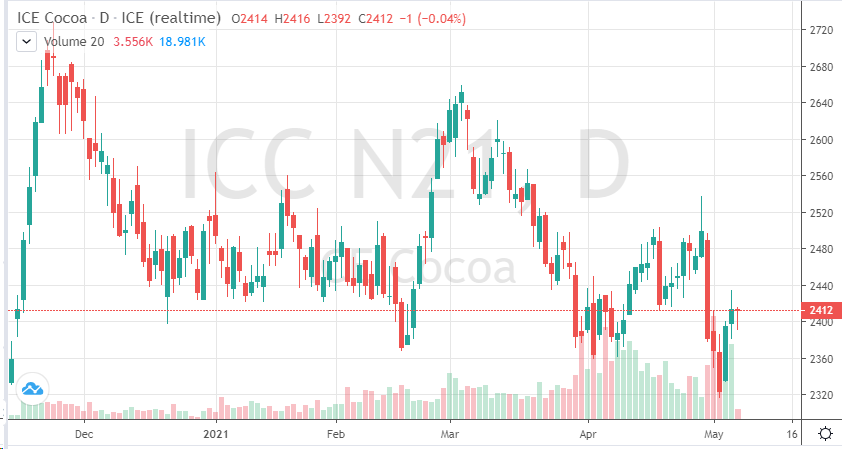
Cocoa
futures hit a 6-month low this week as weakness in demand continues. Outside
markets and possible supply issues stopped that dip from becoming any worse.
The Euro also made a nice recovery helping support cocoa prices in the
short-term. Cocoa’s chart is still looking to find real direction, but this may
take months to occur. Look for volatility through the spring and summer months
as areas of the world continue to ease their Covid restrictions.
If the vaccine process continues at the pace it’s been at, many chocolate companies are hoping for positive purchasing data heading into Q3 when these companies can usually capitalize on the holiday season approaching October through year end. Halloween chocolate sales are a good indictor of where the US is at with consumption outside the pandemic. In the meantime, continue to look for the macro data to guide traders, followed by the currencies correlated to cocoa – until demand can really recover, prices are set to trade in the 2400-2500 range.
On
the heels of mid-Sep-to-early-Oct's steeper, accelerated, 3rd-wave-looking
recovery, the past week-and-a-half's boringly lateral chop is first considered
a corrective/consolidative event that warns of a continuation of the uptrend
that preceded it to new highs above 04-Oct's 891.0 high. This count
remains consistent with our broader base/correction/recovery count introduced
in 13-Sep's Technical Blog following that
day's bullish divergence in short-term momentum above 07-Sep's 809.5 minor
corrective high detailed in the hourly chart below.
The
important takeaway from this month's lateral, sleepy price action is the
definition of Wed's 851.5 low as
the end or lower boundary of a suspected 4th-Wave correction. A failure
below 851.5 will confirm a bearish divergence in daily momentum and defer or
threaten a bullish count enough to warrant non-bullish decisions like
long-covers. A failure below 851.5 will not
necessarily negate a broader bullish count, but it will threaten it enough to
warrant defensive measures as the next pertinent technical levels below 851.5 are
13-Sep's prospective minor 1st-Wave high at 813.8 and obviously 08-Sep's 766.0
low. And making non-bullish decisions "down there" is
sub-optimal to say the least. Per such, both short- and longer-term
commercial traders are advised to pare or neutralize bullish exposure on a
failure below 851.5, acknowledging and accepting whipsaw risk- back above 04-Oct's
891.0 high- in exchange for much deeper and sub-optimal nominal risk below
766.0.
On
a broader scale, the daily log scale chart above shows the developing potential
for a bearish divergence in daily momentum that will be considered confirmed
below 851.5. This chart also shows the past month's recovery thus far
stalling in the immediate neighborhood of the (888.0) Fibonacci
minimum 38.2% retrace of Apr-Sep's entire 1128 - 766 decline). COMBINED
with a failure below 851.5, traders
would then need to be concerned with at least a larger-degree correction pf the
past month's rally and possibly a resumption of Apr-Sep's major downtrend.
Until
and unless the market fails below 851.5 however, we would
remind longer-term players of the key elements on which our bullish count is
predicated:
a confirmed bullish divergence in WEEKLY momentum
(below)
amidst
an
historically low 11% reading in out RJO Bullish Sentiment Index and
a
textbook complete and major 5-wave Elliott sequence down from 29-Apr's
1128 high to 08-Sep's 766.0 low.
Thus
far, the market is only a month into correcting a 4-MONTH, 32% drawdown, so
further and possibly protracted gains remain well within the bounds of a major
(suspected 2nd-Wave) correction of Apr-Sep's decline within an even more
massive PEAK/reversal process from 17-May's 1219 high on an active continuation
basis below.
These
issues considered, a bullish policy and exposure remain advised with a failure
below 851.5 required to defer or threaten this call enough to warrant moving to
a neutral/sideline position. In lieu of such weakness, we anticipate a
continuation of the past month's rally to new highs and potentially significant
gains above 891.0.
Agricultural - Grain Futures Update w/Stephen Davis - 05/07/2021
Grain Futures Update w/Stephen Davis - 05/07/2021
By: Stephen DavisPosted 05/07/2021
Stephen Davis recaps the past week in the grain markets as we continue to see prices soar. Could we be headed to all-time highs?Agricultural - Potential Reversal Coming in Cattle?
Potential Reversal Coming in Cattle?
By: Peter McGinnPosted 05/07/2021
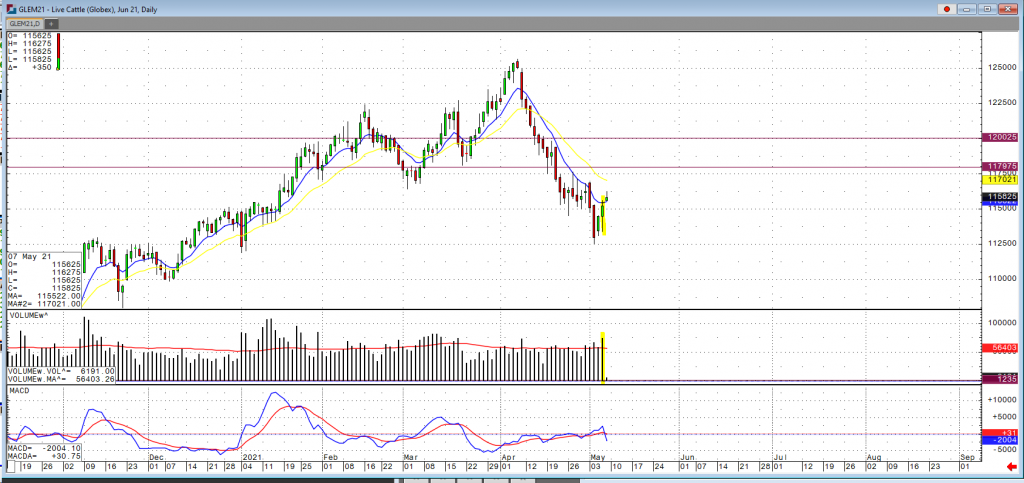
Jun cattle had a strong day yesterday with a sharp recovery
and substantial volume, which may be giving us the indication the bottom is in
and a reversal may be coming in June cattle. Expensive feed costs are also
making traders leery that there may be a short-term bulge in the market which
could eventually have this market make another move lower. The USDA boxed beef
cutout closed $1.59 higher at $306.37. This was up from $293.76 the previous
week and was the highest the cutout had been since June 2, 2020. The 5-day,
5-area weighted average price on Thursday was 118.29, down from 119.01 last
week. This was dominated by a large trade of 12,000 head in Nebraska at 117-118
on Tuesday. Kansas and Texas/Oklahoma traded in a range of 118-119 on Wednesday
and Thursday, with a total volume of 7,915 for the two regions.
The USDA estimated cattle slaughter came in at 115,000 head yesterday. This
brings the total for the week so far to 470,000 head, down from 477,000 last
week but up from 340,000 a year ago. US beef export sales for the week ending
April 29 came in at 16,928 tonnes for 2021 delivery and 161 for 2022 for a
total of 17,089. This was down from 23,572 the previous week and was the lowest
since April 8.
I anticipate the cattle market making a move higher in the short-term on the June contract. Seasonally we are coming into high demand and coupled with strong export number I would put a target at about $118-$120 level before we start seeing some resistance getting hit.
Live Cattle Jun '21 Daily ChartEquity - Jobs Report Cuts into Stock Gains
Jobs Report Cuts into Stock Gains
By: Jeff Yasak, Senior Market StrategistPosted May 7, 2021 9:13AM CT
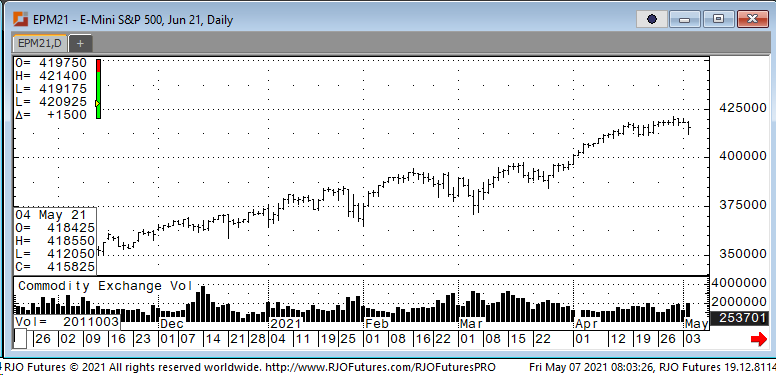
U.S. Stock Futures hung on to their early gains while government issued-bond yields declined after a poor jobs report number that suggested a slowdown in the recovery of the economy. This month’s job report showed that employers added 266,000 jobs with unemployment rising to 6.1%. This was far from the economist’s prediction that jobs would grow by over 1 million and the unemployment rate falling to 5.8%. The 10-year Treasury note was down to 1.509 from 1.561% which was a decline for the sixth consecutive day. The disappointing data added to the concerns of bankers and economists who feel that there is still great downside risk in the U.S. economy recovery. The U.S. is still 8.2 million payrolls short of the pre-Covid pandemic levels and the unemployment rate and labor force participation are still off from the February 2020 levels.
Resistance today is showing 422000 and 423500 with support checking in at 416500 and 412000.
E-mini S&P 500 Jun '21 Daily Chart If you have any questions or would like to discuss the markets further, please feel free to contact me at 888-861-1656 or jyasak@rjofutures.com. Economy - S-T Mo Failure Insufficient to End RBOB Correction, But Beware
S-T Mo Failure Insufficient to End RBOB Correction, But Beware
By: RJO Market InsightsPosted 11/08/2022
Posted on Nov 08, 2022, 07:51 by Dave Toth
In Fri's Technical Webcast we identified a
minor corrective low at 2.6328 from Thur as a mini risk parameter the market
needed to sustain gains above to maintain a more immediate bullish count.
The 240-min chart below shows the market's failure overnight below this level,
confirming a bearish divergence in very short-term momentum. This mo
failure defines Fri's 2.8172 high as
one of developing importance and a parameter from which very short-term traders
can objectively base non-bullish decisions like long-covers.
Given
the magnitude of the past three weeks' broader recovery however, this
short-term momentum failure is of an insufficient scale to conclude anything
more than another correction within this broader recovery from 26-Sep's 2.1877
low. Indeed, overnights failure below 2.6328 only allows us to conclude
the end of the portion of the month-and-a-half rally from 31-Oct's 2.4822 next
larger-degree corrective low. 2.4822 is the
risk parameter this market still needs to fail below to break the uptrend from
18-Oct's 2.3526 low while this 2.3526 low
remains intact as the risk parameter this market needs to fail below to break
the month-and-a-half uptrend. From an
intermediate-to-longer-term perspective, this week's setback falls well within
the bounds of another correction ahead of further gains. This is another
excellent example of the importance of technical and trading SCALE and
understanding and matching directional risk exposure to one's personal risk
profile.
The
reason overnight's admittedly minor mo failure might have longer-term
importance is the 2.8172-area from which it stemmed. In
Fri's Technical Blog we also noted the market's engagement of the
2.8076-to-2.8159-area marked by the 61.8% retrace of Jun0-Sewp's 3.2758 -2.1877
decline and the 1.000 progression of Sep-Oct's initial 2.1877 - 2.6185
(suspected a-Wave) rally from 18-Oct's 2.3526 (suspected b-Wave) low. We
remind longer-term players that because of the unique and compelling confluence
of:
early-Aug's bearish divergence in WEEKLY momentum
amidst
historically
extreme bullish sentiment/contrary opinion levels in our RJO Bullish
Sentiment Index
an
arguably complete and massive 5-wave Elliott sequence from Mar'20's 0.4605
low to Jun's 4.3260 high (as labeled in the weekly log active-continuation
chart below) and
the
5-wave impulsive sub-division of Jun-Sep's (suspected initial 1st-Wave) decline
The
recovery attempt from 26-Sep's 2.1877 low is arguably only a 3-wave (Wave-2)
corrective rebuttal to Jun-Sep's decline within a massive, multi-quarter
PEAK/reversal process. Now granted, due to the magnitude of 2020 -2022's
secular bull market, we discussed the prospect for this (2nd-Wave corrective)
recovery to be "extensive" in terms of both price and time. A
"more extensive" correction is typified by a retracement of 61.8% or
more and spanning weeks or even months following a 3-month decline. Per
such, the (suspected corrective) recovery from 26-Sep's 2.1877 low could easily
have further to go, with commensurately larger-degree weakness than that
exhibited this week (i.e., a failure below at least 2.4822) required
to consider the correction complete. Indeed, the daily log chart above
shows the market thus far respecting former 2.6185-area resistance from 10-Oct
as a new support candidate.
These
issues considered, very shorter-term traders have been advised to move to a neutral/sideline
position following overnight's momentum failure below 2.6328, with a recovery
above 2.8172 required to negate this call, reaffirm the recovery and re-expose
potentially significant gains thereafter. For intermediate- and
longer-term players, a bullish policy and exposure remain advised with a
failure below 2.4822 required to threaten this call enough to warrant
neutralizing exposure. We will be watchful for another bearish divergence
in momentum following a recovery attempt that falls short of Fri's 2.8172 high
that would be considered the next reinforcing factor to a count calling that
2.8172 high the prospective end to the month-and-a-half 2nd-Wave
correction. In lieu of such, a resumption of the current rally to
eventual new highs above 2.8172 should not surprise.
By: Peter MoosesPosted 05/07/2021
Peter Mooses recaps the week that was in futures. We had the jobs number today and it appears to be eating into some late week gains in the market.Economy - Futures Market Insight w/John Caruso - 05/07/2021
Futures Market Insight w/John Caruso - 05/07/2021
By: John Caruso, Senior Market StrategistPosted May 7, 2021 8:25AM CT
I rarely look at the Dow Jones, because quite frankly 30
stocks are NOT the market, but for crying out loud, look at the Dow. It
hardly so much as flinched during this last episodic moment of volatility in
the NASDAQ and SP500. Just an observation. Sure, the tectonic
plates may be shifting a bit underneath the market, but honestly, I’m not so
sure just yet. The SPY is a hair away from a new ATH as I’m drafting this
note at about 9pm May 6th, we’ll see if this ages well by the morning.
Volatility- it appears as if Vol is attempting to
breakout into a higher “regime”. We know, or think at least we think we
know what may be coming in Q3 (July-Sept), and that’s Scenario 4
GROWTH/INFLATION SLOWING. You’ll be the first to know when we go full-on
bearish, I’ve never missed an opportunity to position short inside of a
Scenario 4 set-up.
Bonds/Yields- Clearly there’s been some intervention
in this market, as inflation via rising commodity prices continue to make near
decade highs, and bond yields sag. It begs the question if the Fed is
boxed in, being that they can’t allow rising yields nevertheless raise rates
themselves, because they need to service the debt they’ve created via interest
payments to the bond holders, but also want their cake too in the ability to
stave off hyper-inflation. I don’t know what the Fed (and Treasury) are
attempting here, from Powell’s “we’re not even thinking about thinking about
raising rates”, to Janet Yellen’s gaff on “we may need to raise rates to cool
an overheating economy”. What’s going on here? I don’t know, but
it’s starting to look like a fiasco. They’ve created an environment where
cash is trash, and you’re forced into riskier assets via
stocks/commodities/Crypto to fend off inflation eating into savings. And then
yesterday there was this: https://www.cnbc.com/2021/05/06/fed-warns-of-possible-significant-declines-in-stocks-as-valuations-climb.html
. Yields from my vantage point appear to be attempting to break down into
a LOWER trading range (Bond prices into a higher range) –and of course we’ll
see how this ages following this NFP Employment data this morning. And
I’m personally still short bonds/proxies myself – and this may end up being
wrong, but I’ve been right on this market for a long time too.
Regardless, we think this would be a temporary development and that we’re on
the brink of a multi-year bear market in the Bond market (bull market in
rates), and this is likely to reignite into year end.
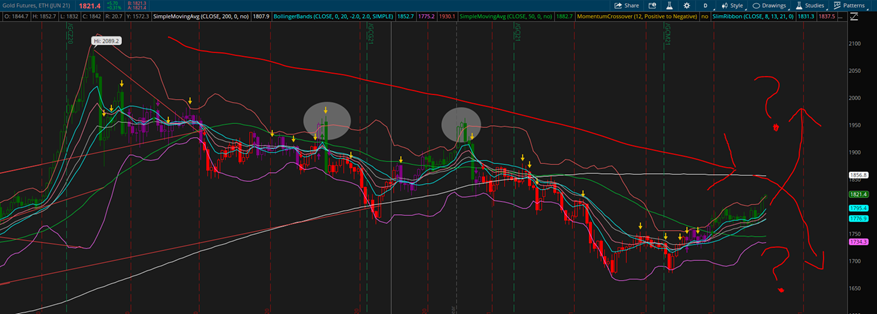
Gold/Silver- Gold remains bearish trend, while Silver
bullish. It’s tough to chew on that, but from our quantitative signal,
that’s the truth for now. Gold should hit some stiff overhead resistance
between here and 1850. I said a week ago that Gold looked “Ok” so long as
it held 1760-50 level, it could run to 1810-1820, and it was correct.
But, now we’ve reached those bear market rally targets we’ll get back on the
sell side. I was bullish of Gold from the end of 2018 until Nov. of 2020,
I’ll be bullish again, just not now. And, if we’re correct on Bonds
entering a multi-year bear market, well we know Gold is not an asset you want
to own in that environment. Still think another smack down is coming in
the Gold market. If I end up being wrong on Gold, I’ll own up to it, and
may actually call William Devane and Rosland Capital in between commercials on
Fox.
Gold Daily Chart (excuse my artwork) – simple fact is, I’m staring at an 8/9 month bear market….this is not a chart I want to own on the long side, yet.
IVOL remains at a Premium in the major indexes – meaning the
bulls are nowhere near complacent, they’re hedged.
If you have any questions or would like to discuss the markets further, please feel free to contact me at 800-669-5354 or jcaruso@rjofutures.com.