Discover how options are priced and learn to read option quotes
How to trade rising and falling markets using options
New: Micro Bitcoin Investor Kit
Bitcoin is on an unprecedented run and is at the forefront of the trend in cryptocurrency and as a response, the CME has released a micro Bitcoin futures contract that is 1/10th the size of a regular Bitcoin futures contract. Learn everything you need to trade the micro Bitcoin futures contract with this Investor Kit!
The Markets
Metals - Gold is Just Biding Time
Gold is Just Biding Time
By: Frank J. Cholly, Senior Market StrategistPosted May 14, 2021 9:28AM CT
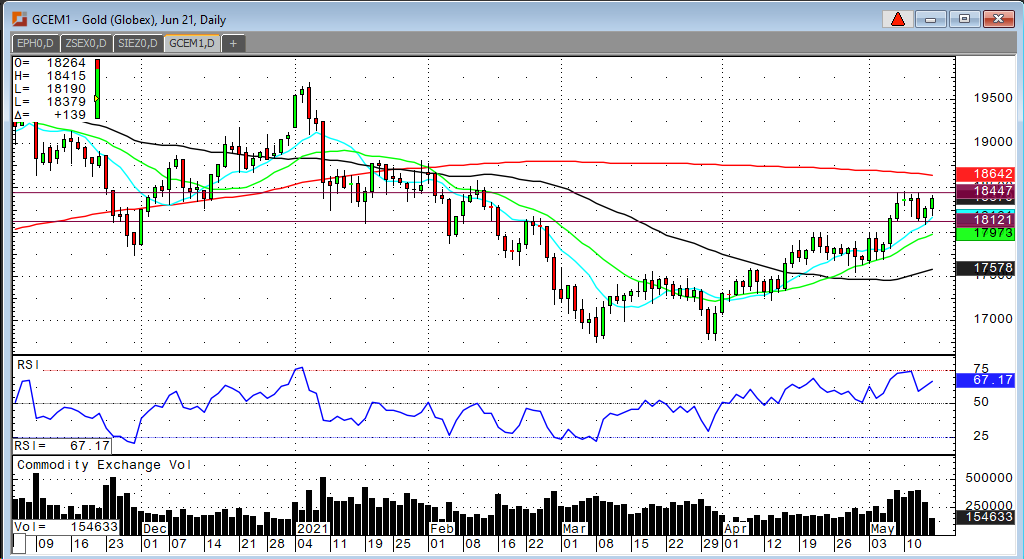
Gold is in another holding pattern, trading sideways and
marking time until the next breakout to the upside. Gold has been holding above
$1,810 and has also been capped by resistance at $1,850. Gold will break out
above $1,850 when the US Dollar drops below .9000. It’s coming! In the
meantime, there is a defined and tradeable range. Try to stay long a deferred
contract month while scalping the front month would be one way to approach this
market.
ETF inflows have been positive. The dollar has been trending lower. Inflation, real inflation that you and I see everyday is here. The government’s measured form of inflation is also becoming undeniable. That’s why they, the Fed speakers, are calling it transitory inflation. They want you to believe there is a “goldy locks” scenario. Not too hot, not too cold. That they will spark inflation, fan the flames and pour gasoline on the flames but be able to keep the fire under control. I don’t buy it. We’re going to continue to throw money at the economy when we already have an all time high of cash sitting and waiting for the economy to fully open. Stay long gold. The low is in!
Gold Jun '21 Daily Chart If you have any questions or would like to discuss the markets further, please feel free to contact me at 800-826-4124 or fcholly@rjofutures.com. Energy - Oil Heading Higher
Oil Heading Higher
By: Alex Turro, Senior Market StrategistPosted May 14, 2021 9:25AM CT
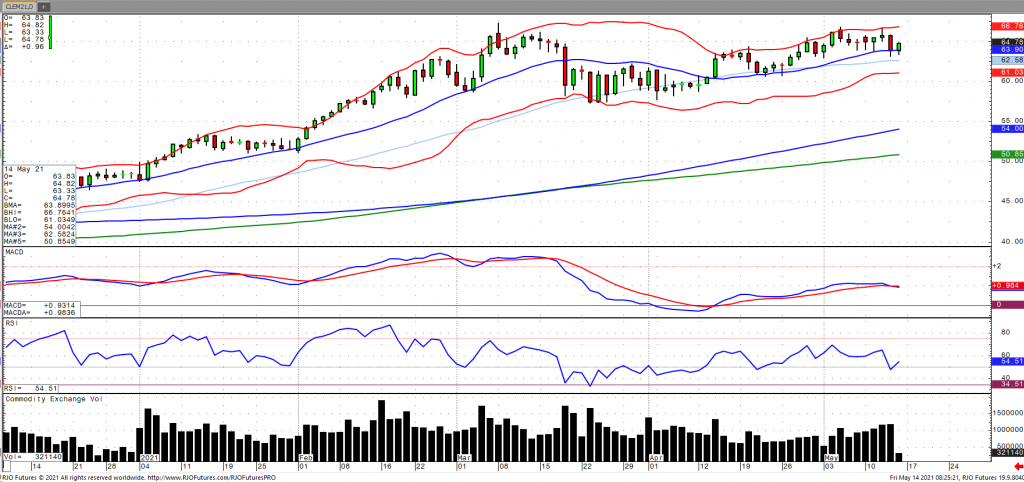
Oil prices are recovering after a more than 2% drop on Thursday following a nearly eight-week high as India’s coronavirus concerns continue to deepen as well as the restart of the Colonial pipeline weighed on sentiment. This comes amid reports that OPEC+ production increased in April as well as reports that US exports were the lowest since 2018 (along with a slight downtick in inventories), according to the EIA. Notwithstanding, both OPEC+ and the IEA raised their global demand forecast for the back half of the year as demand is expected to outweigh supply. Interesting to note, despite the ramp in US equity volatility this week, oil vol (OVX) remained relatively subdued as the market remains bullish trend with today’s range seen between 63.37 – 66.59.
Crude Oil Jun '21 Daily Chart If you have any questions or would like to discuss the markets further, please feel free to contact me at 800-438-4805 or aturro@rjofutures.com. Softs - Cotton Looking Mixed
Cotton Looking Mixed
By: Tony Cholly, Senior Market StrategistPosted May 12, 2021 9:46AM CT
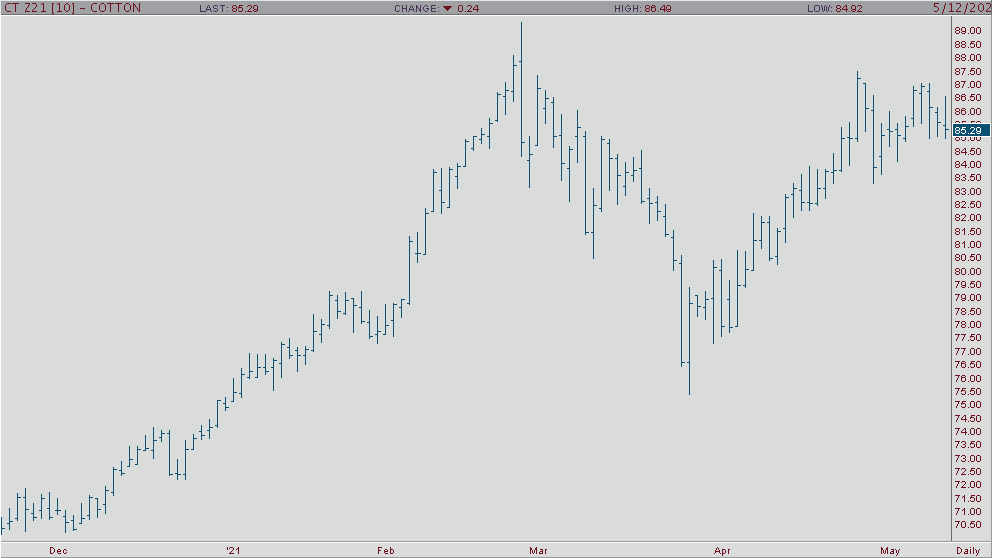
December cotton closed lower Tuesday, but stayed above Mondays low. Outside forces were mixed with June USD modestly lower which should be supportive to cotton. West Texas could get up to .5 inches of rain in the next 5 days, which it desperately needs. The 6-10 day and 8-14 day forecasts have rain in most of Texas besides the far west part of Texas. For the USDA report today, the average trade estimate for US 2021/2022 cotton production is 17.23 million bales vs. 14.70 million for last year. With expectations for declining ending stocks for the new coming crop season, the technical actions remains weak with the market closing lower for 3 days in a row heading into a key USDA update. Resistance comes in at 8850 and 8945 with support at 8700 and 8645.
Cotton Dec '21 Daily Chart If you have any questions or would like to discuss the markets further, please feel free to contact me at 800-826-2270 or tcholly@rjofutures.com. Agricultural - Bullish Canola Count Intact Above Minimum 851.5
Bullish Canola Count Intact Above Minimum 851.5
By: RJO Market InsightsPosted 10/14/2022
Posted on Oct 14, 2022, 07:42 by Dave Toth
On
the heels of mid-Sep-to-early-Oct's steeper, accelerated, 3rd-wave-looking
recovery, the past week-and-a-half's boringly lateral chop is first considered
a corrective/consolidative event that warns of a continuation of the uptrend
that preceded it to new highs above 04-Oct's 891.0 high. This count
remains consistent with our broader base/correction/recovery count introduced
in 13-Sep's Technical Blog following that
day's bullish divergence in short-term momentum above 07-Sep's 809.5 minor
corrective high detailed in the hourly chart below.
The
important takeaway from this month's lateral, sleepy price action is the
definition of Wed's 851.5 low as
the end or lower boundary of a suspected 4th-Wave correction. A failure
below 851.5 will confirm a bearish divergence in daily momentum and defer or
threaten a bullish count enough to warrant non-bullish decisions like
long-covers. A failure below 851.5 will not
necessarily negate a broader bullish count, but it will threaten it enough to
warrant defensive measures as the next pertinent technical levels below 851.5 are
13-Sep's prospective minor 1st-Wave high at 813.8 and obviously 08-Sep's 766.0
low. And making non-bullish decisions "down there" is
sub-optimal to say the least. Per such, both short- and longer-term
commercial traders are advised to pare or neutralize bullish exposure on a
failure below 851.5, acknowledging and accepting whipsaw risk- back above 04-Oct's
891.0 high- in exchange for much deeper and sub-optimal nominal risk below
766.0.
On
a broader scale, the daily log scale chart above shows the developing potential
for a bearish divergence in daily momentum that will be considered confirmed
below 851.5. This chart also shows the past month's recovery thus far
stalling in the immediate neighborhood of the (888.0) Fibonacci
minimum 38.2% retrace of Apr-Sep's entire 1128 - 766 decline). COMBINED
with a failure below 851.5, traders
would then need to be concerned with at least a larger-degree correction pf the
past month's rally and possibly a resumption of Apr-Sep's major downtrend.
Until
and unless the market fails below 851.5 however, we would
remind longer-term players of the key elements on which our bullish count is
predicated:
a confirmed bullish divergence in WEEKLY momentum
(below)
amidst
an
historically low 11% reading in out RJO Bullish Sentiment Index and
a
textbook complete and major 5-wave Elliott sequence down from 29-Apr's
1128 high to 08-Sep's 766.0 low.
Thus
far, the market is only a month into correcting a 4-MONTH, 32% drawdown, so
further and possibly protracted gains remain well within the bounds of a major
(suspected 2nd-Wave) correction of Apr-Sep's decline within an even more
massive PEAK/reversal process from 17-May's 1219 high on an active continuation
basis below.
These
issues considered, a bullish policy and exposure remain advised with a failure
below 851.5 required to defer or threaten this call enough to warrant moving to
a neutral/sideline position. In lieu of such weakness, we anticipate a
continuation of the past month's rally to new highs and potentially significant
gains above 891.0.
Agricultural - Grain Futures Update w/Stephen Davis - 05/14/2021
Grain Futures Update w/Stephen Davis - 05/14/2021
By: Stephen DavisPosted 05/14/2021
Stephen Davis discusses the latest news surrounding the extremely volatile grain markets. As prices keep rising, nobody knows where we could see things going.Interest Rates - Interest Rates Impacted by Surging Grains
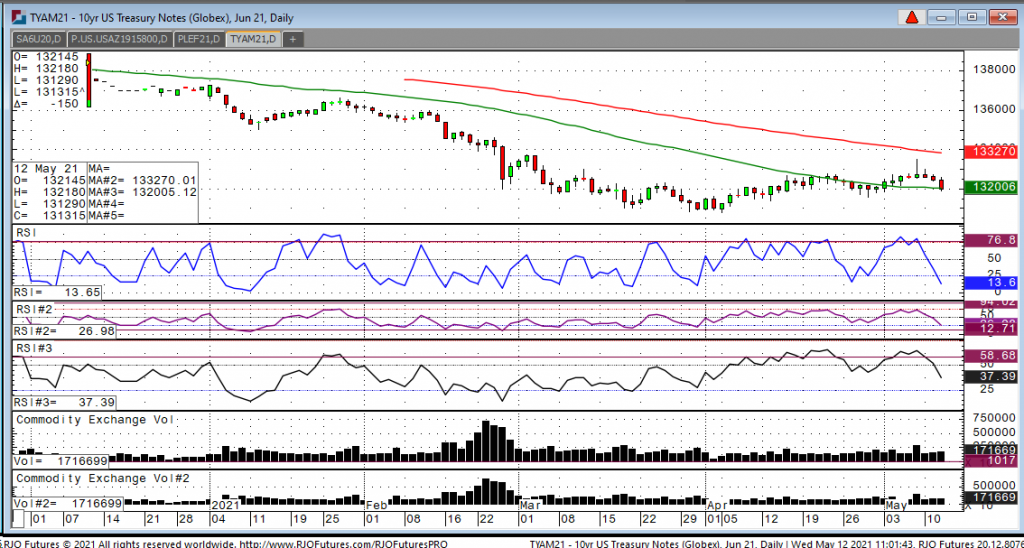
Looking at the June 10-year we have saw an overnight high of 132-18 and a new low this morning of 131-29, we are currently sitting at 131-30. Some noteworthy events have happened, including last Friday's non-farm payroll which came in way under estimates and ignited a sizable rally in the treasury market. But, the treasury yield has since rallied significantly this week on fears of inflation. All one needs to do is look at what the grains have been doing over the last few months. Nothing but straight up. Continued buying from China is certainly reviving the one word that makes treasuries most vulnerable and that is inflation. Go to the local grocery store and see the elevated prices of food that contain grains in them. Prices have gone up considerably in the last few months. In addition to the treasury market, the stock market has been battered this week as well, especially the Nasdaq. If yields continue to rise, it could be a tough go ahead for stocks in general but banking stocks should perform well in this type of environment.
10-Yr Note Jun '21 Daily Chart If you have any questions or would like to discuss the markets further, please feel free to contact me at 800-826-2270 or gperlin@rjofutures.com. Equity - Rally Recover Continues
Rally Recover Continues
By: Bill Dixon, Senior Market StrategistPosted May 14, 2021 9:39AM CT
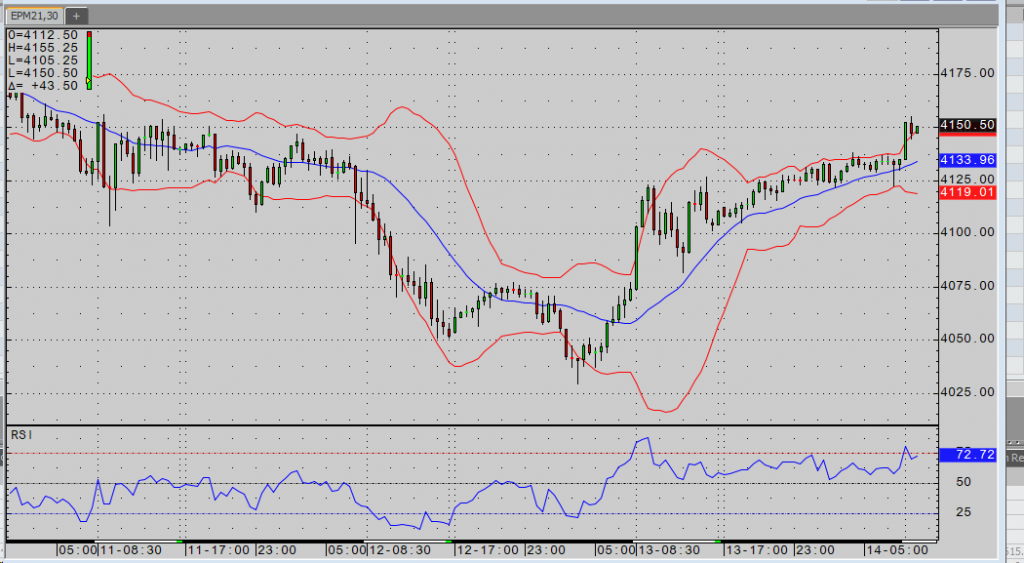
After printing new lows for the move in all four indices
yesterday, they all managed to close in positive territory. That momentum has carried into today as all
four are currently up anywhere from 0.9% to 1.8%. Inflationary concerns are largely being
blamed for the selloff, but you also had Janet Yellen comment that stock
valuations “Generally are quite high” earlier in the month. She went on to suggest interest rates may
need to rise to prevent the economy from “overheating.” Upon receiving some flack for the comments,
she walked them back later in the week.
We also saw the Fed warn of the possibility of significant corrections
as asset prices continue to climb. While
the Fed suggests these inflationary pressures are transitory, Wednesday’s CPI
reading of 4.2 percent certainly raised some eyebrows.
Today’s retail sales figure came out unchanged from last month. We had expected to see an increase of one percent. Consumer sentiment missed by a pretty wide margin, coming in at 82.8 vs. an expected reading of 90.3. Next week’s news slate is relatively light. We’ll see a few housing numbers and the weekly jobless claims number, but traders will be looking ahead to the Q1 GDP reading on the 27th.
E-mini S&P 500 Jun '21 Daily Chart If you have any questions or would like to discuss the markets further, please feel free to contact me at 800-669-5354 or bdixon@rjofutures.com. Economy - S-T Mo Failure Insufficient to End RBOB Correction, But Beware
S-T Mo Failure Insufficient to End RBOB Correction, But Beware
By: RJO Market InsightsPosted 11/08/2022
Posted on Nov 08, 2022, 07:51 by Dave Toth
In Fri's Technical Webcast we identified a
minor corrective low at 2.6328 from Thur as a mini risk parameter the market
needed to sustain gains above to maintain a more immediate bullish count.
The 240-min chart below shows the market's failure overnight below this level,
confirming a bearish divergence in very short-term momentum. This mo
failure defines Fri's 2.8172 high as
one of developing importance and a parameter from which very short-term traders
can objectively base non-bullish decisions like long-covers.
Given
the magnitude of the past three weeks' broader recovery however, this
short-term momentum failure is of an insufficient scale to conclude anything
more than another correction within this broader recovery from 26-Sep's 2.1877
low. Indeed, overnights failure below 2.6328 only allows us to conclude
the end of the portion of the month-and-a-half rally from 31-Oct's 2.4822 next
larger-degree corrective low. 2.4822 is the
risk parameter this market still needs to fail below to break the uptrend from
18-Oct's 2.3526 low while this 2.3526 low
remains intact as the risk parameter this market needs to fail below to break
the month-and-a-half uptrend. From an
intermediate-to-longer-term perspective, this week's setback falls well within
the bounds of another correction ahead of further gains. This is another
excellent example of the importance of technical and trading SCALE and
understanding and matching directional risk exposure to one's personal risk
profile.
The
reason overnight's admittedly minor mo failure might have longer-term
importance is the 2.8172-area from which it stemmed. In
Fri's Technical Blog we also noted the market's engagement of the
2.8076-to-2.8159-area marked by the 61.8% retrace of Jun0-Sewp's 3.2758 -2.1877
decline and the 1.000 progression of Sep-Oct's initial 2.1877 - 2.6185
(suspected a-Wave) rally from 18-Oct's 2.3526 (suspected b-Wave) low. We
remind longer-term players that because of the unique and compelling confluence
of:
early-Aug's bearish divergence in WEEKLY momentum
amidst
historically
extreme bullish sentiment/contrary opinion levels in our RJO Bullish
Sentiment Index
an
arguably complete and massive 5-wave Elliott sequence from Mar'20's 0.4605
low to Jun's 4.3260 high (as labeled in the weekly log active-continuation
chart below) and
the
5-wave impulsive sub-division of Jun-Sep's (suspected initial 1st-Wave) decline
The
recovery attempt from 26-Sep's 2.1877 low is arguably only a 3-wave (Wave-2)
corrective rebuttal to Jun-Sep's decline within a massive, multi-quarter
PEAK/reversal process. Now granted, due to the magnitude of 2020 -2022's
secular bull market, we discussed the prospect for this (2nd-Wave corrective)
recovery to be "extensive" in terms of both price and time. A
"more extensive" correction is typified by a retracement of 61.8% or
more and spanning weeks or even months following a 3-month decline. Per
such, the (suspected corrective) recovery from 26-Sep's 2.1877 low could easily
have further to go, with commensurately larger-degree weakness than that
exhibited this week (i.e., a failure below at least 2.4822) required
to consider the correction complete. Indeed, the daily log chart above
shows the market thus far respecting former 2.6185-area resistance from 10-Oct
as a new support candidate.
These
issues considered, very shorter-term traders have been advised to move to a neutral/sideline
position following overnight's momentum failure below 2.6328, with a recovery
above 2.8172 required to negate this call, reaffirm the recovery and re-expose
potentially significant gains thereafter. For intermediate- and
longer-term players, a bullish policy and exposure remain advised with a
failure below 2.4822 required to threaten this call enough to warrant
neutralizing exposure. We will be watchful for another bearish divergence
in momentum following a recovery attempt that falls short of Fri's 2.8172 high
that would be considered the next reinforcing factor to a count calling that
2.8172 high the prospective end to the month-and-a-half 2nd-Wave
correction. In lieu of such, a resumption of the current rally to
eventual new highs above 2.8172 should not surprise.
Economy - Futures Market Outlook w/John Caruso - 05/13/2021
Futures Market Outlook w/John Caruso - 05/13/2021
By: John Caruso, Senior Market StrategistPosted May 13, 2021 8:40AM CT
Markets crashed through the floor boards yesterday on the CPI “surprise”. It shouldn’t have been a surprise to ANYONE, especially not in this corner. CPI +0.8% vs +0.2% m/m and 4.2% vs 2.6% (MAR) y/y. Deep Scenario 2, Growth and Inflation accelerating. The market move yesterday is likely going to change the technical landscape of the market over the next 1-4 months –Scenario 4 remains the call IN Q3 2021. Technical analysts all over the Twittersphere are calling market tops and blah blah blah, and the bears are getting excited. It might be right, it might be wrong….what I do know is if we are going to Scenario 4 in Q3, there’s going to be plenty of trading opportunities along the way. Tops are a process and quantitatively speaking, all the indexes are immediate OS, BULLISH trend, and of course at the low end of the range. That’s how I’m viewing markets this morning, no panic, just process oriented. And yes, check out the IVOLs – it would appear to me, much of Wall Street was prepped for a day like yesterday via the implied vol option premiums being deeply positive.
UPDATE: PPI accelerated 6.2% vs 4.2% (Mar) y/y
Initial Claims fell to 473K vs 507K previous
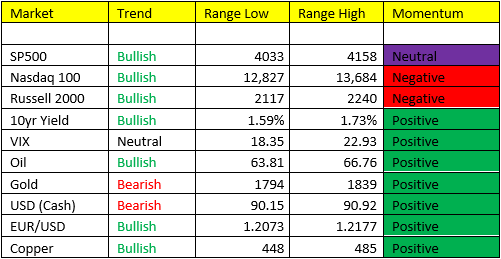
Stock Index Profile:
IVOLs vs 30 Real. Vol. aka the cost to hedge
SPX 72% vs 45% w/w
NQ 49% vs 40% w/w
RTY 53% vs 17% w/w
Heavy premiums indicator interest to hedge via Puts, counter
consensus signal favoring the longs.
CFTC Position:
SPX (19K)
NQ (16.5K)
RTY (23K) nearing the heaviest short position on a 1 yr look
back
Markets have a funny way of pleasing the least amount of
investors, aka the non-consensus view….
A few market comments a la carte:
Nat Gas- still has a positive tilt on the chart, and we remain bullish of energy. Increased US LNG exports remain a central bullish theme, but is it enough to propel us higher. Technical view favors more upside at the moment. We’re hold a long Nat Gas bias on the books with immediate upside to the top of the range 3.08.
Platinum- it’s been a market we’ve been bullish on for a while, not so much at the moment. The weekly view looks toppy and a breakdown could be imminent. The longer-term fundamentals (which I haven’t reviewed lately, but will update my notes this weekend) remain bullish. Platinum looks like a sell side trade from here going forward.
VIX- Massive reflex higher in the vol instruments. Immediate OB here, coupled with immediate OS in stocks. We may be attempting to break into a higher regime of vol, actually we absolutely think we are. But markets are likely to wade back and forth between either side of the range until a definitive trend appears. VIX Neutral trend in the model, with more downside than upside potential near-term.
10yr Yields: approaching the top of our range, you
should be covering up short bond trades, for now.
Good luck,
Some of you have noticed my speaking in terms of momentum lately. Last year around this time, I started to track this momentum indicator and having it paired with my market trend and range signal, I find it to be another credible/accurate tool when making a directional call. So I’ve decided to place it in the range table below for at least a little while.
DISCLAIMER:
The risk of loss in trading futures and/or options is substantial and each investor and/or trader must consider whether this is a suitable investment. Past performance, whether actual or indicated by simulated historical tests of strategies, is not indicative of future results.
If you have any questions or would like to discuss the markets further, please feel free to contact me at 800-669-5354 or jcaruso@rjofutures.com.