Looking to diversify your investment portfolio with futures trading, but lack the expertise on your own? Trading Systems and their programs are now listed on our website complete with track records, products traded and minimum account requirements and fees. If you need help navigating the site and viewing the results, give us a call.
New: Micro Bitcoin Investor Kit
Bitcoin is on an unprecedented run and is at the forefront of the trend in cryptocurrency and as a response, the CME has released a micro Bitcoin futures contract that is 1/10th the size of a regular Bitcoin futures contract. Learn everything you need to trade the micro Bitcoin futures contract with this Investor Kit!
The Markets
Metals - Gold Continues to March Higher
Gold Continues to March Higher
By: Frank J. Cholly, Senior Market StrategistPosted May 21, 2021 8:41AM CT
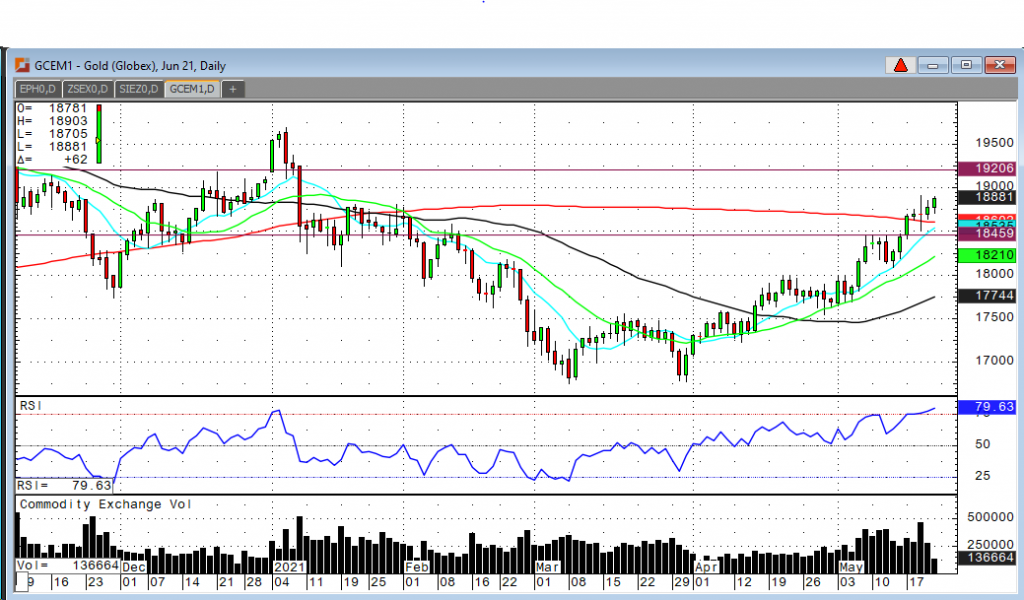
The gold trade seems to be a little too easy recently,
incrementally working its way higher since putting in a low of $1,677.30 on
March 31st. Or is gold finally behaving the way one would expect in
an inflationary environment? Who cares? Go with the trend! Use the chart and
track the US Dollar. I fully expect the rally in gold to continue even as I
would expect that the treasury yields in the ten-year notes to rise. The shock
of the sharp rise in rates is over. There has been a necessary pause and much
debate about rising rates and the prospects of inflation. Inflation is real and
gold likes inflation. Gold should not have too much difficulty breaking out
above $1,900, especially as the Dollar looks capable of testing .8900.
So, yea, it looks like an easy trade right now. It’s a
friendly trend. Remember the adage, “Don’t confuse a bull market for genius”.
More importantly, remember to practice good risk management when trading
commodity futures. Use options or stop loss orders. Work with a professional.
I’m bullish metals and commodities in general as we have too many dollars chasing too few goods. Gold is assuming the leadership roll once again. Keep it simple!
Gold Jun '21 Daily Chart If you have any questions or would like to discuss the markets further, please feel free to contact me at 800-826-4124 or fcholly@rjofutures.com. Metals - Silver Struggling to Advance Higher
Silver Struggling to Advance Higher
By: Eli Tesfaye, Senior Market StrategistPosted May 21, 2021 10:04AM CT
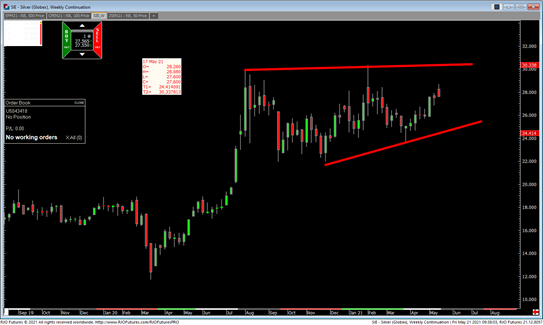
Silver struggles to advance higher and hold as the Fed is signaling that they will taper off. The timetable is not very clear, but enough news to keep the bulls on edge. In the wake of a weaker dollar, silver is struggling to maintain any gain. The technicals still hold positive, but further chart damage could hurt the bull's chance of having gains. Other commodities are cooling off a bit this week in the form of correction. Overall, the trend is your friend; unless silver trades below $25.00, there is a good chance that weakness will be bought rather than sold.
If you want to trade these markets either using futures or options, please let me know.
Silver Daily Chart If you have any questions or would like to discuss the markets further, please feel free to contact me at 800-367-7290 or etesfaye@rjofutures.com. Energy - Oil Prices Rebound but Set for Weekly Loss
Oil Prices Rebound but Set for Weekly Loss
By: Alex Turro, Senior Market StrategistPosted May 21, 2021 10:18AM CT
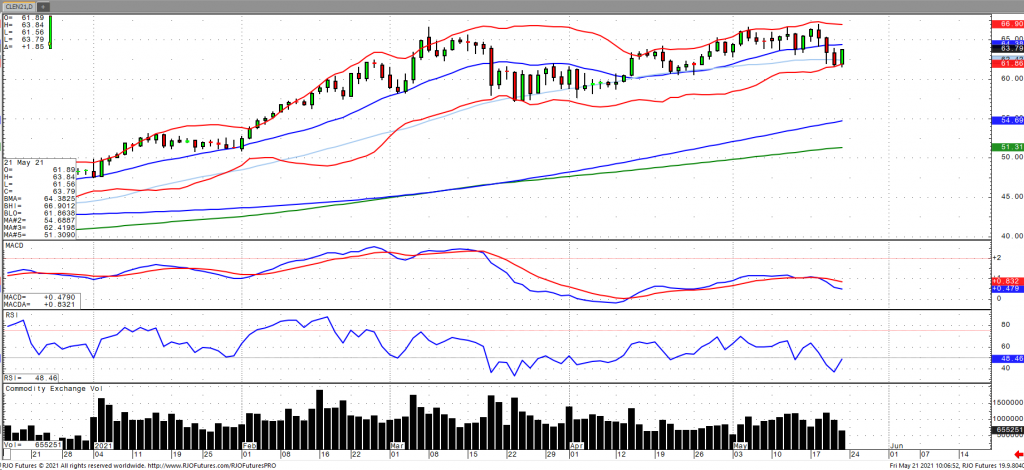
Oil prices are rebounding off a three-session low as reports that Iranian oil is set to come back online by as much as 500k barrels per day (pending sanction relief) as well ongoing demand concerns from Asia (India). This comes amidst reports that Indian oil imports rose by the most since Nov 2019 as global oil supply/demand is expected to settle out for the rest of the year. OPEC+ compliance came in at 113% for April just as production restraints are set to be lifted at the beginning of June. A supportive development comes from the EIA this week as implied gasoline demand readings came in at the highest since the onset of the pandemic. Oil continues to signal bullish trend on the back of falling volatility (OVX) with today’s range seen between 61.73 – 67.72.
Crude Oil Jul '21 Daily Chart If you have any questions or would like to discuss the markets further, please feel free to contact me at 800-438-4805 or aturro@rjofutures.com. Softs - Cocoa Futures - Road to Recovery? Or Groundhog Days?
Cocoa Futures - Road to Recovery? Or Groundhog Days?
By: Peter MoosesPosted 05/21/2021
July
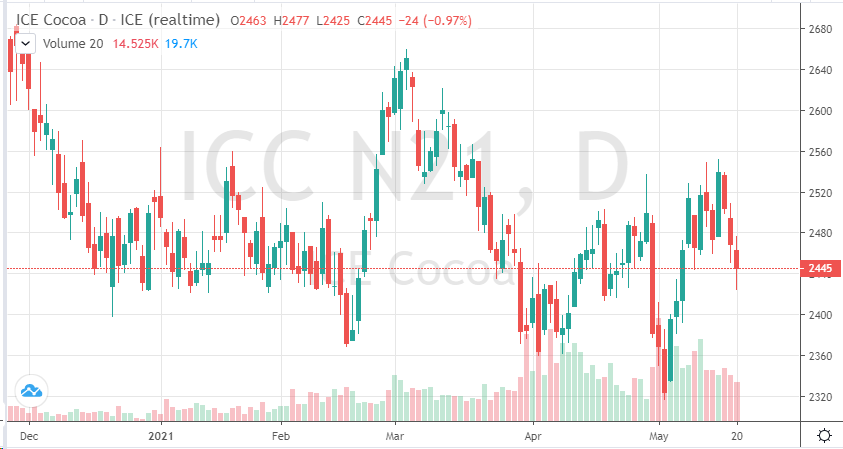
cocoa continues to move lower the past few sessions. Traders have experienced a
choppy few weeks of trading after a small “V” in the chart. Demand is slightly
on the rise as more easing occurs in the U.K. and the U.S. As more vaccinations
are administered, there appears to be an increase in demand for many
commodities. Cocoa in particular, should see a rise in prices, especially later
in the year as we head into Q3. Inflation is also a huge question for the U.S.,
this will have an impact on commodities and how they react to their natural
day-to-day fundamentals.
For now, continue to monitor the Pound and Euro and see the correlation work its way into the cocoa market. Weather premium is also something to watch in the near term, mainly the lower than normal dry spell in West Africa. There is already a robust supply from last year and with a weak demand tone, prices may move a little lower before we see the real recovery take place.
On
the heels of mid-Sep-to-early-Oct's steeper, accelerated, 3rd-wave-looking
recovery, the past week-and-a-half's boringly lateral chop is first considered
a corrective/consolidative event that warns of a continuation of the uptrend
that preceded it to new highs above 04-Oct's 891.0 high. This count
remains consistent with our broader base/correction/recovery count introduced
in 13-Sep's Technical Blog following that
day's bullish divergence in short-term momentum above 07-Sep's 809.5 minor
corrective high detailed in the hourly chart below.
The
important takeaway from this month's lateral, sleepy price action is the
definition of Wed's 851.5 low as
the end or lower boundary of a suspected 4th-Wave correction. A failure
below 851.5 will confirm a bearish divergence in daily momentum and defer or
threaten a bullish count enough to warrant non-bullish decisions like
long-covers. A failure below 851.5 will not
necessarily negate a broader bullish count, but it will threaten it enough to
warrant defensive measures as the next pertinent technical levels below 851.5 are
13-Sep's prospective minor 1st-Wave high at 813.8 and obviously 08-Sep's 766.0
low. And making non-bullish decisions "down there" is
sub-optimal to say the least. Per such, both short- and longer-term
commercial traders are advised to pare or neutralize bullish exposure on a
failure below 851.5, acknowledging and accepting whipsaw risk- back above 04-Oct's
891.0 high- in exchange for much deeper and sub-optimal nominal risk below
766.0.
On
a broader scale, the daily log scale chart above shows the developing potential
for a bearish divergence in daily momentum that will be considered confirmed
below 851.5. This chart also shows the past month's recovery thus far
stalling in the immediate neighborhood of the (888.0) Fibonacci
minimum 38.2% retrace of Apr-Sep's entire 1128 - 766 decline). COMBINED
with a failure below 851.5, traders
would then need to be concerned with at least a larger-degree correction pf the
past month's rally and possibly a resumption of Apr-Sep's major downtrend.
Until
and unless the market fails below 851.5 however, we would
remind longer-term players of the key elements on which our bullish count is
predicated:
a confirmed bullish divergence in WEEKLY momentum
(below)
amidst
an
historically low 11% reading in out RJO Bullish Sentiment Index and
a
textbook complete and major 5-wave Elliott sequence down from 29-Apr's
1128 high to 08-Sep's 766.0 low.
Thus
far, the market is only a month into correcting a 4-MONTH, 32% drawdown, so
further and possibly protracted gains remain well within the bounds of a major
(suspected 2nd-Wave) correction of Apr-Sep's decline within an even more
massive PEAK/reversal process from 17-May's 1219 high on an active continuation
basis below.
These
issues considered, a bullish policy and exposure remain advised with a failure
below 851.5 required to defer or threaten this call enough to warrant moving to
a neutral/sideline position. In lieu of such weakness, we anticipate a
continuation of the past month's rally to new highs and potentially significant
gains above 891.0.
Agricultural - Futures Market Update w/Stephen Davis - 05/21/2021
Futures Market Update w/Stephen Davis - 05/21/2021
By: Stephen DavisPosted 05/21/2021
Stephen Davis discusses the latest news moving the roaring grain markets as we head into the heat of the summer season.Agricultural - Live Cattle Should See Support in Short-Term
Live Cattle Should See Support in Short-Term
By: Peter McGinnPosted 05/21/2021
June cattle continued to trade
lower yesterday with expectations for beef demand to drop considerably after
the holiday. This year may be a little different in the fact that Argentina is
banning exports next month and consumer spending is expected to increase over
the next couple months due to an increase in consumer disposable income. These
factors should keep the market supported for the next couple weeks. I suspect
June cattle finds support at the 115 level before moving higher. Cash live
cattle appear to have softened a bit in the plains. In Kansas on Thursday 1,391
head traded at 119 versus an average of 119.35 last week.In Nebraska 4,352 head
traded at 118-120 with an average price of 119.90 versus 120.32 last week. In
Texas/Oklahoma 665 head traded at 118-119 with an average price of 118.81
versus 119.32 last week. The early selling yesterday drove June cattle all the
way down to 115.70 before a strong recovery. US beef export sales for the week
ending May 13 came in at 56,947 tonnes, up from 13,196 the previous week and
the highest weekly total on record back to at least 2002. Packer profit margins
are extremely high and the continued advance in beef prices this week could
encourage a firm tone to the cash market next week. The USDA boxed beef cutout
was up 14 cents at mid-session yesterday and closed 80 cents higher at $324.18.
This was up from $316.78 the previous week and was the highest the cutout had
been since June 1, 2020. It has increased for nine straight sessions and in 23
out of the last 24.
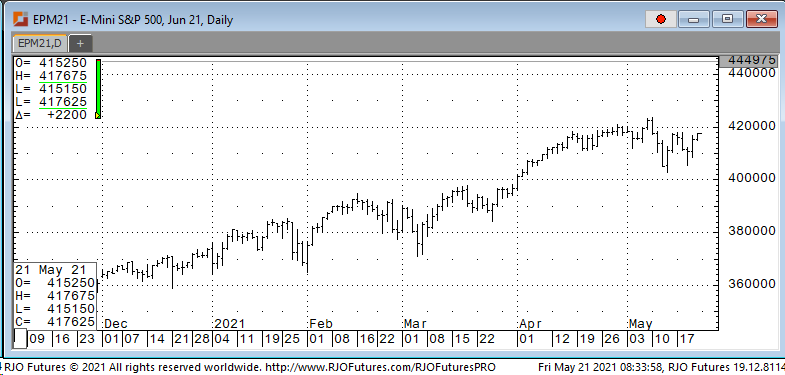
Equity - Stock Futures Looking to Continue Rally
Stock Futures Looking to Continue Rally
By: Jeff Yasak, Senior Market StrategistPosted May 21, 2021 9:31AM CT
U.S. stock indexes
are looking to continue the rally heading into the final session of the week. The markets saw a recovery yesterday after the
jobless claims data was released showing that the labor market was continuing
its recovery. According to the Labor
Depart Thursday’s data had the number of Americans filing first-time jobless
claims at a pandemic low. For the week
ending May 15th 444,000 people filed for unemployment which was
below the analyst’s prediction of 450,000.
This drop in claims shows continued improvement in the labor market as
more Americans are getting vaccinated and returning to work. Even with the positive new data there still
are 8.2 million fewer jobs than there was pre-pandemic. The most recent jobs report had the U.S
adding 266,000 nonfarm jobs while the unemployment rate increased to 6.1%
missing the 5.8% and 978,000 predictions.
Support today is 411000 and 406000 with resistance showing 419600 and 422500.
E-mini S&P 500 Jul '21 Daily Chart If you have any questions or would like to discuss the markets further, please feel free to contact me at 888-861-1656 or jyasak@rjofutures.com. Economy - S-T Mo Failure Insufficient to End RBOB Correction, But Beware
S-T Mo Failure Insufficient to End RBOB Correction, But Beware
By: RJO Market InsightsPosted 11/08/2022
Posted on Nov 08, 2022, 07:51 by Dave Toth
In Fri's Technical Webcast we identified a
minor corrective low at 2.6328 from Thur as a mini risk parameter the market
needed to sustain gains above to maintain a more immediate bullish count.
The 240-min chart below shows the market's failure overnight below this level,
confirming a bearish divergence in very short-term momentum. This mo
failure defines Fri's 2.8172 high as
one of developing importance and a parameter from which very short-term traders
can objectively base non-bullish decisions like long-covers.
Given
the magnitude of the past three weeks' broader recovery however, this
short-term momentum failure is of an insufficient scale to conclude anything
more than another correction within this broader recovery from 26-Sep's 2.1877
low. Indeed, overnights failure below 2.6328 only allows us to conclude
the end of the portion of the month-and-a-half rally from 31-Oct's 2.4822 next
larger-degree corrective low. 2.4822 is the
risk parameter this market still needs to fail below to break the uptrend from
18-Oct's 2.3526 low while this 2.3526 low
remains intact as the risk parameter this market needs to fail below to break
the month-and-a-half uptrend. From an
intermediate-to-longer-term perspective, this week's setback falls well within
the bounds of another correction ahead of further gains. This is another
excellent example of the importance of technical and trading SCALE and
understanding and matching directional risk exposure to one's personal risk
profile.
The
reason overnight's admittedly minor mo failure might have longer-term
importance is the 2.8172-area from which it stemmed. In
Fri's Technical Blog we also noted the market's engagement of the
2.8076-to-2.8159-area marked by the 61.8% retrace of Jun0-Sewp's 3.2758 -2.1877
decline and the 1.000 progression of Sep-Oct's initial 2.1877 - 2.6185
(suspected a-Wave) rally from 18-Oct's 2.3526 (suspected b-Wave) low. We
remind longer-term players that because of the unique and compelling confluence
of:
early-Aug's bearish divergence in WEEKLY momentum
amidst
historically
extreme bullish sentiment/contrary opinion levels in our RJO Bullish
Sentiment Index
an
arguably complete and massive 5-wave Elliott sequence from Mar'20's 0.4605
low to Jun's 4.3260 high (as labeled in the weekly log active-continuation
chart below) and
the
5-wave impulsive sub-division of Jun-Sep's (suspected initial 1st-Wave) decline
The
recovery attempt from 26-Sep's 2.1877 low is arguably only a 3-wave (Wave-2)
corrective rebuttal to Jun-Sep's decline within a massive, multi-quarter
PEAK/reversal process. Now granted, due to the magnitude of 2020 -2022's
secular bull market, we discussed the prospect for this (2nd-Wave corrective)
recovery to be "extensive" in terms of both price and time. A
"more extensive" correction is typified by a retracement of 61.8% or
more and spanning weeks or even months following a 3-month decline. Per
such, the (suspected corrective) recovery from 26-Sep's 2.1877 low could easily
have further to go, with commensurately larger-degree weakness than that
exhibited this week (i.e., a failure below at least 2.4822) required
to consider the correction complete. Indeed, the daily log chart above
shows the market thus far respecting former 2.6185-area resistance from 10-Oct
as a new support candidate.
These
issues considered, very shorter-term traders have been advised to move to a neutral/sideline
position following overnight's momentum failure below 2.6328, with a recovery
above 2.8172 required to negate this call, reaffirm the recovery and re-expose
potentially significant gains thereafter. For intermediate- and
longer-term players, a bullish policy and exposure remain advised with a
failure below 2.4822 required to threaten this call enough to warrant
neutralizing exposure. We will be watchful for another bearish divergence
in momentum following a recovery attempt that falls short of Fri's 2.8172 high
that would be considered the next reinforcing factor to a count calling that
2.8172 high the prospective end to the month-and-a-half 2nd-Wave
correction. In lieu of such, a resumption of the current rally to
eventual new highs above 2.8172 should not surprise.
By: Peter MoosesPosted 05/21/2021
Peter Mooses discusses some current opportunities in the futures markets like metals and grains as we head into the weekend.Economy - Futures Market Outlook w/John Caruso - 05/21/2021
Futures Market Outlook w/John Caruso - 05/21/2021
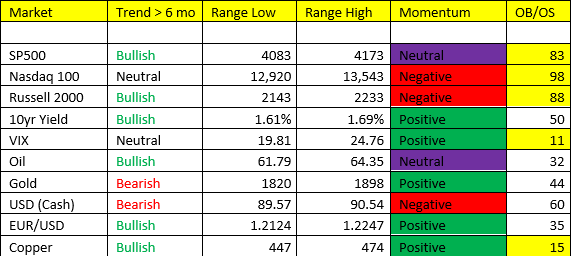
By: John Caruso, Senior Market StrategistPosted May 21, 2021 8:48AM CT
Stocks: A steady melt-up in the equity space
yesterday right off the opening bell – the NASDAQ led the way +2.0%. US
Initial Claims hit a pandemic low mark of 444K vs 474K in the prior week, and
the some members of the Fed began to open up the “QE taper” discussion.
Off the open all of the major indices are going to open up in immediate OB
territory, with neutral and negative momentum. All of the >6 mos.
trends, except for Nasdaq (Neutral trend) remain bullish. If markets
continue to stretch, we may see another shift in momentum on Monday or Tuesday,
but the probabilities suggest a pullback off the open – we’ll have to wait and
see. IVOLs remain at a PREMIUM in stocks.
Energy/Oil: Energy including oil and natural gas signaled immediate OS at the close of business yesterday. The market told tales of US/Iran agreements, cease fires, and pipeline construction – all of which may be true, but the math said “Buy” yesterday. So we allocated a small position long in Crude and Natural Gas. I think that’s why some struggle with my decision making process – because most investors jump from headline to headline and chase the market action. The facts in the model suggested that oil was bullish trend, AT the low end of the range, bullish inside of Scenario 2, and immediate OS. That’s really what the call boiled down too.
BONDS/Yields: Bonds are going to open up immediate OB/Yields immediate OS. What’s the next catalyst for a jump in yields? Perhaps the US Non Farm Payrolls due out in 2 weeks. We had a big surprise miss in the headline number (missed by approx. 700K jobs), I’d expect differently this go around AND perhaps some sharp revisions. We remain bullish of US Employment from here. UP in Yields, could also translate into DOWN Gold as well. There’s a trade here I think.
We’ve got some PMI and Housing data due up here shortly.
If you have any questions or would like to discuss the markets further, please feel free to contact me at 800-669-5354 or jcaruso@rjofutures.com.