Bitcoin is on an unprecedented run and is at the forefront of the trend in cryptocurrency and as a response, the CME has released a micro Bitcoin futures contract that is 1/10th the size of a regular Bitcoin futures contract. Learn everything you need to trade the micro Bitcoin futures contract with this Investor Kit!
The Markets
Metals - Gold's Uptrend Still Intact
Gold's Uptrend Still Intact
By: Frank J. Cholly, Senior Market StrategistPosted Jun 4, 2021 8:42AM CT
A sharp sell off in gold and other precious metals yesterday seemingly a result of an uptick in rates along with a bounce in the Dollar. We continue to hear so much chatter about inflation and that is the biggest factor driving gold recently and will continue to be the driving force behind future rallies. Of course inflation will lead to higher rates and higher rates will eventually lead to Dollar strength but don’t think for a minute that the Biden Administration is going to take their foot off the pedal. Not gonna happen! The Dollar is going to have a bounce here and there, and gold will have a dip here and there. Buy those dips is my recommendation. Gold came down and kissed the 200 DMA this morning at $1,855.90. Now we need to see gold prices north of $1,900 again. The 50 DMA is still way down at $1,805 but is quickly climbing towards the 200 DMA. When that 50 DMA crosses above the 200 DMA, you better be long. The “Golden Cross” is one of the best technical signals for gold. I think gold is still on the right track to see a continuation of the rally. Gold is in a bull market and inflation is heating up in things that every day people need…food, energy and housing. Once those wages start to move higher, and they must, to compete with unemployment benefits. You will see inflation really begin to heat up. Gold still is a good value longer term.
Gold Aug '21 Daily Chart If you have any questions or would like to discuss the markets further, please feel free to contact me at 800-826-4124 or fcholly@rjofutures.com. Metals - Upside in Silver
Upside in Silver
By: Eli Tesfaye, Senior Market StrategistPosted Jun 4, 2021 11:30AM CT
Front-month December Silver is trading at $27.95, up about 44-cents. Today has been full of favorable data to support the metals in general, and silver is no exception. Below I have attached a long-term chart to give you an idea of price points that the silver contract may visit. The trend is your friend. With commodities heating up, inflation talks are circulating in the markets. In my view, any weakness in silver would be bought rather than sold. Silver could find firm support as the US dollar index continues to retest below 90.00 levels and talks of central banks possibly devaluing the dollar. I wouldn’t consider silver in bearish territory unless it traded below $22.00 and perhaps an upside target of $35.00. If you are looking to participate in the upside, we could consider using options with defined risk.
Silver Monthly Chart If you have any questions or would like to discuss the markets further, please feel free to contact me at 800-367-7290 or etesfaye@rjofutures.com. Energy - Oil at Two-Year High
Oil at Two-Year High
By: Alex Turro, Senior Market StrategistPosted Jun 4, 2021 9:31AM CT
Oil prices are closing in on two-year highs as OPEC+ has agreed to continue to restrain oil output coupled with ongoing optimism regarding the recovery of global demand. Despite the current supply restraints, OPEC+ is expected to increase output in August following their July 1st meeting. Discussions between the US and Iran have slowed this week with tempered expectations of an increase in Iranian output. Weekly inventory report appeared mixed with a larger than expected draw in supply coupled with a rise in inventories for gasoline and a downtick in in the implied demand readings for gasoline (albeit third week above 9 million bpd), according to the EIA. The market remains bullish trend as oil volatility (OVX) continues to settle around the 30 handle with today’s range seen between 65.13 – 69.89.
Jul '21 Daily Chart If you have any questions or would like to discuss the markets further, please feel free to contact me at 800-438-4805 or aturro@rjofutures.com. Softs - Confused Cocoa Futures
Confused Cocoa Futures
By: Peter MoosesPosted 06/04/2021
Looking
at a July cocoa chart, you can see the lack of direction. After a recovery in
May, most of the rally has been given back. Recent consolidation has traders
confused on cocoa’s next move. Certain areas of the world are anticipating an
increase in demand as covid restrictions lift, others are left with the
possibility of restrictions being tightened again. Most of this depends on the
availability of vaccines in parts of the world.
Cocoa
supply doesn’t appear to be a problem. Exports are ahead of last season.
Weather could become an issue – with little rain expected and high
temperatures, mid-crop could be negatively affected. The currencies may also
help cocoa find support at these levels.
As we reach oversold levels, we’ll see what the COT data shoes us as well this week. Look for support to hold at 2385, if this occurs a bottom may have been reached.
On
the heels of mid-Sep-to-early-Oct's steeper, accelerated, 3rd-wave-looking
recovery, the past week-and-a-half's boringly lateral chop is first considered
a corrective/consolidative event that warns of a continuation of the uptrend
that preceded it to new highs above 04-Oct's 891.0 high. This count
remains consistent with our broader base/correction/recovery count introduced
in 13-Sep's Technical Blog following that
day's bullish divergence in short-term momentum above 07-Sep's 809.5 minor
corrective high detailed in the hourly chart below.
The
important takeaway from this month's lateral, sleepy price action is the
definition of Wed's 851.5 low as
the end or lower boundary of a suspected 4th-Wave correction. A failure
below 851.5 will confirm a bearish divergence in daily momentum and defer or
threaten a bullish count enough to warrant non-bullish decisions like
long-covers. A failure below 851.5 will not
necessarily negate a broader bullish count, but it will threaten it enough to
warrant defensive measures as the next pertinent technical levels below 851.5 are
13-Sep's prospective minor 1st-Wave high at 813.8 and obviously 08-Sep's 766.0
low. And making non-bullish decisions "down there" is
sub-optimal to say the least. Per such, both short- and longer-term
commercial traders are advised to pare or neutralize bullish exposure on a
failure below 851.5, acknowledging and accepting whipsaw risk- back above 04-Oct's
891.0 high- in exchange for much deeper and sub-optimal nominal risk below
766.0.
On
a broader scale, the daily log scale chart above shows the developing potential
for a bearish divergence in daily momentum that will be considered confirmed
below 851.5. This chart also shows the past month's recovery thus far
stalling in the immediate neighborhood of the (888.0) Fibonacci
minimum 38.2% retrace of Apr-Sep's entire 1128 - 766 decline). COMBINED
with a failure below 851.5, traders
would then need to be concerned with at least a larger-degree correction pf the
past month's rally and possibly a resumption of Apr-Sep's major downtrend.
Until
and unless the market fails below 851.5 however, we would
remind longer-term players of the key elements on which our bullish count is
predicated:
a confirmed bullish divergence in WEEKLY momentum
(below)
amidst
an
historically low 11% reading in out RJO Bullish Sentiment Index and
a
textbook complete and major 5-wave Elliott sequence down from 29-Apr's
1128 high to 08-Sep's 766.0 low.
Thus
far, the market is only a month into correcting a 4-MONTH, 32% drawdown, so
further and possibly protracted gains remain well within the bounds of a major
(suspected 2nd-Wave) correction of Apr-Sep's decline within an even more
massive PEAK/reversal process from 17-May's 1219 high on an active continuation
basis below.
These
issues considered, a bullish policy and exposure remain advised with a failure
below 851.5 required to defer or threaten this call enough to warrant moving to
a neutral/sideline position. In lieu of such weakness, we anticipate a
continuation of the past month's rally to new highs and potentially significant
gains above 891.0.
Agricultural - June Cattle Looking to Make a Run
June Cattle Looking to Make a Run
By: Peter McGinnPosted 06/04/2021
June cattle had a very tight range yesterday and the lower slaughter numbers helped support the market. JBS packing numbers are back to full strength, but there were thoughts that beef may have spoiled during the waiting process. Looking at the market going forward, June cattle looks to make a surge higher if it can make a breakthrough the 118 price level. If we see a breakout, then the next upside target would be to 120. The USDA boxed beef cutout was up $1.36 at mid-session yesterday and closed 39 cents higher at $340.55. This was up from $329.49 the previous week and was the highest since June 1, 2020. Cash live cattle continue to trade steady against last week. In Kansas on Thursday, 2,818 head traded at 119-120 with an average price of 119.58 versus an average of 119.56 last week. In Nebraska 3,012 head traded at 120 versus and average of 119.99 last week. With surging beef prices in the past month, packers have been able to buy live inventory at steady prices and this leaves packers with massive profit margins and may encourage steady or higher cash cattle again next week. June cattle is still trading discount to the cash market which has traded near the 119.50-120.00 level this week. The USDA estimated cattle slaughter came in at 120,000 head yesterday. This brings the total for the week so far to 321,000 head, down from 478,000 last week and down from 453,000 a year ago.
Live Cattle Jun '21 Daily ChartEquity - Jobs Data Enough to Lift Stocks
Jobs Data Enough to Lift Stocks
By: Bill Dixon, Senior Market StrategistPosted Jun 4, 2021 9:59AM CT
Nonfarm Payrolls data was released this morning. The number came in at 559k vs. an expected
650k. While that is a bit underwhelming,
it is much improved from last month’s reading of 266k. It should be noted that we also saw a
revision higher in last month’s number of a whopping 12k jobs. The unemployment rate did tick down a bit to
5.8%. Markets seem to be taking the
reading well as it likely buys Powell some time in regards to having more
serious conversations about the tapering timeline. He has stressed in the past that he’ll begin
to consider trimming the $120B in asset purchases the Fed is currently making
each month when and if we reach full employment and we reach the Fed’s goal of
2% inflation.
Labor participation was reported at 61.6%, which was also below expectations. Powell will likely continue to monitor this figure as the 5.8% unemployment figure released today fails to account for the millions of eligible workers that have given up their job searches. He has commented on this situation in the past, and it seems that the U5 and U6 figures are what he’s more concerned with. Labor participation is likely to improve as benefits expire for many recipients, but he’d obviously prefer tapering too late to too early.
E-mini S&P 500 Daily Chart If you have any questions or would like to discuss the markets further, please feel free to contact me at 800-669-5354 or bdixon@rjofutures.com. Economy - S-T Mo Failure Insufficient to End RBOB Correction, But Beware
S-T Mo Failure Insufficient to End RBOB Correction, But Beware
By: RJO Market InsightsPosted 11/08/2022
Posted on Nov 08, 2022, 07:51 by Dave Toth
In Fri's Technical Webcast we identified a
minor corrective low at 2.6328 from Thur as a mini risk parameter the market
needed to sustain gains above to maintain a more immediate bullish count.
The 240-min chart below shows the market's failure overnight below this level,
confirming a bearish divergence in very short-term momentum. This mo
failure defines Fri's 2.8172 high as
one of developing importance and a parameter from which very short-term traders
can objectively base non-bullish decisions like long-covers.
Given
the magnitude of the past three weeks' broader recovery however, this
short-term momentum failure is of an insufficient scale to conclude anything
more than another correction within this broader recovery from 26-Sep's 2.1877
low. Indeed, overnights failure below 2.6328 only allows us to conclude
the end of the portion of the month-and-a-half rally from 31-Oct's 2.4822 next
larger-degree corrective low. 2.4822 is the
risk parameter this market still needs to fail below to break the uptrend from
18-Oct's 2.3526 low while this 2.3526 low
remains intact as the risk parameter this market needs to fail below to break
the month-and-a-half uptrend. From an
intermediate-to-longer-term perspective, this week's setback falls well within
the bounds of another correction ahead of further gains. This is another
excellent example of the importance of technical and trading SCALE and
understanding and matching directional risk exposure to one's personal risk
profile.
The
reason overnight's admittedly minor mo failure might have longer-term
importance is the 2.8172-area from which it stemmed. In
Fri's Technical Blog we also noted the market's engagement of the
2.8076-to-2.8159-area marked by the 61.8% retrace of Jun0-Sewp's 3.2758 -2.1877
decline and the 1.000 progression of Sep-Oct's initial 2.1877 - 2.6185
(suspected a-Wave) rally from 18-Oct's 2.3526 (suspected b-Wave) low. We
remind longer-term players that because of the unique and compelling confluence
of:
early-Aug's bearish divergence in WEEKLY momentum
amidst
historically
extreme bullish sentiment/contrary opinion levels in our RJO Bullish
Sentiment Index
an
arguably complete and massive 5-wave Elliott sequence from Mar'20's 0.4605
low to Jun's 4.3260 high (as labeled in the weekly log active-continuation
chart below) and
the
5-wave impulsive sub-division of Jun-Sep's (suspected initial 1st-Wave) decline
The
recovery attempt from 26-Sep's 2.1877 low is arguably only a 3-wave (Wave-2)
corrective rebuttal to Jun-Sep's decline within a massive, multi-quarter
PEAK/reversal process. Now granted, due to the magnitude of 2020 -2022's
secular bull market, we discussed the prospect for this (2nd-Wave corrective)
recovery to be "extensive" in terms of both price and time. A
"more extensive" correction is typified by a retracement of 61.8% or
more and spanning weeks or even months following a 3-month decline. Per
such, the (suspected corrective) recovery from 26-Sep's 2.1877 low could easily
have further to go, with commensurately larger-degree weakness than that
exhibited this week (i.e., a failure below at least 2.4822) required
to consider the correction complete. Indeed, the daily log chart above
shows the market thus far respecting former 2.6185-area resistance from 10-Oct
as a new support candidate.
These
issues considered, very shorter-term traders have been advised to move to a neutral/sideline
position following overnight's momentum failure below 2.6328, with a recovery
above 2.8172 required to negate this call, reaffirm the recovery and re-expose
potentially significant gains thereafter. For intermediate- and
longer-term players, a bullish policy and exposure remain advised with a
failure below 2.4822 required to threaten this call enough to warrant
neutralizing exposure. We will be watchful for another bearish divergence
in momentum following a recovery attempt that falls short of Fri's 2.8172 high
that would be considered the next reinforcing factor to a count calling that
2.8172 high the prospective end to the month-and-a-half 2nd-Wave
correction. In lieu of such, a resumption of the current rally to
eventual new highs above 2.8172 should not surprise.
Economy - Futures Market Outlook w/John Caruso - 06/04/2021
Futures Market Outlook w/John Caruso - 06/04/2021
By: John Caruso, Senior Market StrategistPosted Jun 4, 2021 8:46AM CT
Good Morning,
Yesterday’s action was interesting to say the least – following the ADP, Initial Claims, and the record ISM Non-MFG PMI data (64.0 vs 62.7 prior) markets fell into a mini-taper/inflation tantrum. Better employment data from here on out only feeds the idea that the worst of the inflation is yet to come, and with the Fed still running its QE at $120B/mo., you’ve got to believe a taper is being discussed inside the walls of the Federal Reserve. We’ve recently thought as early as July, but could they surprise with a June taper? Unlikely in my opinion. But, could a Fed taper spark a Scenario 4 market reaction coupled with slowing y/y Growth/Inflation data (as we expect) – it certainly could, and we’ve had July pegged as a pretty high probability period of risk in markets.
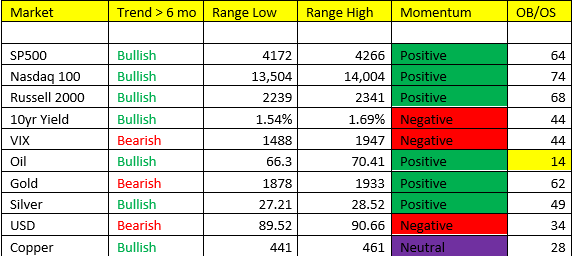
Oil- remains steadfast at 69.00 and looks to be on its way into the 70s. Bullish trend, positive momentum, closing in on the top of the range warrants a “sell some” but we remain bullish of oil prices from here.
Gold- a big wipe out yesterday on higher yields and a Fed taper possibly on deck - offered us an opportunity to look to reposition here. Gold could struggle as Scenario 4 looms in July, but ultimately we think gold will begin to perform much better out into the Fall and into year-end. We still like SILVER better quantitatively speaking, as silver is Bullish trend.
Yields- Bond yields traded up 3bps and have immediate upside to 1.69% in the 10yr. Yields like the idea of stronger employment and the possibility of a Fed taper on deck.
Non-Farm Payrolls are due up in about 15 minutes and so I’m going get going here. 650K expected, 5.9% rate, and keep an eye on wages and revisions from the May number.
If you have any questions or would like to discuss the markets further, please feel free to contact me at 800-669-5354 or jcaruso@rjofutures.com. Economy - Futures Market Outlook w/John Caruso - 06/03/2021
Futures Market Outlook w/John Caruso - 06/03/2021
By: John Caruso, Senior Market StrategistPosted Jun 3, 2021 1:42PM CT
John Caruso discusses the latest news in the futures markets including some bullish momentum in the stock indices. If you have any questions or would like to discuss the markets further, please feel free to contact me at 800-669-5354 or jcaruso@rjofutures.com.