The difference between historical & implied volatility
How to spot regimes of high and low volatility
Which option strategies to apply and when
How to read price action to support your option trades
New: Micro Bitcoin Investor Kit
Bitcoin is on an unprecedented run and is at the forefront of the trend in cryptocurrency and as a response, the CME has released a micro Bitcoin futures contract that is 1/10th the size of a regular Bitcoin futures contract. Learn everything you need to trade the micro Bitcoin futures contract with this Investor Kit!
The Markets
Metals - More Consolidation in Gold Market
More Consolidation in Gold Market
By: Frank J. Cholly, Senior Market StrategistPosted Jun 11, 2021 9:22AM CT
There’s no question that inflation is growing. The only
question is whether inflation will be transitory or long lasting. Clearly the
Fed believes that inflation is transitory and still not willing to even discuss
tapering. I have to believe that behind closed doors, tapering is being
discussed. The bond market doesn’t seem to be concerned at this point either.
The Fed will wait until inflation growth exceeds expectations. Remember these
guys don’t worry about debt when rates are so low. You and I know this spending
is not just wickless, it’s dangerous and won’t end well.
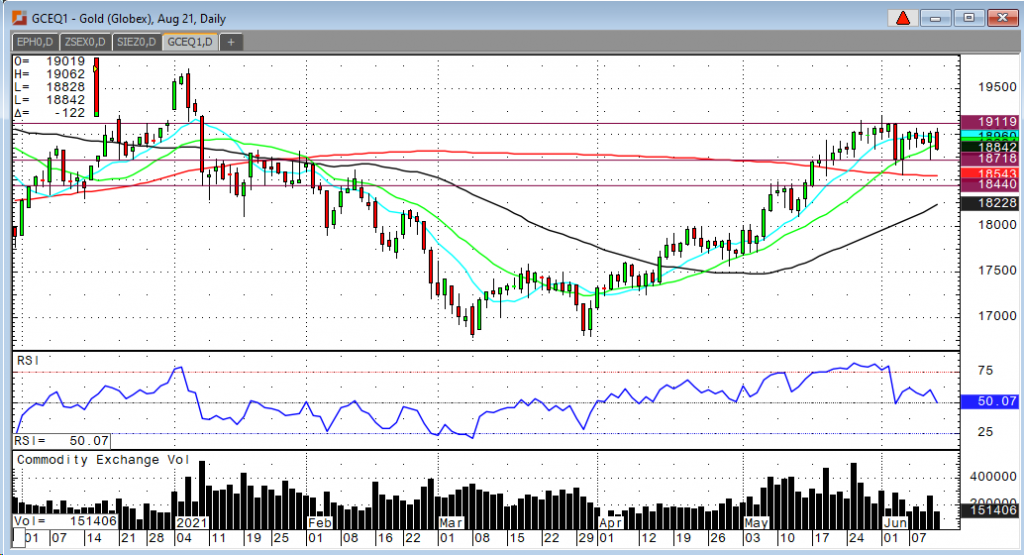
Gold is range bound. A close above $1,916 is needed to drive
follow through rally back towards $1,950 range. However, a close under $1,875
warns of further correction down to $1,845 to $1,850 range.
Silver is poised for a breakout rally but needs a close above $28.50 to confirm. Platinum seems to have found a short term bottom and has potential for a $100 rally in my opinion, based on other metals and daily chart pattern.
Gold Aug '21 Daily Chart If you have any questions or would like to discuss the markets further, please feel free to contact me at 800-826-4124 or fcholly@rjofutures.com. Metals - Silver Looking Potentially Bullish
Silver Looking Potentially Bullish
By: Eli Tesfaye, Senior Market StrategistPosted Jun 11, 2021 11:44AM CT
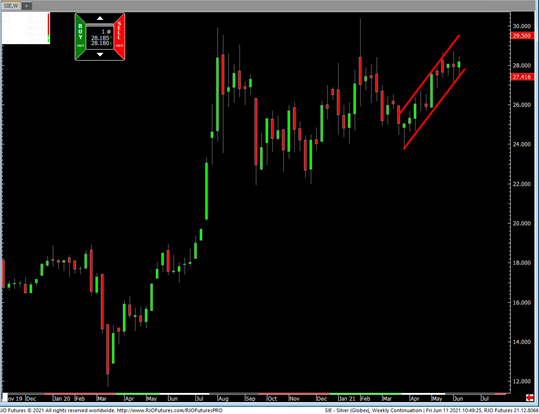
Front-month July is trading 28.185 up 13 cents today. Yesterday's price action is lifting silver in the positive territory keeping it on the uptrend channel. Well, the trend is your friend. The nature of the bull market is that you have to feed it every day. I would expect silver to trade sideways to higher in the coming weeks. Fed signaled to taper, but no timetable is set. There is a lot of cash on the street to revive the economy. If economic recovery is more robust as we minimize remote work, inflation concerns could be popping up. The housing market way too hot, and commodities are firm as silver prices are heading in $30.00 territory.
From a technical perspective, silver will likely see above $30 before we see a low $20.00 A drop under $27.50 alerts for a near-term bear signal, but any strong sell-off should be rejected. Trade under $26.90 will trigger sell-off to $26.25-. A close over 29.00 will drive higher prices.
Silver Daily Chart If you have any questions or would like to discuss the markets further, please feel free to contact me at 800-367-7290 or etesfaye@rjofutures.com. Energy - Oil Continues Inflation Higher
Oil Continues Inflation Higher
By: Alex Turro, Senior Market StrategistPosted Jun 11, 2021 11:31AM CT
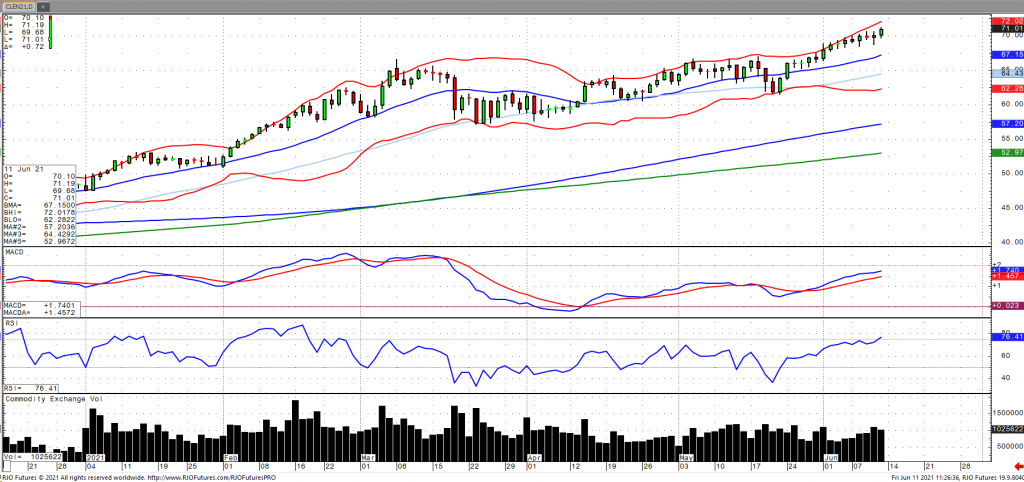
Oil prices are forging new contract highs amid continued optimism surrounding a rebound in global demand. Forecast from the IEA have noted that OPEC+ will need to raise output in the coming year order to compensate for the increase in demand prospects with OPEC+ stating oil demand would rise by 6.6% this year. Oil stocks declined more than expected with the US refinery rate jumping to 91.3%, suggesting an increase in product supply. This comes amid India indicating their intention to enhance their refinery activity by nearly 90% in the coming weeks. Oil remains bullish trend as oil volatility (OVX) continues to collapse with the potential to dip below the 30 handle with today’s range seen between 67.01 – 71.64.
Crude Oil Jul '21 Daily Chart If you have any questions or would like to discuss the markets further, please feel free to contact me at 800-438-4805 or aturro@rjofutures.com. Agricultural - Bullish Canola Count Intact Above Minimum 851.5
Bullish Canola Count Intact Above Minimum 851.5
By: RJO Market InsightsPosted 10/14/2022
Posted on Oct 14, 2022, 07:42 by Dave Toth
On
the heels of mid-Sep-to-early-Oct's steeper, accelerated, 3rd-wave-looking
recovery, the past week-and-a-half's boringly lateral chop is first considered
a corrective/consolidative event that warns of a continuation of the uptrend
that preceded it to new highs above 04-Oct's 891.0 high. This count
remains consistent with our broader base/correction/recovery count introduced
in 13-Sep's Technical Blog following that
day's bullish divergence in short-term momentum above 07-Sep's 809.5 minor
corrective high detailed in the hourly chart below.
The
important takeaway from this month's lateral, sleepy price action is the
definition of Wed's 851.5 low as
the end or lower boundary of a suspected 4th-Wave correction. A failure
below 851.5 will confirm a bearish divergence in daily momentum and defer or
threaten a bullish count enough to warrant non-bullish decisions like
long-covers. A failure below 851.5 will not
necessarily negate a broader bullish count, but it will threaten it enough to
warrant defensive measures as the next pertinent technical levels below 851.5 are
13-Sep's prospective minor 1st-Wave high at 813.8 and obviously 08-Sep's 766.0
low. And making non-bullish decisions "down there" is
sub-optimal to say the least. Per such, both short- and longer-term
commercial traders are advised to pare or neutralize bullish exposure on a
failure below 851.5, acknowledging and accepting whipsaw risk- back above 04-Oct's
891.0 high- in exchange for much deeper and sub-optimal nominal risk below
766.0.
On
a broader scale, the daily log scale chart above shows the developing potential
for a bearish divergence in daily momentum that will be considered confirmed
below 851.5. This chart also shows the past month's recovery thus far
stalling in the immediate neighborhood of the (888.0) Fibonacci
minimum 38.2% retrace of Apr-Sep's entire 1128 - 766 decline). COMBINED
with a failure below 851.5, traders
would then need to be concerned with at least a larger-degree correction pf the
past month's rally and possibly a resumption of Apr-Sep's major downtrend.
Until
and unless the market fails below 851.5 however, we would
remind longer-term players of the key elements on which our bullish count is
predicated:
a confirmed bullish divergence in WEEKLY momentum
(below)
amidst
an
historically low 11% reading in out RJO Bullish Sentiment Index and
a
textbook complete and major 5-wave Elliott sequence down from 29-Apr's
1128 high to 08-Sep's 766.0 low.
Thus
far, the market is only a month into correcting a 4-MONTH, 32% drawdown, so
further and possibly protracted gains remain well within the bounds of a major
(suspected 2nd-Wave) correction of Apr-Sep's decline within an even more
massive PEAK/reversal process from 17-May's 1219 high on an active continuation
basis below.
These
issues considered, a bullish policy and exposure remain advised with a failure
below 851.5 required to defer or threaten this call enough to warrant moving to
a neutral/sideline position. In lieu of such weakness, we anticipate a
continuation of the past month's rally to new highs and potentially significant
gains above 891.0.
Agricultural - Jul Beans Rolling Over; Nov? Not So Fast
Jul Beans Rolling Over; Nov? Not So Fast
By: RJO Market InsightsPosted 06/11/2021
JUL SOYBEANS
Yesterday
and today's relapse below 03-Jun's 15.43 low and our micro risk parameter
discussed in Mon's Technical Blog not only confirms a
bearish divergence in short-term momentum, it leaves Mon's 16.11 high
in its wake as the end of what looks to be a 3-wave recovery from 26-May's
pivotal 14.89 low as labeled in the hourly chart below.
Left unaltered by a recovery above 16.11, this 3-wave recovery
attempt is considered a corrective/consolidative event that satisfies the key
third of our three reversal requirements we've been squawking about since
19-May's bearish divergence in daily momentum (1st requirement) and subsequent
proof of 5-wave impulsive behavior down to 26-May's 14.89 low
(2nd requirement). Combined with waning upside momentum virtually all
year and historically frothy bullish sentiment, we believe the Jul contract is
poised for a major correction/reversal lower.
Per such, Mon's 16.11 high is considered the B- or 2nd-wave of a major correction or reversal lower and our new short-term risk parameter from which traders can base and manage the risk of a newly advised bearish policy and exposure while 12-May's 16.68 high is considered the end of at least the rally from 31-Mar's 13.55 low and possibly then secular bull trend from Apr'20's 8.18 low and our new key long-term risk parameter from which commercial players can objectively base and manage non-bullish decisions like long-covers and new bearish exposure.
Further
proof of weakness below 26-May's 14.89 low remains required to confirm this
major peak/correction/reversal count and expose potentially steep losses
thereafter. The prospect that 12-May's 16.68 high
completed a major 5-wave Elliott sequence from last year's 8.18 low is labeled
in the weekly log active-continuation chart below that also shows waning upside
momentum all year amidst historically frothy sentiment/contrary opinion levels
that haven't been seen since 2012's infamous peak and reversal.
These technical facts and observations are enough to at least question the risk/reward merits of maintaining a bullish policy and, we believe, enough to warrant a new bearish policy and exposure until this market can recoup at least 16.11. In sum, traders are advised to neutralize bearish exposure and move to a new cautious/hedged bearish policy and exposure at-the-market (15.15) with a recovery 16.11 required to threaten this call enough to warrant its cover. In lieu of such 16.11+ strength, further and possibly accelerated losses straight away should not surprise.
NOV SOYBEANS
Conversely, since the Nov contract established a new high for its secular bull trend this past Mon, it has yet to satisfy even the first of our three reversal requirements, with a failure below 03-Jun's 13.97 corrective low and short-term risk parameter required to break the uptrend from even 26-May's 13.25 low, let alone threaten the secular bull. Per such, this 13.97 level serves as our new short-term risk parameter from which traders can objectively rebase and manage the risk of still-advised bullish policy and exposure ahead of a continuation of the secular bull trend.
The
daily log scale chart below shows the obviousness of 26-May's 13.25 larger-degree
corrective low this market remains required to fail below to confirm a bearish
divergence in momentum of a scale sufficient to break the major bull. In this
regard, this 13.25 level remains intact as our key long-term bull risk
parameter. A short-term failure below 13.97 may raise the odds of an
eventual larger-degree failure below 13.25, but we can only cross that bridge
if/when the market takes us there.
These issues considered, a bullish policy and exposure remain advised with a failure below 13.97 required for shorter-term traders to move to the sidelines and for longer-term players to pare exposure to more conservative levels. In lieu of such weakness, this week's setback attempt should not surprise by being only another corrective hiccup within the still-arguable secular bull for new crop.
Equity - Stocks Remain Near ATH's
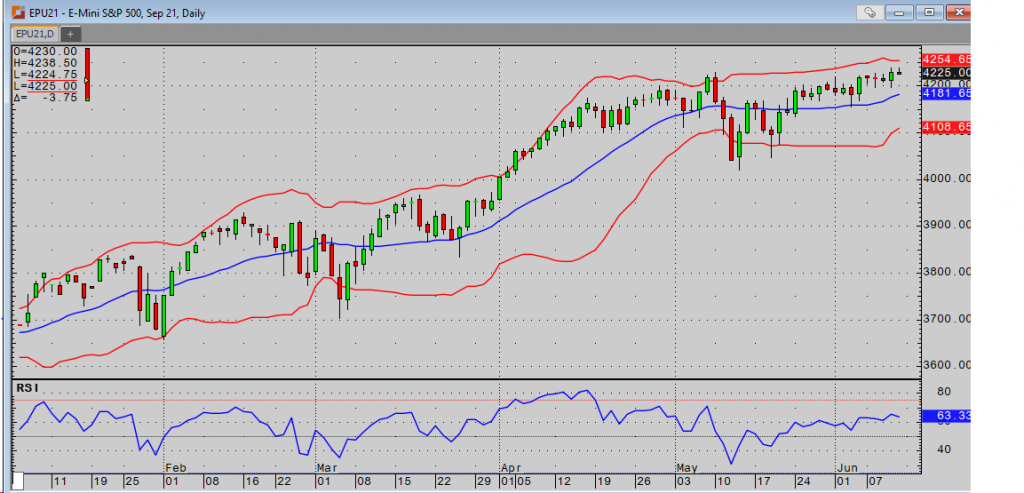
Stocks Remain Near ATH's
By: Bill Dixon, Senior Market StrategistPosted Jun 11, 2021 10:09AM CT
The melt up in indices has continued this week with the
S&P printing a new all-time high during yesterday’s trading session. Despite another hot CPI number, markets don’t
seem terribly worried about the threat of inflation. Fed Chair Powell has consistently said he
views this to be transitory, and perhaps the market agrees. Low interest rates, reopenings, reflation,
and jobs numbers that likely keep tapering talks on the back burner for now
have been enough to keep this market charging higher.
The news slate today is very light. Consumer sentiment improved to 86.4, which is up 4.2% from last month. With nothing else being reported today, traders will be looking forward to next week’s FOMC meeting. Powell has repeatedly mentioned that he’s not interested in tapering until we reach full employment, and I think the pro taper crowd may be disappointed in what he has to say. That said, other members of the FOMC have indicated a willingness to have the discussion as of late, so perhaps they’ll drop some hints on when they may start to pull the reins back a bit.
E-mini S&P 500 Sep '21 Daily Chart If you have any questions or would like to discuss the markets further, please feel free to contact me at 800-669-5354 or bdixon@rjofutures.com. Economy - S-T Mo Failure Insufficient to End RBOB Correction, But Beware
S-T Mo Failure Insufficient to End RBOB Correction, But Beware
By: RJO Market InsightsPosted 11/08/2022
Posted on Nov 08, 2022, 07:51 by Dave Toth
In Fri's Technical Webcast we identified a
minor corrective low at 2.6328 from Thur as a mini risk parameter the market
needed to sustain gains above to maintain a more immediate bullish count.
The 240-min chart below shows the market's failure overnight below this level,
confirming a bearish divergence in very short-term momentum. This mo
failure defines Fri's 2.8172 high as
one of developing importance and a parameter from which very short-term traders
can objectively base non-bullish decisions like long-covers.
Given
the magnitude of the past three weeks' broader recovery however, this
short-term momentum failure is of an insufficient scale to conclude anything
more than another correction within this broader recovery from 26-Sep's 2.1877
low. Indeed, overnights failure below 2.6328 only allows us to conclude
the end of the portion of the month-and-a-half rally from 31-Oct's 2.4822 next
larger-degree corrective low. 2.4822 is the
risk parameter this market still needs to fail below to break the uptrend from
18-Oct's 2.3526 low while this 2.3526 low
remains intact as the risk parameter this market needs to fail below to break
the month-and-a-half uptrend. From an
intermediate-to-longer-term perspective, this week's setback falls well within
the bounds of another correction ahead of further gains. This is another
excellent example of the importance of technical and trading SCALE and
understanding and matching directional risk exposure to one's personal risk
profile.
The
reason overnight's admittedly minor mo failure might have longer-term
importance is the 2.8172-area from which it stemmed. In
Fri's Technical Blog we also noted the market's engagement of the
2.8076-to-2.8159-area marked by the 61.8% retrace of Jun0-Sewp's 3.2758 -2.1877
decline and the 1.000 progression of Sep-Oct's initial 2.1877 - 2.6185
(suspected a-Wave) rally from 18-Oct's 2.3526 (suspected b-Wave) low. We
remind longer-term players that because of the unique and compelling confluence
of:
early-Aug's bearish divergence in WEEKLY momentum
amidst
historically
extreme bullish sentiment/contrary opinion levels in our RJO Bullish
Sentiment Index
an
arguably complete and massive 5-wave Elliott sequence from Mar'20's 0.4605
low to Jun's 4.3260 high (as labeled in the weekly log active-continuation
chart below) and
the
5-wave impulsive sub-division of Jun-Sep's (suspected initial 1st-Wave) decline
The
recovery attempt from 26-Sep's 2.1877 low is arguably only a 3-wave (Wave-2)
corrective rebuttal to Jun-Sep's decline within a massive, multi-quarter
PEAK/reversal process. Now granted, due to the magnitude of 2020 -2022's
secular bull market, we discussed the prospect for this (2nd-Wave corrective)
recovery to be "extensive" in terms of both price and time. A
"more extensive" correction is typified by a retracement of 61.8% or
more and spanning weeks or even months following a 3-month decline. Per
such, the (suspected corrective) recovery from 26-Sep's 2.1877 low could easily
have further to go, with commensurately larger-degree weakness than that
exhibited this week (i.e., a failure below at least 2.4822) required
to consider the correction complete. Indeed, the daily log chart above
shows the market thus far respecting former 2.6185-area resistance from 10-Oct
as a new support candidate.
These
issues considered, very shorter-term traders have been advised to move to a neutral/sideline
position following overnight's momentum failure below 2.6328, with a recovery
above 2.8172 required to negate this call, reaffirm the recovery and re-expose
potentially significant gains thereafter. For intermediate- and
longer-term players, a bullish policy and exposure remain advised with a
failure below 2.4822 required to threaten this call enough to warrant
neutralizing exposure. We will be watchful for another bearish divergence
in momentum following a recovery attempt that falls short of Fri's 2.8172 high
that would be considered the next reinforcing factor to a count calling that
2.8172 high the prospective end to the month-and-a-half 2nd-Wave
correction. In lieu of such, a resumption of the current rally to
eventual new highs above 2.8172 should not surprise.
Economy - Futures Market Outlook w/John Caruso - 06/09/2021
Futures Market Outlook w/John Caruso - 06/09/2021
By: John Caruso, Senior Market StrategistPosted Jun 9, 2021 12:26PM CT
John Caruso gives a rundown of the market action today and we are seeing some movement up. Crude Oil is also nearing oversold levels and we will continue to monitor that
**Please note this video is commentary for June 9th, the date stated at the beginning of the video is wrong** If you have any questions or would like to discuss the markets further, please feel free to contact me at 800-669-5354 or jcaruso@rjofutures.com.