Profits and Losses: How they both impact on you mentally;
How experienced traders shift their mental approach to overcome their trading obstacles;
How to protect your emotional capital;
The 7 steps to achieving a better trading psychology.
4th of July: Freedom From Commissions
Receive free commissions when you open and fund an account in the month of July! This is one firecracker you don’t want to miss!
The Markets
Metals - Gold Poised to Move Higher
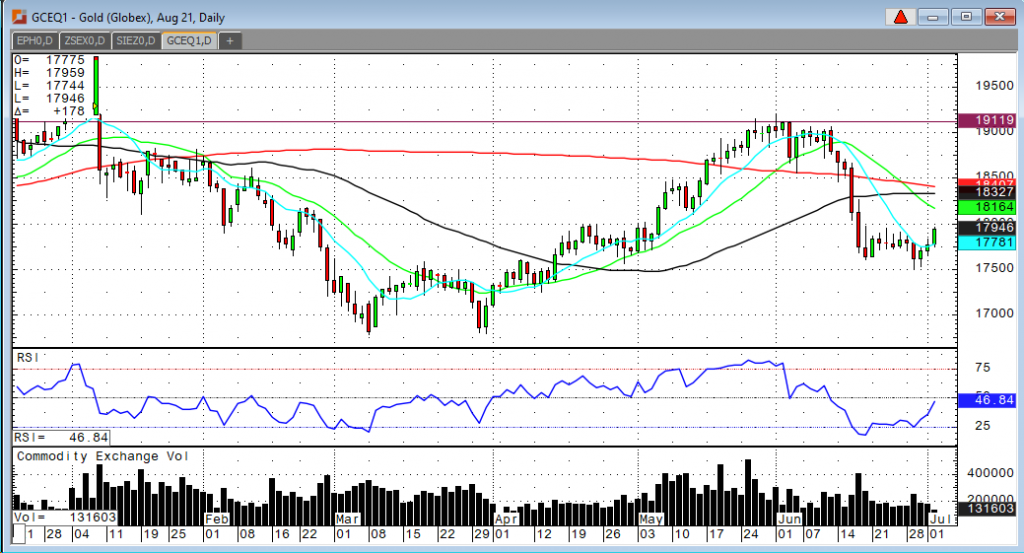
Gold Poised to Move Higher
By: Frank J. Cholly, Senior Market StrategistPosted Jul 2, 2021 8:39AM CT
Gold has been range bound between $1,750 to just under
$1,800 for the past two weeks since the Fed induced sell off. A breakout with a
close over $1,800 will quickly take the trade to $1,850. The $1,750 swing low
should hold. I don’t expect that $1,750 is even likely to be retested. In fact,
I think the next trading range that I will be discussing is $1,850 to $1,900.
Gold likes these fifty-dollar ranges and they are very tradable while they
last. I also expect that the next run back to $1,900 will be another breakout
run towards $2,000! The 50 DMA and the 200 DMA are about to cross. If I’m right
and the 50 DMA crosses above the 200 DMA that will be a “Golden Cross”, a very
bullish signal. Plus inflation with wage inflation will be the next reason why
you might want to own gold.
Platinum in the $1,050 range is a good long-term value. A breakout above $1,100 is needed to confirm a bottom is in, but if gold rallies then platinum will follow.
Gold Aug '21 Daily Chart If you have any questions or would like to discuss the markets further, please feel free to contact me at 800-826-4124 or fcholly@rjofutures.com. Metals - Silver Could Hit $30
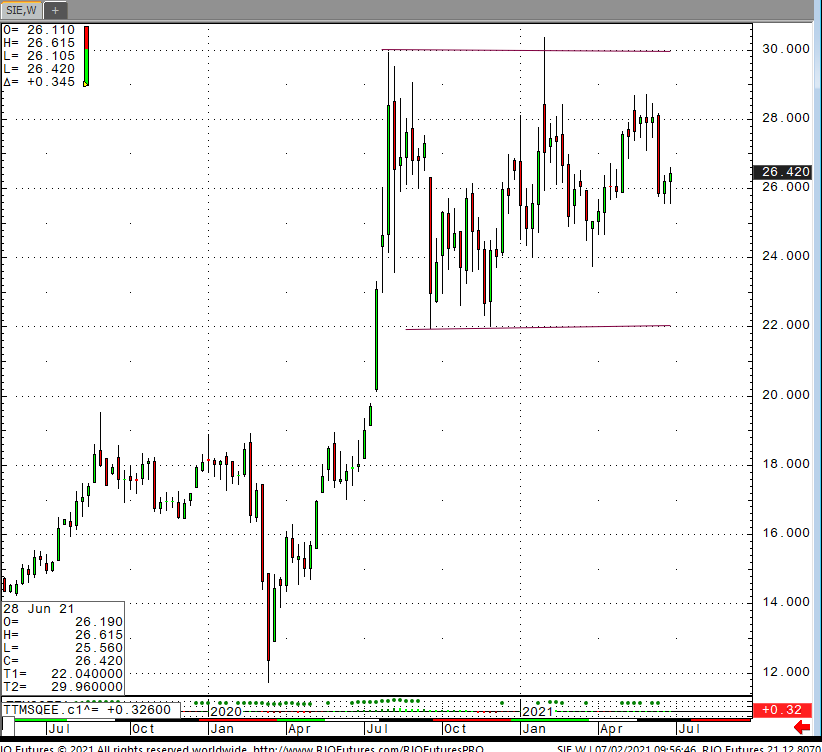
Silver is currently trading at $26.49. The US and global markets continue to recover stead pace. However, with the rise in commodity prices and signs of inflation, silver bears would likely be put on the defensive. The weekly chart below shows range-bound price action. In my view, you will see silver above $30 before you see it below $20. Another interesting fact is that the dollar has been relatively strong, yet silver has not given much ground to the downside. In my view, any pullback will be bought rather than sold. I’m not sure if the market is convinced of the dollar strength, I'll add more notes about that later.
Silver Weekly Chart If you have any questions or would like to discuss the markets further, please feel free to contact me at 800-367-7290 or etesfaye@rjofutures.com. Energy - Oil Over $75 a Barrel
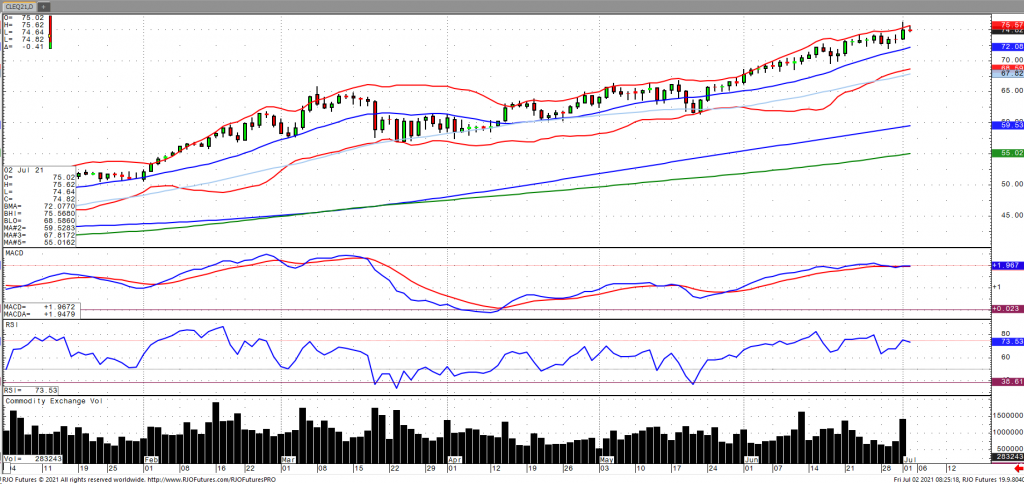
Oil prices have continued their inflation higher climbing above 75$ a barrel for the first time since October 2018 amid reports that OPEC+ will increase production by approximately 400k barrels between August and December as the trajectory of global demand prospects continue to accelerate. Notwithstanding, the UAE is expected to make a different proposal amid concerns of an Iranian oil production ramp concurrent with other OPEC+ members with the meeting scheduled to continue today. US stockpiles fell for the sixth consecutive week, to their lowest level since March 20 with an 81-million-barrel deficit from year ago levels, according to the EIA. The market continues to remain bullish trend with today’s range seen between 71.65 – 75.66.
Crude Oil Aug '21 Daily Chart If you have any questions or would like to discuss the markets further, please feel free to contact me at 800-438-4805 or aturro@rjofutures.com. Softs - Have Cocoa Futures Found a Bottom?
Have Cocoa Futures Found a Bottom?
By: Peter MoosesPosted 07/02/2021
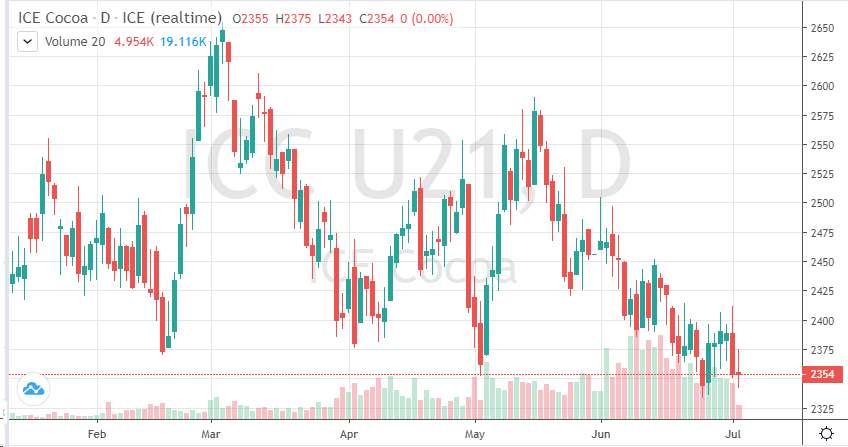
As technical selling continues, cocoa futures continue to
move lower. It appears traders are beginning to lose patience with waiting on
the demand for cocoa to increase. The year is halfway through, covid
restrictions are still in place in many key areas of the world for cocoa demand
and the Pound continues to add to the market weakness. At this point, the
fundamentals - weather, supply, etc have taken a backseat to the macro story.
If the weather patterns in West Africa continue, which are
positive for supply numbers, we could see cocoa prices test 2300. The trend on
chart is bearish, a change in COT, and a positive change in supply and demand
is needed to reverse this. If 2300 is tested with no change in global demand,
the remainder of cocoa trading year could end much lower than many expected.
At this point, traders are anticipating a recovery in cocoa prices although the short-term is not promising. Still consider buying further out calls in the December contract for upside exposure in hopes that the world continues to recover.
On
the heels of mid-Sep-to-early-Oct's steeper, accelerated, 3rd-wave-looking
recovery, the past week-and-a-half's boringly lateral chop is first considered
a corrective/consolidative event that warns of a continuation of the uptrend
that preceded it to new highs above 04-Oct's 891.0 high. This count
remains consistent with our broader base/correction/recovery count introduced
in 13-Sep's Technical Blog following that
day's bullish divergence in short-term momentum above 07-Sep's 809.5 minor
corrective high detailed in the hourly chart below.
The
important takeaway from this month's lateral, sleepy price action is the
definition of Wed's 851.5 low as
the end or lower boundary of a suspected 4th-Wave correction. A failure
below 851.5 will confirm a bearish divergence in daily momentum and defer or
threaten a bullish count enough to warrant non-bullish decisions like
long-covers. A failure below 851.5 will not
necessarily negate a broader bullish count, but it will threaten it enough to
warrant defensive measures as the next pertinent technical levels below 851.5 are
13-Sep's prospective minor 1st-Wave high at 813.8 and obviously 08-Sep's 766.0
low. And making non-bullish decisions "down there" is
sub-optimal to say the least. Per such, both short- and longer-term
commercial traders are advised to pare or neutralize bullish exposure on a
failure below 851.5, acknowledging and accepting whipsaw risk- back above 04-Oct's
891.0 high- in exchange for much deeper and sub-optimal nominal risk below
766.0.
On
a broader scale, the daily log scale chart above shows the developing potential
for a bearish divergence in daily momentum that will be considered confirmed
below 851.5. This chart also shows the past month's recovery thus far
stalling in the immediate neighborhood of the (888.0) Fibonacci
minimum 38.2% retrace of Apr-Sep's entire 1128 - 766 decline). COMBINED
with a failure below 851.5, traders
would then need to be concerned with at least a larger-degree correction pf the
past month's rally and possibly a resumption of Apr-Sep's major downtrend.
Until
and unless the market fails below 851.5 however, we would
remind longer-term players of the key elements on which our bullish count is
predicated:
a confirmed bullish divergence in WEEKLY momentum
(below)
amidst
an
historically low 11% reading in out RJO Bullish Sentiment Index and
a
textbook complete and major 5-wave Elliott sequence down from 29-Apr's
1128 high to 08-Sep's 766.0 low.
Thus
far, the market is only a month into correcting a 4-MONTH, 32% drawdown, so
further and possibly protracted gains remain well within the bounds of a major
(suspected 2nd-Wave) correction of Apr-Sep's decline within an even more
massive PEAK/reversal process from 17-May's 1219 high on an active continuation
basis below.
These
issues considered, a bullish policy and exposure remain advised with a failure
below 851.5 required to defer or threaten this call enough to warrant moving to
a neutral/sideline position. In lieu of such weakness, we anticipate a
continuation of the past month's rally to new highs and potentially significant
gains above 891.0.
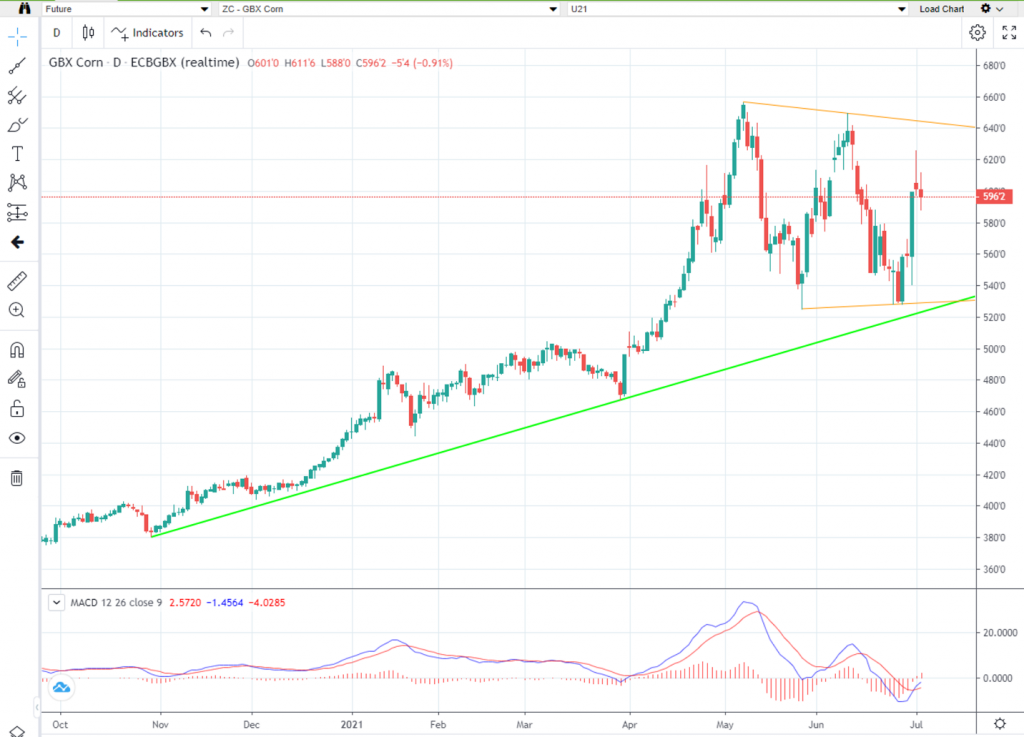
In last week’s update I advised there could be a buying opportunity in corn down near the trend (see chart below). The technical picture held up nicely until we saw the much-awaited Crop Report on Wednesday. The strong technical setup coupled with an unexpected decrease in corn acres forced the shorts to cover and new buyers appeared to come into the market in droves. Corn locked limit up 40 cents and Nov 21 Soybeans closed 86 cents higher. This week, Sept corn went from a low of $5.28 to a high of $6.26 basically a $1 move. Looking at the chart pattern, the market appears to be in a consolidation pattern “coiling up” and getting ready for its next move. If the weather continues to stay dry and HOT all I can say is look out, this is not a market I would want to be short. With a weaker US dollar, tight stocks, lower planted acres, strong demand (look at year over year Chinese corn imports, up over 425%, unconfirmed sources suggest China’s corn production is way off), drought like conditions in most parts of the Midwest, freeze/frost problems in parts of South America – I see the perfect “ingredient’s” for corn and soybeans to continue higher.
With these market conditions, you may want to look at an options strategy as a possibility. I have 25 years of market experience, please feel free to call me at 1-800-367-7290 for more details or to discuss in depth strategies. Also be sure to check out my past weekly grain market updates posted on our website.
Corn Sep '21 Daily Chart If you have any questions or would like to discuss the markets further, please feel free to contact me at 800-367-7290 or msabo@rjofutures.com. Equity - Stock Futures Hit New High on Jobs Report
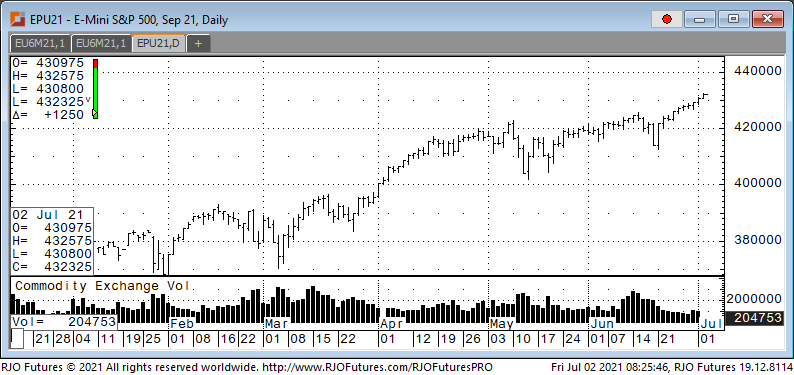
Stocks rallied on the open this morning after
the June job data showed an accelerating recovery for the U.S. labor
market. According to the Bureau of Labor
Statistics, the economy added 850,000 jobs last month. Economist estimated and
addition of 706,000. This topped the
559,000 that were created in May.
However, the unemployment number came in a little higher than expected
at 5.9%. According to James McCann, an
economist ant Aberdeen Standard Investments.
“This is a strong report and should be taken
as a sign of things to come for an accelerating labor market. Today’s data
won’t change the Fed’s view. An acceleration in the labor market like the one
signaled in this report is exactly what they were anticipating,” McCann added.
“The pick-up in hiring should tell the central bank that firms are having more
success finding workers, which will ease concerns about a more protracted
period of increasing wages. What will happen now is that investors will really
focus in on when the Fed is likely to announce a tapering of its asset
purchases.”
Support today is showing 429000 and 427800 with resistance being 432100 and 433000.
E-mini S&P 500 Sep '21 Daily Chart If you have any questions or would like to discuss the markets further, please feel free to contact me at 888-861-1656 or jyasak@rjofutures.com. Economy - S-T Mo Failure Insufficient to End RBOB Correction, But Beware
S-T Mo Failure Insufficient to End RBOB Correction, But Beware
By: RJO Market InsightsPosted 11/08/2022
Posted on Nov 08, 2022, 07:51 by Dave Toth
In Fri's Technical Webcast we identified a
minor corrective low at 2.6328 from Thur as a mini risk parameter the market
needed to sustain gains above to maintain a more immediate bullish count.
The 240-min chart below shows the market's failure overnight below this level,
confirming a bearish divergence in very short-term momentum. This mo
failure defines Fri's 2.8172 high as
one of developing importance and a parameter from which very short-term traders
can objectively base non-bullish decisions like long-covers.
Given
the magnitude of the past three weeks' broader recovery however, this
short-term momentum failure is of an insufficient scale to conclude anything
more than another correction within this broader recovery from 26-Sep's 2.1877
low. Indeed, overnights failure below 2.6328 only allows us to conclude
the end of the portion of the month-and-a-half rally from 31-Oct's 2.4822 next
larger-degree corrective low. 2.4822 is the
risk parameter this market still needs to fail below to break the uptrend from
18-Oct's 2.3526 low while this 2.3526 low
remains intact as the risk parameter this market needs to fail below to break
the month-and-a-half uptrend. From an
intermediate-to-longer-term perspective, this week's setback falls well within
the bounds of another correction ahead of further gains. This is another
excellent example of the importance of technical and trading SCALE and
understanding and matching directional risk exposure to one's personal risk
profile.
The
reason overnight's admittedly minor mo failure might have longer-term
importance is the 2.8172-area from which it stemmed. In
Fri's Technical Blog we also noted the market's engagement of the
2.8076-to-2.8159-area marked by the 61.8% retrace of Jun0-Sewp's 3.2758 -2.1877
decline and the 1.000 progression of Sep-Oct's initial 2.1877 - 2.6185
(suspected a-Wave) rally from 18-Oct's 2.3526 (suspected b-Wave) low. We
remind longer-term players that because of the unique and compelling confluence
of:
early-Aug's bearish divergence in WEEKLY momentum
amidst
historically
extreme bullish sentiment/contrary opinion levels in our RJO Bullish
Sentiment Index
an
arguably complete and massive 5-wave Elliott sequence from Mar'20's 0.4605
low to Jun's 4.3260 high (as labeled in the weekly log active-continuation
chart below) and
the
5-wave impulsive sub-division of Jun-Sep's (suspected initial 1st-Wave) decline
The
recovery attempt from 26-Sep's 2.1877 low is arguably only a 3-wave (Wave-2)
corrective rebuttal to Jun-Sep's decline within a massive, multi-quarter
PEAK/reversal process. Now granted, due to the magnitude of 2020 -2022's
secular bull market, we discussed the prospect for this (2nd-Wave corrective)
recovery to be "extensive" in terms of both price and time. A
"more extensive" correction is typified by a retracement of 61.8% or
more and spanning weeks or even months following a 3-month decline. Per
such, the (suspected corrective) recovery from 26-Sep's 2.1877 low could easily
have further to go, with commensurately larger-degree weakness than that
exhibited this week (i.e., a failure below at least 2.4822) required
to consider the correction complete. Indeed, the daily log chart above
shows the market thus far respecting former 2.6185-area resistance from 10-Oct
as a new support candidate.
These
issues considered, very shorter-term traders have been advised to move to a neutral/sideline
position following overnight's momentum failure below 2.6328, with a recovery
above 2.8172 required to negate this call, reaffirm the recovery and re-expose
potentially significant gains thereafter. For intermediate- and
longer-term players, a bullish policy and exposure remain advised with a
failure below 2.4822 required to threaten this call enough to warrant
neutralizing exposure. We will be watchful for another bearish divergence
in momentum following a recovery attempt that falls short of Fri's 2.8172 high
that would be considered the next reinforcing factor to a count calling that
2.8172 high the prospective end to the month-and-a-half 2nd-Wave
correction. In lieu of such, a resumption of the current rally to
eventual new highs above 2.8172 should not surprise.
We were expecting to here from OPEC yesterday, with regards to their decision on increasing Oil production. From what I’m hearing that decision has been delayed until today, and I’m not quite sure when exactly we’re expected to hear back. Expectations for a 500K bbl increase in production by members is the benchmark, and I’ve read they may come in just under at 400K bbl. Typically the July 4th weekend is considered “peak demand” season, but this year is certainly the exception for that we think. Oil, for the first time in a while, signaled immediate OB in our model coming into the session, and Oil bears (if there’s any left) got some respite with an approx. 1.50 pullback from the highs that reached above 76.00 early yesterday. Oil, no longer signaling OB today. We remain cautiously bullish here within our range model, and expect to see some back and fill in coming weeks.
On to the June Non-Farm Labor Report: An increase of 700K increase in jobs in June is the benchmark forecast vs 559K prior. 5.7% unemployment rate which is expected down from 5.8%. We ran through 3 possible scenarios yesterday, and now it’s game day. We’ll know when we know.
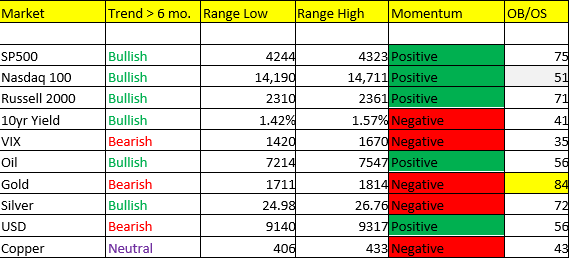
Yields are ticking down ahead of the number and Stocks remain firm. Our IVOL signals for stocks still suggest the market is NOWHERE near complacent, which means the upside can continue. We’ve seen in recent weeks a net SHORT position in the US Small Cap Index (Russell 2000), and more squeeze could be on deck for the bears. The USD continues to sense a taper is coming from the Fed, and the ECB went dovish on monetary policy back in mid-June which is also contributing to the squeeze for the USD bears. I’m watching this very closely for possible entry points on the short side for the USD, but also acknowledging that Scenario 4 (a bullish scenario for the dollar) is a probable outcome for this oncoming quarter.
T-minus 10 minutes to the number, I’m going to keep it right
here for now.
If we don’t speak again today, I hope you all enjoy your long holiday weekend, and stay safe out there. God bless the USA!
If you have any questions or would like to discuss the markets further, please feel free to contact me at 800-669-5354 or jcaruso@rjofutures.com.