What you should know about trading these instruments
Using the Gap trade strategy to build consistency
New Special Report: Inflation, How Much is Too Much?
With so much money in the market, coupled with weakened supply chains and workforces due to the fallout of Covid-19, we are seeing a rampant run on inflation. Prices from everything to lumber, oil, and groceries are up. Learn why this is happening, how long it will go on for, and how to protect yourself with this Special Report!
The Markets
Metals - Gold is Looking Good
Gold is Looking Good
By: Frank J. Cholly, Senior Market StrategistPosted Jul 15, 2021 8:48AM CT
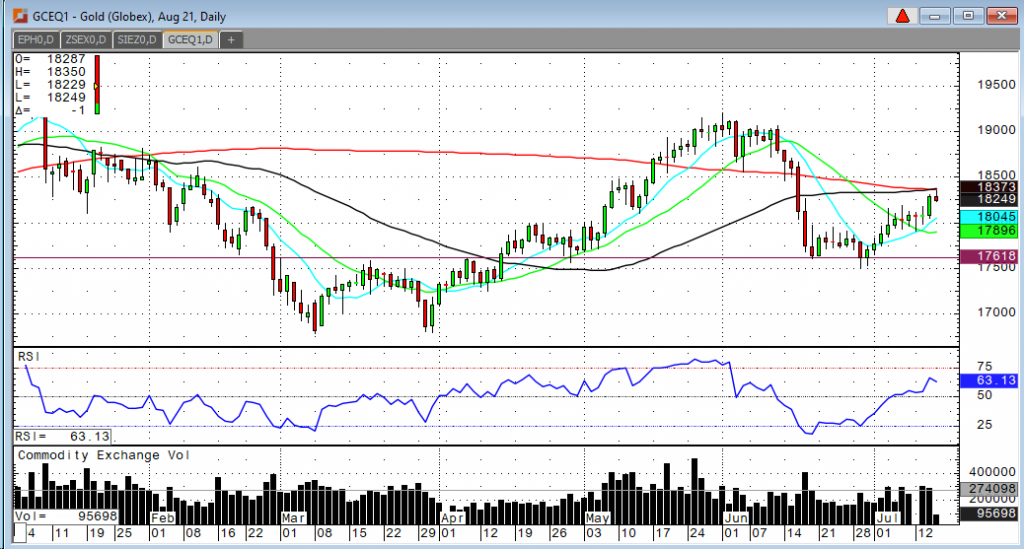
I think it’s now safe to say that gold has bottomed and is set to breakout to the upside. Yesterday’s close above $1,820 should encourage gold bulls to get more aggressive. Two things we need to see to confirm a secondary rally would be a pop through $1,838. That is the next resistance level and where the 50 DMA and the 200 DMA converge. A move above $1,838 will begin to drag that 50 DMA above the 200 DMA. Once that happens, you’ll hear all the talking heads pointing out the “golden cross” in gold. Hopefully Jay Powell’s testimony doesn’t mush this setup. He is at least acknowledging that inflation is moving faster than they expected. Just look at this week’s CPI and PPI. Inflation is heating up and Washington wants to pour more gasoline on the fire. Runaway inflation is unavoidable in my opinion unless we plunge into some unforeseen financial crisis. Inflation will be what takes gold back above $2,000.
Gold Aug '21 Daily Chart If you have any questions or would like to discuss the markets further, please feel free to contact me at 800-826-4124 or fcholly@rjofutures.com. Energy - Oil Prices Recovering Off Supply Increase
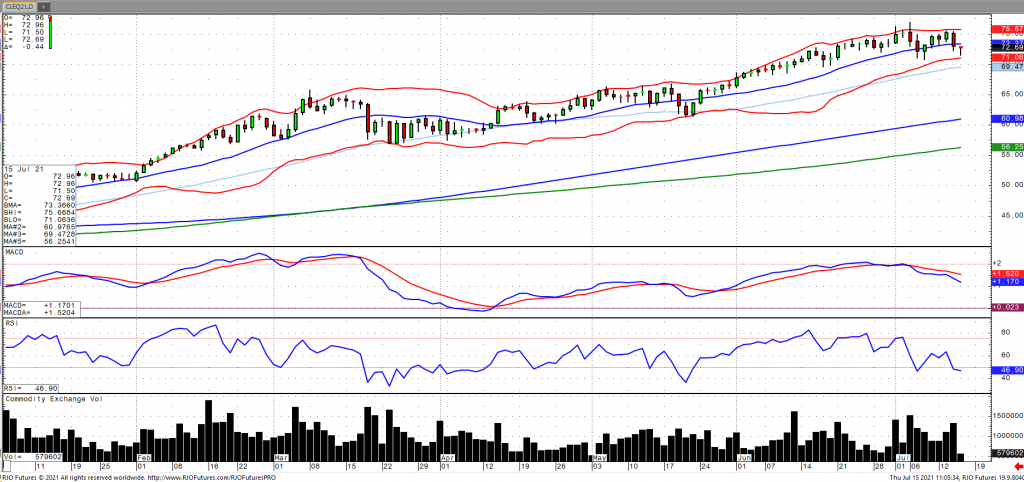
Oil prices have extended their sell off early Thursday but are coming off their low as the market assess the prospect of an increase in supply as OPEC+ agreed to a comprise coupled with an unexpected increase in fuel stocks. Weekly inventories saw its largest decline in oil stocks in months with its eighth consecutive draw of -7.896 million barrels and gasoline stocks building +1.1.038 million barrels despite a drop in refinery utilization, according to the EIA. Notwithstanding the prospect of more supply, demand growth should continue to outpace with China reporting record processing in June. Oil volatility (OVX) continues to remain relatively subdued with the market remaining bullish trend with today’s range seen between 71.64 – 72. 35.
Crude Oil Aug '21 Daily Chart If you have any questions or would like to discuss the markets further, please feel free to contact me at 800-438-4805 or aturro@rjofutures.com. Softs - Demand for Cocoa on The Rise
Demand for Cocoa on The Rise
By: Peter MoosesPosted 07/15/2021
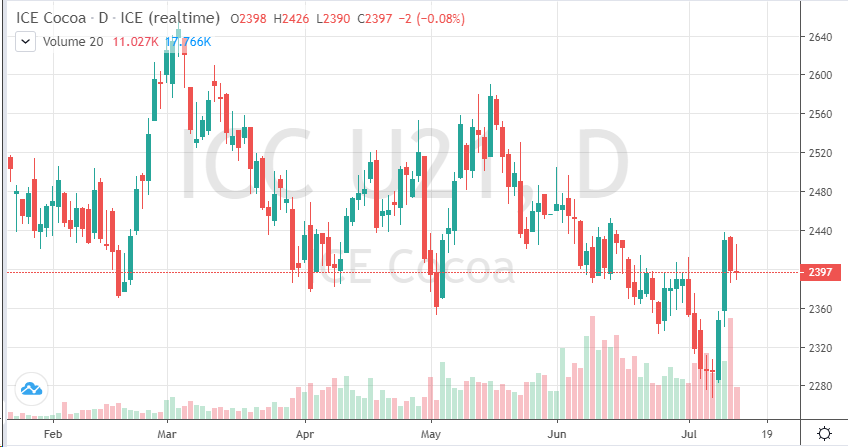
Grinding data came in better than expected for cocoa. As traders waited for the data to be released, we saw new lows put in the September Cocoa contract. European grinding data came in much higher than last year’s numbers causing a two-day rally in the market. Since the release, we have seen pullback, most likely profit taking. The world continues to slowly reopen but as that happens, Covid cases appear to be on the rise in pockets. This uncertainly and constantly changing data is one of the main reasons for market volatility. Technically, the recent rebound has created new support. If the market can trade and hold above 2400, look for more buyers to be attracted back into the market. If clients want exposure for the chance that the market recovery holds, look at further out call options. The demand will eventually return, but the question is when and what will have to take place for investors to believe in the longer-term positive outlook.
On
the heels of mid-Sep-to-early-Oct's steeper, accelerated, 3rd-wave-looking
recovery, the past week-and-a-half's boringly lateral chop is first considered
a corrective/consolidative event that warns of a continuation of the uptrend
that preceded it to new highs above 04-Oct's 891.0 high. This count
remains consistent with our broader base/correction/recovery count introduced
in 13-Sep's Technical Blog following that
day's bullish divergence in short-term momentum above 07-Sep's 809.5 minor
corrective high detailed in the hourly chart below.
The
important takeaway from this month's lateral, sleepy price action is the
definition of Wed's 851.5 low as
the end or lower boundary of a suspected 4th-Wave correction. A failure
below 851.5 will confirm a bearish divergence in daily momentum and defer or
threaten a bullish count enough to warrant non-bullish decisions like
long-covers. A failure below 851.5 will not
necessarily negate a broader bullish count, but it will threaten it enough to
warrant defensive measures as the next pertinent technical levels below 851.5 are
13-Sep's prospective minor 1st-Wave high at 813.8 and obviously 08-Sep's 766.0
low. And making non-bullish decisions "down there" is
sub-optimal to say the least. Per such, both short- and longer-term
commercial traders are advised to pare or neutralize bullish exposure on a
failure below 851.5, acknowledging and accepting whipsaw risk- back above 04-Oct's
891.0 high- in exchange for much deeper and sub-optimal nominal risk below
766.0.
On
a broader scale, the daily log scale chart above shows the developing potential
for a bearish divergence in daily momentum that will be considered confirmed
below 851.5. This chart also shows the past month's recovery thus far
stalling in the immediate neighborhood of the (888.0) Fibonacci
minimum 38.2% retrace of Apr-Sep's entire 1128 - 766 decline). COMBINED
with a failure below 851.5, traders
would then need to be concerned with at least a larger-degree correction pf the
past month's rally and possibly a resumption of Apr-Sep's major downtrend.
Until
and unless the market fails below 851.5 however, we would
remind longer-term players of the key elements on which our bullish count is
predicated:
a confirmed bullish divergence in WEEKLY momentum
(below)
amidst
an
historically low 11% reading in out RJO Bullish Sentiment Index and
a
textbook complete and major 5-wave Elliott sequence down from 29-Apr's
1128 high to 08-Sep's 766.0 low.
Thus
far, the market is only a month into correcting a 4-MONTH, 32% drawdown, so
further and possibly protracted gains remain well within the bounds of a major
(suspected 2nd-Wave) correction of Apr-Sep's decline within an even more
massive PEAK/reversal process from 17-May's 1219 high on an active continuation
basis below.
These
issues considered, a bullish policy and exposure remain advised with a failure
below 851.5 required to defer or threaten this call enough to warrant moving to
a neutral/sideline position. In lieu of such weakness, we anticipate a
continuation of the past month's rally to new highs and potentially significant
gains above 891.0.
In
today’s Grain Market Insight, I am going to focus solely on the corn market. If
you would like to discuss any of the other grain markets or receive detailed
insight on them, feel free to reach out to me by email or phone. The hot and
dry mid-west weather has continued to be of concern and should be to an extent.
While we have seen the good to excellent crop rating slip over the last several
weeks, we have also seen some rain in several areas just in time to help
alleviate additional stress. Now that we are moving through the crucial
pollination stage with just enough rainfall in some areas and not overly hot temperatures,
we need to look at how much weather premium could come out of the market and I
see signs that the market may be ready to just that. Historically, looking back
at the market even in big up years like 96, 08, 11 and 12, the market has a strong
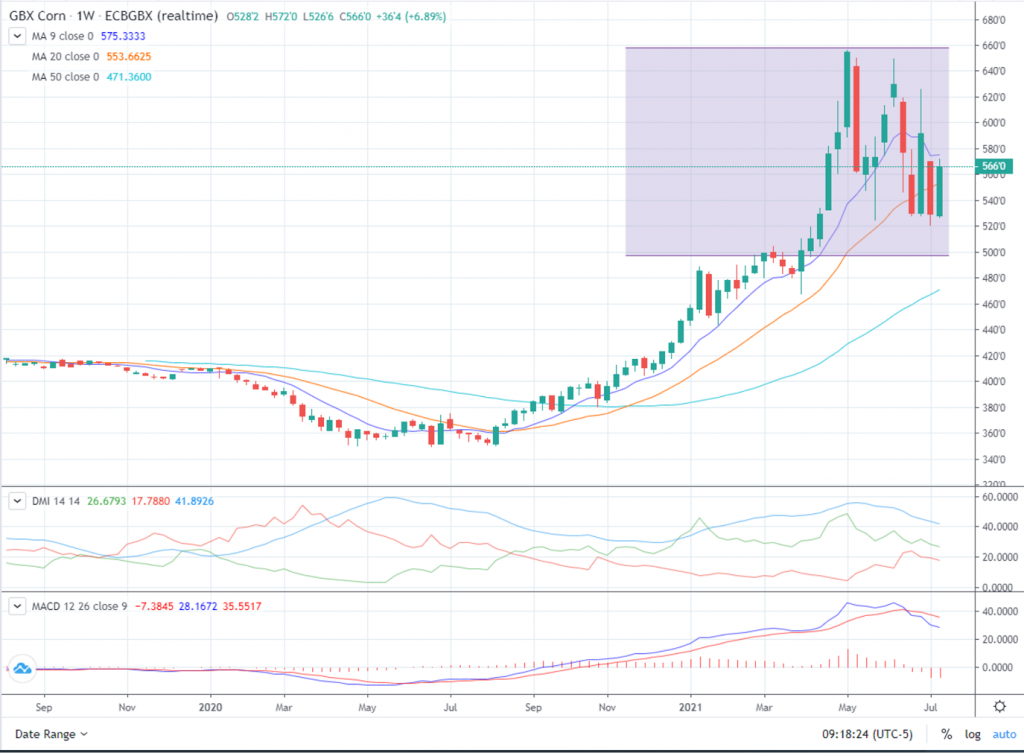
tendency to seasonally move lower around this time. When we look at the corn monthly
chart, we can see market consolidation over the last 3 months. Although the monthly
trading ranges for May, June and July have been quite large the market really
hasn’t gone anywhere. There are several minor support and resistance levels
inside the range but I see the major breakout areas above $6.58 and below $4.97
(see shaded area on the weekly chart below).
I would suggest using an option strategy to manage your futures position risk or an outright option strategy. Implied option volatility is still relatively high compared to historical vol levels. You may want to incorporate some short options into your strategy in a calculated risk manner such as bull or bear option spreads. I have 25 years of grain market experience, please feel free to call me at 1-800-367-7290 for more details or to discuss in depth trading strategies. Also be sure to check out my past weekly grain market updates posted on our website.
Corn Sep '21 Daily Chart If you have any questions or would like to discuss the markets further, please feel free to contact me at 800-367-7290 or msabo@rjofutures.com. Agricultural - Live Cattle Mixed
Live Cattle Mixed
By: Peter McGinnPosted 07/15/2021
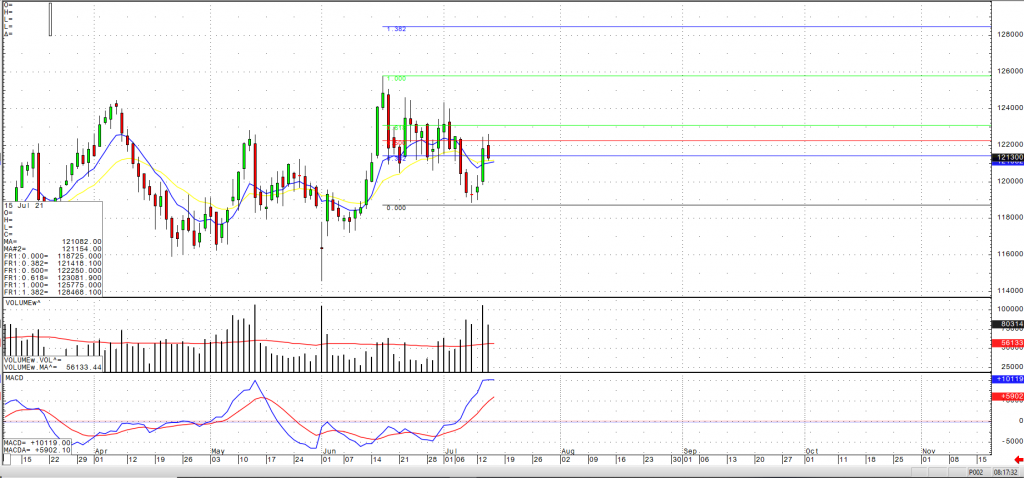
August cattle had a little bit of profit taking yesterday as the market closed at 121.25. This is a 38% retracement from the June 16th highs and the lows made on July 9th. Currently the Aug cattle contract is trading at a slight premium over cash, but the volume traded on the cash market this week so far has been extremely light giving the futures market any sort of guidance or indicator. Cash live cattle prices drifted lower on Wednesday, but the picture is mixed. In Nebraska 3,262 head traded at 117-120 at 123, down from an average price of 124.60 on Tuesday and 123.87 last week. Prices in other areas were lower. However, the 5-day, 5-area weighted average price as of Wednesday was 122.44, up from 121.33 a week ago. Slaughter weights are relatively light so it will be interesting to see if they stay at current levels or start to increase as we get into late summer. The USDA estimated cattle slaughter came in at 119,000 head yesterday. This brings the total for the week so far to 360,000 head, up from 247,000 last week and 350,000 a year ago. The USDA boxed beef cutout was up $2.45 at mid-session yesterday and closed 46 cents lower at $272.88. This was down from $284.90 the previous week and was the lowest the cutout had been since April 13.
Live Cattle Aug '21 Daily ChartEquity - Stock Futures Lower Ahead of Powell Testimony
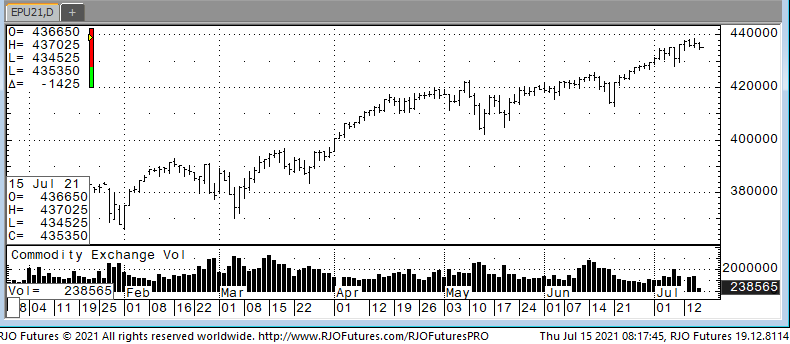
U.S. stock futures are trading lower today before commentary from Jerome Powell, the Federal Reserve Chief, on the state of the economy and monetary policy. The major indexes are trading near all-time highs as e-traders see the economy rebounding and better than expected earnings from the corporate sector. However, some analysts are warning that stocks will struggle in the coming months because of the new increase in Covid-19 infections and the impact of global re-openings. U.S. jobless claims released today checked in at 360,000 a drop of 26,000. This is the lowest number since the pandemic started and a great indicator that the economy and job markets are quickly rebounding. The impressive jobs number also saw the 10-year treasury yield drop to 1.32%.
Support today is 435000 and 433500 with resistance checking in at 438500 and 440500.
E-mini S&P 500 Sep '21 Daily Chart If you have any questions or would like to discuss the markets further, please feel free to contact me at 888-861-1656 or jyasak@rjofutures.com. Economy - S-T Mo Failure Insufficient to End RBOB Correction, But Beware
S-T Mo Failure Insufficient to End RBOB Correction, But Beware
By: RJO Market InsightsPosted 11/08/2022
Posted on Nov 08, 2022, 07:51 by Dave Toth
In Fri's Technical Webcast we identified a
minor corrective low at 2.6328 from Thur as a mini risk parameter the market
needed to sustain gains above to maintain a more immediate bullish count.
The 240-min chart below shows the market's failure overnight below this level,
confirming a bearish divergence in very short-term momentum. This mo
failure defines Fri's 2.8172 high as
one of developing importance and a parameter from which very short-term traders
can objectively base non-bullish decisions like long-covers.
Given
the magnitude of the past three weeks' broader recovery however, this
short-term momentum failure is of an insufficient scale to conclude anything
more than another correction within this broader recovery from 26-Sep's 2.1877
low. Indeed, overnights failure below 2.6328 only allows us to conclude
the end of the portion of the month-and-a-half rally from 31-Oct's 2.4822 next
larger-degree corrective low. 2.4822 is the
risk parameter this market still needs to fail below to break the uptrend from
18-Oct's 2.3526 low while this 2.3526 low
remains intact as the risk parameter this market needs to fail below to break
the month-and-a-half uptrend. From an
intermediate-to-longer-term perspective, this week's setback falls well within
the bounds of another correction ahead of further gains. This is another
excellent example of the importance of technical and trading SCALE and
understanding and matching directional risk exposure to one's personal risk
profile.
The
reason overnight's admittedly minor mo failure might have longer-term
importance is the 2.8172-area from which it stemmed. In
Fri's Technical Blog we also noted the market's engagement of the
2.8076-to-2.8159-area marked by the 61.8% retrace of Jun0-Sewp's 3.2758 -2.1877
decline and the 1.000 progression of Sep-Oct's initial 2.1877 - 2.6185
(suspected a-Wave) rally from 18-Oct's 2.3526 (suspected b-Wave) low. We
remind longer-term players that because of the unique and compelling confluence
of:
early-Aug's bearish divergence in WEEKLY momentum
amidst
historically
extreme bullish sentiment/contrary opinion levels in our RJO Bullish
Sentiment Index
an
arguably complete and massive 5-wave Elliott sequence from Mar'20's 0.4605
low to Jun's 4.3260 high (as labeled in the weekly log active-continuation
chart below) and
the
5-wave impulsive sub-division of Jun-Sep's (suspected initial 1st-Wave) decline
The
recovery attempt from 26-Sep's 2.1877 low is arguably only a 3-wave (Wave-2)
corrective rebuttal to Jun-Sep's decline within a massive, multi-quarter
PEAK/reversal process. Now granted, due to the magnitude of 2020 -2022's
secular bull market, we discussed the prospect for this (2nd-Wave corrective)
recovery to be "extensive" in terms of both price and time. A
"more extensive" correction is typified by a retracement of 61.8% or
more and spanning weeks or even months following a 3-month decline. Per
such, the (suspected corrective) recovery from 26-Sep's 2.1877 low could easily
have further to go, with commensurately larger-degree weakness than that
exhibited this week (i.e., a failure below at least 2.4822) required
to consider the correction complete. Indeed, the daily log chart above
shows the market thus far respecting former 2.6185-area resistance from 10-Oct
as a new support candidate.
These
issues considered, very shorter-term traders have been advised to move to a neutral/sideline
position following overnight's momentum failure below 2.6328, with a recovery
above 2.8172 required to negate this call, reaffirm the recovery and re-expose
potentially significant gains thereafter. For intermediate- and
longer-term players, a bullish policy and exposure remain advised with a
failure below 2.4822 required to threaten this call enough to warrant
neutralizing exposure. We will be watchful for another bearish divergence
in momentum following a recovery attempt that falls short of Fri's 2.8172 high
that would be considered the next reinforcing factor to a count calling that
2.8172 high the prospective end to the month-and-a-half 2nd-Wave
correction. In lieu of such, a resumption of the current rally to
eventual new highs above 2.8172 should not surprise.
Economy - Futures Market Outlook w/John Caruso - 07/15/2021
Back to back heated inflation numbers over the past two day’s shouldn’t come as a surprise to any of us – June US Producer Prices +7.3% y/y and +1.0 m/m vs +6.6% and +0.8% previously in May. We also heard some dovish remarks made by Fed Chairman yesterday to Congress, attempting to quell any fears of a taper tantrum. Powell suggested that the labor market was not in a position yet to warrant immediate Fed action on a taper. Inflation has risen above the Fed’s expectations, but likely is “transitory” and yada, yada, yada. Today is day 2 of Powell’s testimony to members of Congress.
-Oil took a > 3.00% hit yesterday on OPEC reaching an agreement on production increases….furthermore, headlines this morning suggest that the US may be soon looking to lift sanctions on Iran, likely taking the first steps towards redrafting the Iran Nuclear Deal that was disposed of during the previous administration. Oil down another -1.55% overnight.
-US Initial Claims just hit the tape and fell 26K w/w
to 360K – our view on labor trends remains positive and will likely continue to
ramp up over the next few consecutive months. Rising wages in the monthly
data we believe will be a key focus of the market in the next several labor
reports, and also a contributing factor to the “sticky” inflation view.
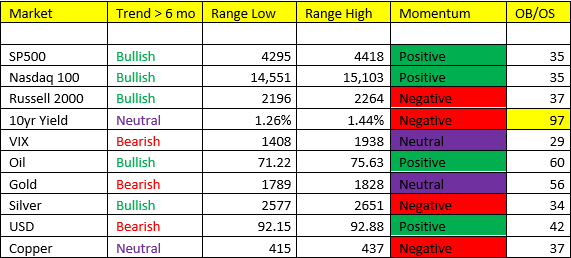
-Small Caps took a lick yesterday, -1.6%, extending losses from Tuesday. The Russell 2000 is the only major index carrying negative momentum, and is now triggering immediate OS.
Currencies- the USD tracking higher this morning, after another failed breakout attempt. We’ve mentioned the prospects for a period of upcoming Dollar strength, and further weakness in the Euro. The ECB meets next week, and will likely double down on their dovish pivot from June – pledging more aggressive PEPP (Euro QE).
Metals- tightening ranges in the metals = falling volatility. We own a small position and gold and are interested in grossing that up over coming weeks – silver too. However, gold is now beginning to give me “more positive” signals than Silver in terms of momentum changes. We’ll bring you more in coming days.
The game is getting harder, we’ve recognized this change in market dynamics over the past few months – and still believe we’re in a transition phase. Pay attention.
If you have any questions or would like to discuss the markets further, please feel free to contact me at 800-669-5354 or jcaruso@rjofutures.com.