New Special Report: Inflation, How Much is Too Much?
With so much money in the market, coupled with weakened supply chains and workforces due to the fallout of Covid-19, we are seeing a rampant run on inflation. Prices from everything to lumber, oil, and groceries are up. Learn why this is happening, how long it will go on for, and how to protect yourself with this Special Report!
The Markets
Metals - Gold is Still Contained
Gold is Still Contained
By: Frank J. Cholly, Senior Market StrategistPosted Jul 30, 2021 8:58AM CT
After a 2-dayt $41.70 rally in December gold, the market still seems to be contained. The 200 DMA and 50 DMA converge right around $1,832 and that level seems to be keeping a lid on gold’s rally. Remember though, that a breakout above that $1,835 range would encourage the bulls to get more aggressive in adding new longs. First support comes in at $1,825 with stronger support at $1,810. A close under $1,800 would be a big negative. A close above $1,840 would be bullish.
The gold market seems to embrace the dovish Fed more than
the prospects of runaway inflation, but the fact that gold has been unable to
breakout above $1,835 has me scratching my head. I don’t get it, but the market
isn’t always logical. I still remain bullish and believe that gold still has a
big move higher coming. The market cannot go sideways forever!
If you have any questions or would like to discuss the markets further, please feel free to contact me at 800-826-4124 or fcholly@rjofutures.com. Metals - Silver is Stair Stepping Higher
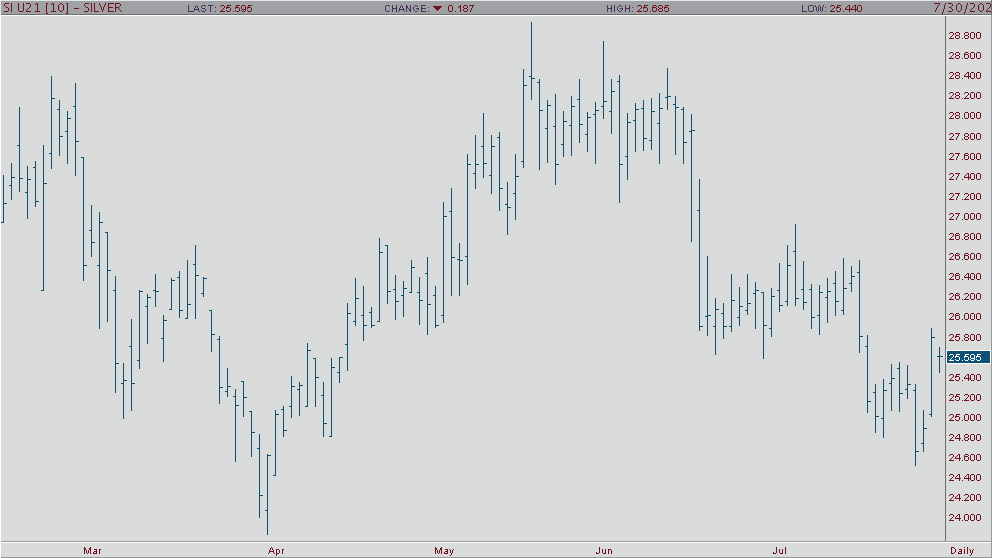
The silver market is stair-stepping higher primarily due to strength in other physical commodity markets and resilient equity markets. The trend is your friend. Also, the dollar has been weaker in recent sessions. In my view, any pullback, should be looked at as an opportunity to buy rather than sell. The problem with the bull market is that it needs a fresh set of news to keeps going. The more I see it; we will be looking at sideway markets for a while, tilting to the upside. If you want to discuss a trading opportunity for either hedging or speculating, reach out to me.
Silver Aug '21 Daily Chart If you have any questions or would like to discuss the markets further, please feel free to contact me at 800-367-7290 or etesfaye@rjofutures.com. Energy - Oil Higher on Tighter Supply
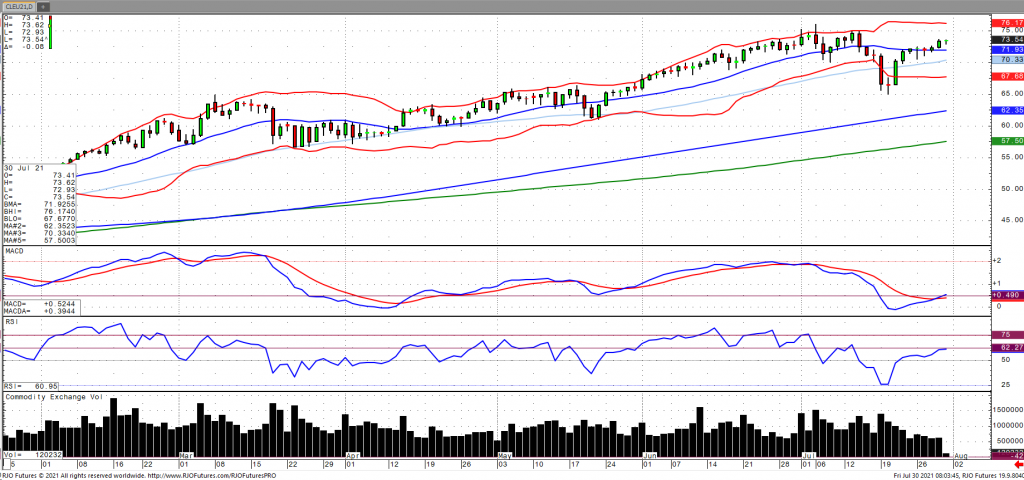
Oil prices rose on Thursday amid a weaker US Dollar as well as carryover from a bullish inventory report with EIA data showing crude stocks declined -4.089 million barrels for the ninth time in the last ten weeks. Production fell 200k bpd for the first time in five weeks with imports falling -590k bpd which was coupled with the lowest inventory reading since January 2020, a further indication of tightening supply. Despite the dampening demand outlook regarding the uncertainty surrounding the delta variant, demand should continue to outpace supply even as OPEC+ is set to bring another 400k barrels back online next month, which is only further evidenced by reports earlier in the week that Indian June oil imports rose 16% from year ago levels. Once more, oil volatility (ovx) has come off trend resistance and continues to break down into the low 30s with the market remaining bullish trend with today’s range seen between 68.07 – 75.83.
Oil Sep '21 Daily Chart If you have any questions or would like to discuss the markets further, please feel free to contact me at 800-438-4805 or aturro@rjofutures.com. Softs - Sugar Reinstates Secular Bull, Defines New Risk Levels
Sugar Reinstates Secular Bull, Defines New Risk Levels
By: RJO Market InsightsPosted 07/27/2021
For
the past 2-1/2-months the market has generally wafted laterally, presenting a
correction-vs-reversal debate and challenge. With Yesterday's recovery
above 06-Jun's 18.43 high and our key risk parameter, the market has confirmed
the price action dating back to 12-May's 18.25 high as a corrective/consolidative
event and reinstated the secular bull trend from 28Apr20's 9.21 low. The
important by-products of this resumed strength are the market's definition of
smaller- and larger-degree corrective lows at 17.77 and 16.73 that it
is fully expected to sustain gains above to maintain a more immediate bullish
count. Per such, these levels serve as our new short- and longer-term
risk parameters from which traders can objectively base and manage the risk of
a resumed bullish policy and exposure commensurate with their personal risk
profiles.
Two-and-a-half months of former 18.50-to-17.90-area resistance, since broken, is expected to hold as new near-term support ahead of further and possibly extended gains.
On
a broader scale, since the secular bull trend has resumed, previous
peak/reversal-threat elements like waning upside momentum, historically frothy
bullish sentiment and a potentially complete Elliott sequence are relegated to
the back burner and will not be considered applicable to another peak/reversal
threat until and unless the market proves weakness below at least 17.77 and
especially 16.73. Indeed, the monthly log chart below shows NO levels of any
technical merit above the market shy of Sep'16's 24.10 high. In effect,
there is no resistance. This does not mean however that we're forecasting
a more to the 24-area. But it certainly does mean that until and unless
the market fails below the recent corrective lows and risk parameters we've identified,
the market's upside potential is indeterminable and potentially extreme,
including a run at 24 and higher.
These issues considered, traders are advised to return to a bullish policy and re-establish at least cautious bullish exposure at-the-market (18.59) with a failure below 17.77 required to threaten this call enough to warrant its cover. In lieu of such weakness, further and possibly accelerated gains straight away should not surprise.
On
the heels of mid-Sep-to-early-Oct's steeper, accelerated, 3rd-wave-looking
recovery, the past week-and-a-half's boringly lateral chop is first considered
a corrective/consolidative event that warns of a continuation of the uptrend
that preceded it to new highs above 04-Oct's 891.0 high. This count
remains consistent with our broader base/correction/recovery count introduced
in 13-Sep's Technical Blog following that
day's bullish divergence in short-term momentum above 07-Sep's 809.5 minor
corrective high detailed in the hourly chart below.
The
important takeaway from this month's lateral, sleepy price action is the
definition of Wed's 851.5 low as
the end or lower boundary of a suspected 4th-Wave correction. A failure
below 851.5 will confirm a bearish divergence in daily momentum and defer or
threaten a bullish count enough to warrant non-bullish decisions like
long-covers. A failure below 851.5 will not
necessarily negate a broader bullish count, but it will threaten it enough to
warrant defensive measures as the next pertinent technical levels below 851.5 are
13-Sep's prospective minor 1st-Wave high at 813.8 and obviously 08-Sep's 766.0
low. And making non-bullish decisions "down there" is
sub-optimal to say the least. Per such, both short- and longer-term
commercial traders are advised to pare or neutralize bullish exposure on a
failure below 851.5, acknowledging and accepting whipsaw risk- back above 04-Oct's
891.0 high- in exchange for much deeper and sub-optimal nominal risk below
766.0.
On
a broader scale, the daily log scale chart above shows the developing potential
for a bearish divergence in daily momentum that will be considered confirmed
below 851.5. This chart also shows the past month's recovery thus far
stalling in the immediate neighborhood of the (888.0) Fibonacci
minimum 38.2% retrace of Apr-Sep's entire 1128 - 766 decline). COMBINED
with a failure below 851.5, traders
would then need to be concerned with at least a larger-degree correction pf the
past month's rally and possibly a resumption of Apr-Sep's major downtrend.
Until
and unless the market fails below 851.5 however, we would
remind longer-term players of the key elements on which our bullish count is
predicated:
a confirmed bullish divergence in WEEKLY momentum
(below)
amidst
an
historically low 11% reading in out RJO Bullish Sentiment Index and
a
textbook complete and major 5-wave Elliott sequence down from 29-Apr's
1128 high to 08-Sep's 766.0 low.
Thus
far, the market is only a month into correcting a 4-MONTH, 32% drawdown, so
further and possibly protracted gains remain well within the bounds of a major
(suspected 2nd-Wave) correction of Apr-Sep's decline within an even more
massive PEAK/reversal process from 17-May's 1219 high on an active continuation
basis below.
These
issues considered, a bullish policy and exposure remain advised with a failure
below 851.5 required to defer or threaten this call enough to warrant moving to
a neutral/sideline position. In lieu of such weakness, we anticipate a
continuation of the past month's rally to new highs and potentially significant
gains above 891.0.
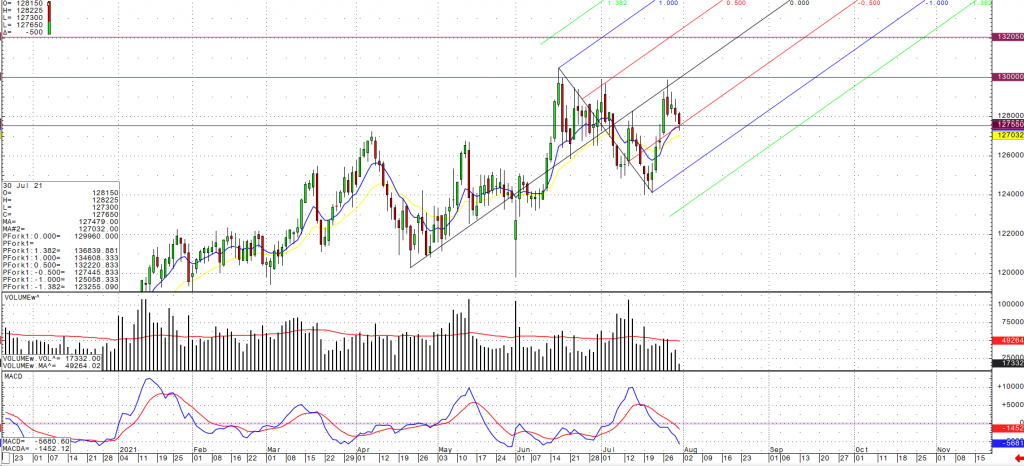
Agricultural - Cattle Appears Overbought
Cattle Appears Overbought
By: Peter McGinnPosted 07/30/2021
With the recent moves in the October cattle market, it looks
to be in a bit of overbought territory. Recent news from China is that they are
still expanding their beef imports from the US which should lend some support
to the market but that remains to be seen. Other supporting factors right now
though are the declining supply combined with some strength in consumer demand,
currently Oct cattle is trading at 127.5 which is on a near term support level.
Cash business seems to be improving with heavier volume traded this week and
higher trending prices. 130 looks to be the upside resistance level, if a
breakout happens, we need to see a close above that level next week in my
opinion.
Some of the fundamental news in accordance with export numbers and cash prices are as follows: The largest buyer this week in the weekly export sales report was South Korea at 8,222 tonnes, followed by Japan at 6,085 and China at 4,488. South Korea has the most commitments for 2021 at 212,700 tonnes, followed by Japan at 185,600 and China at 119,000. Last year, China had booked 15,000 tonnes by this time of the year and just 4,100 tonnes for this time of year 2 years ago. Cash live cattle traded in heavier volume on Thursday at higher prices than last week. In Kansas 8,410 head traded at 118-123.50 with an average price of 120.13, up from an average of 119 last week. In Nebraska 1,965 head traded at 122-123 with an average of 122.13, up from 121.67 last week. In Texas/Oklahoma 3,784 head traded at 120, up from 118.77 last week. The USDA boxed beef cutout closed $2.06 higher at $275.22. This was up from $266.14 the previous week and was the highest the cutout had been since July 9.
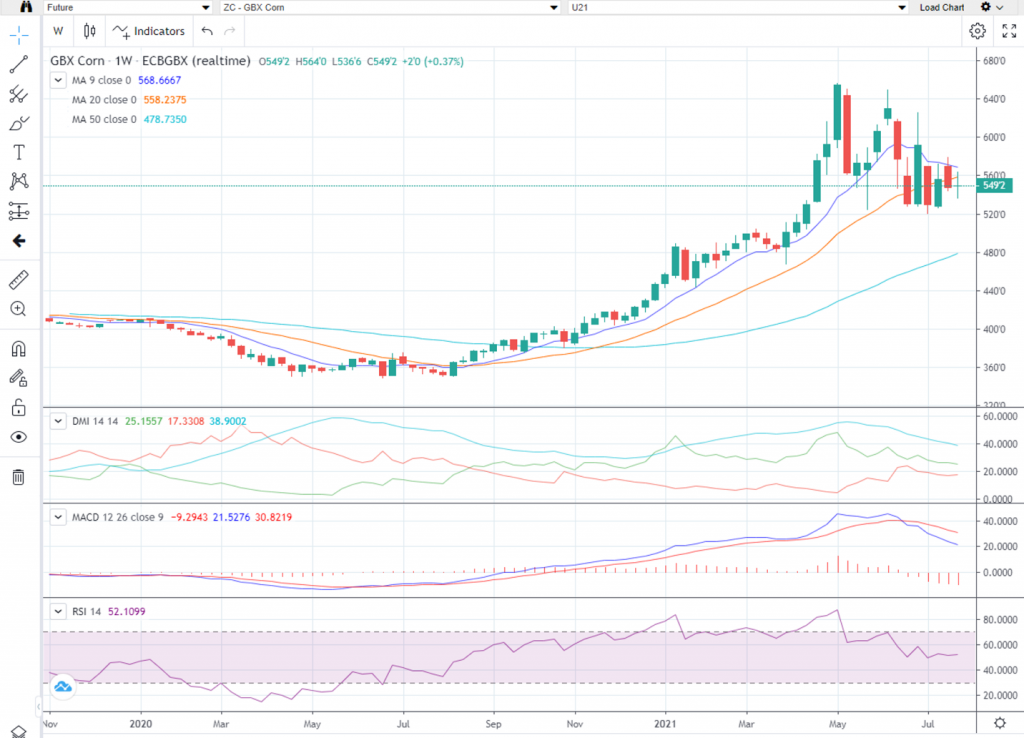
Live Cattle Oct '21 Daily ChartAgricultural - Grains - Consolidation Continues 2.0
Over
the last week, corn and soybeans have continued to consolidate while KC wheat
had an outside week although at the time of this writing KC is trading inside
last week’s range. Looking at the weekly September corn chart below, one can clearly
see the degree of consolidation. In last week’s Grains Insight, I advised
traders to watch for changes in Mondays Crop Condition Report. That report
showed a drop in the good to excellent category from 65 to 64 which spurred a rally
to the weekly high achieved on Tuesday of $5.64. At the time of writing Sept corn
is trading at $5.48 which is about the middle of the weekly range. Based on the
chart patterns I believe the numbers to watch are $5.25 on the downside and
$5.80 on the upside – watch for a breakout and position accordingly. This week,
the range for corn has been even smaller coming in at .27 ¼ cents. As I mentioned last week, historically we usually
see corn sell off around this time of year but so far that hasn’t been the
case. Watch for Mondays Crop Condition
Report to see if the Good/Excellent rating for corn slips again or stays
unchanged. August 12th is the next USDA Supply/Demand Report and
Crop Production, traders should pay close attention to the yield number which
in my opinion should be revised lower form 179.5 – that’s a tall order to fill
in my opinion with all the problems we have seen this growing season.
I would suggest using an option strategy to manage your futures position risk or an outright option strategy. Implied option volatility is still relatively high compared to historical vol levels. You may want to incorporate some short options into your strategy in a calculated risk manner such as bull or bear option spreads. I have 25 years of grain market experience, please feel free to call me at 1-800-367-7290 for more details or to discuss in depth trading strategies. Also be sure to check out my past weekly grain market updates posted on our website.
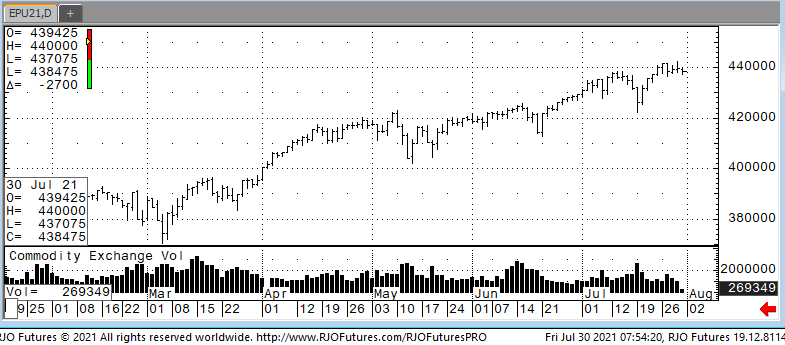
Corn Sep '21 Daily Chart If you have any questions or would like to discuss the markets further, please feel free to contact me at 800-367-7290 or msabo@rjofutures.com. Equity - Stock Futures Down on Open
U.S. stock indexes
were trading lower today as inflation data was released along with some
earnings of high-profile companies. The (PCE) personal consumption expenditures
in June showed the price of goods and services rising 0.4% in June, slower than
the may number of 0.5% and lower than the expected number of 0.6%. The PCE is an inflation measure that the Fed
watches very closely. The second month in a row of decelerated price growth gives
them some room to pull back from their emergency market support. Amazon released earnings this morning with
revenues topping $100 billion for the third straight quarter, but it missed
analysts estimates for the first time in three years. Chevron, Exxon and Caterpillar showed profits
from cost cuttings during the pandemic.
Support today is 438500 and 436000 with resistance showing 443000 and 444500.
E-mini S&P 500 Sep'21 Daily Chart If you have any questions or would like to discuss the markets further, please feel free to contact me at 888-861-1656 or jyasak@rjofutures.com. Economy - S-T Mo Failure Insufficient to End RBOB Correction, But Beware
S-T Mo Failure Insufficient to End RBOB Correction, But Beware
By: RJO Market InsightsPosted 11/08/2022
Posted on Nov 08, 2022, 07:51 by Dave Toth
In Fri's Technical Webcast we identified a
minor corrective low at 2.6328 from Thur as a mini risk parameter the market
needed to sustain gains above to maintain a more immediate bullish count.
The 240-min chart below shows the market's failure overnight below this level,
confirming a bearish divergence in very short-term momentum. This mo
failure defines Fri's 2.8172 high as
one of developing importance and a parameter from which very short-term traders
can objectively base non-bullish decisions like long-covers.
Given
the magnitude of the past three weeks' broader recovery however, this
short-term momentum failure is of an insufficient scale to conclude anything
more than another correction within this broader recovery from 26-Sep's 2.1877
low. Indeed, overnights failure below 2.6328 only allows us to conclude
the end of the portion of the month-and-a-half rally from 31-Oct's 2.4822 next
larger-degree corrective low. 2.4822 is the
risk parameter this market still needs to fail below to break the uptrend from
18-Oct's 2.3526 low while this 2.3526 low
remains intact as the risk parameter this market needs to fail below to break
the month-and-a-half uptrend. From an
intermediate-to-longer-term perspective, this week's setback falls well within
the bounds of another correction ahead of further gains. This is another
excellent example of the importance of technical and trading SCALE and
understanding and matching directional risk exposure to one's personal risk
profile.
The
reason overnight's admittedly minor mo failure might have longer-term
importance is the 2.8172-area from which it stemmed. In
Fri's Technical Blog we also noted the market's engagement of the
2.8076-to-2.8159-area marked by the 61.8% retrace of Jun0-Sewp's 3.2758 -2.1877
decline and the 1.000 progression of Sep-Oct's initial 2.1877 - 2.6185
(suspected a-Wave) rally from 18-Oct's 2.3526 (suspected b-Wave) low. We
remind longer-term players that because of the unique and compelling confluence
of:
early-Aug's bearish divergence in WEEKLY momentum
amidst
historically
extreme bullish sentiment/contrary opinion levels in our RJO Bullish
Sentiment Index
an
arguably complete and massive 5-wave Elliott sequence from Mar'20's 0.4605
low to Jun's 4.3260 high (as labeled in the weekly log active-continuation
chart below) and
the
5-wave impulsive sub-division of Jun-Sep's (suspected initial 1st-Wave) decline
The
recovery attempt from 26-Sep's 2.1877 low is arguably only a 3-wave (Wave-2)
corrective rebuttal to Jun-Sep's decline within a massive, multi-quarter
PEAK/reversal process. Now granted, due to the magnitude of 2020 -2022's
secular bull market, we discussed the prospect for this (2nd-Wave corrective)
recovery to be "extensive" in terms of both price and time. A
"more extensive" correction is typified by a retracement of 61.8% or
more and spanning weeks or even months following a 3-month decline. Per
such, the (suspected corrective) recovery from 26-Sep's 2.1877 low could easily
have further to go, with commensurately larger-degree weakness than that
exhibited this week (i.e., a failure below at least 2.4822) required
to consider the correction complete. Indeed, the daily log chart above
shows the market thus far respecting former 2.6185-area resistance from 10-Oct
as a new support candidate.
These
issues considered, very shorter-term traders have been advised to move to a neutral/sideline
position following overnight's momentum failure below 2.6328, with a recovery
above 2.8172 required to negate this call, reaffirm the recovery and re-expose
potentially significant gains thereafter. For intermediate- and
longer-term players, a bullish policy and exposure remain advised with a
failure below 2.4822 required to threaten this call enough to warrant
neutralizing exposure. We will be watchful for another bearish divergence
in momentum following a recovery attempt that falls short of Fri's 2.8172 high
that would be considered the next reinforcing factor to a count calling that
2.8172 high the prospective end to the month-and-a-half 2nd-Wave
correction. In lieu of such, a resumption of the current rally to
eventual new highs above 2.8172 should not surprise.
By: John Caruso, Senior Market StrategistPosted Jul 28, 2021 3:30PM CT
John Caruso reacts to the latest Fed announcement including some dovish sounding comments by Jerome Powell concerning economic tapering. If you have any questions or would like to discuss the markets further, please feel free to contact me at 800-669-5354 or jcaruso@rjofutures.com.