How technical analysis differs from trading strategy
Why is price action so important
How to implement a trading strategy
4th of July: Freedom From Commissions
Receive free commissions when you open and fund an account through the month of August! This is one firecracker you don’t want to miss!
The Markets
Metals - Gold to Retest Swing Low
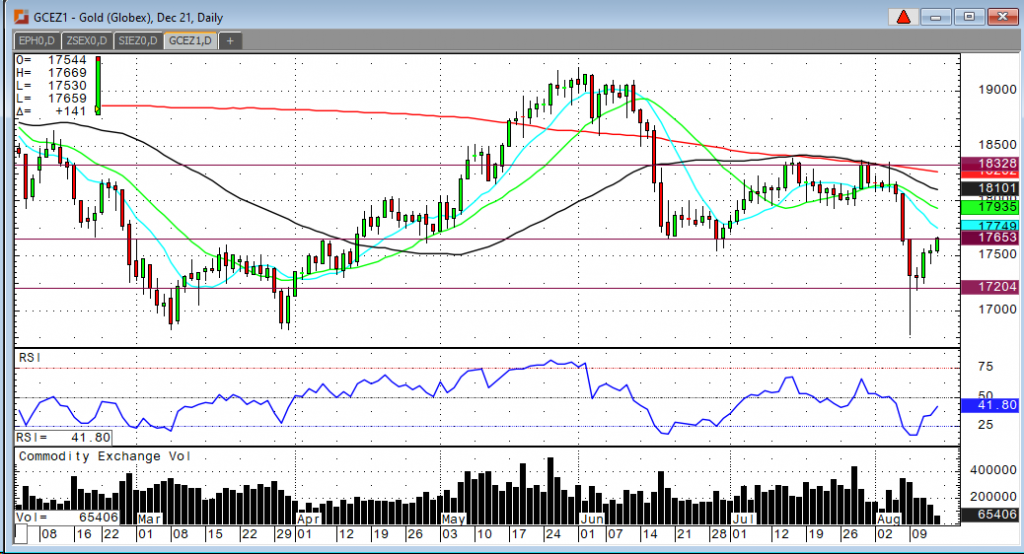
Gold to Retest Swing Low
By: Frank J. Cholly, Senior Market StrategistPosted Aug 13, 2021 8:55AM CT
With the sharpness and degree of Monday’s follow through
selloff from last week’s seventy-five-dollar correction we can say the market
was extremely over sold and that this bounce was in order. However, one could
also say that a retest of Monday’s low is a likely scenario and that this
recovery bounce is another opportunity to sell gold. Keep an eye on the US
Dollar. The Dollar has been capped by good resistance at .9320 recently. If the
Dollar breaks out above .9320, gold will slide back to $1,700 pretty easily.
Also, keep in mind that the gold market was spooked by talk of tapering and we
continue to see inflationary data that should prompt gold traders to pressure
the market down again.
As I like to point out, “it’s usually just a level on the chart, that turns the market around.” Having said that, I see $1,765 as “old support, becomes new resistance.” Just look at the daily chart below. If gold can manage a close above $1,775 that would be friendly to the gold bulls. A drop below $1,742 would indicate a continuation of the short term down trend. Below $1,720 is bearish.
Gold Dec '21 Daily Chart If you have any questions or would like to discuss the markets further, please feel free to contact me at 800-826-4124 or fcholly@rjofutures.com. Energy - Will Recent Covid-19 Outbreaks Slow Crude Oil Demand?
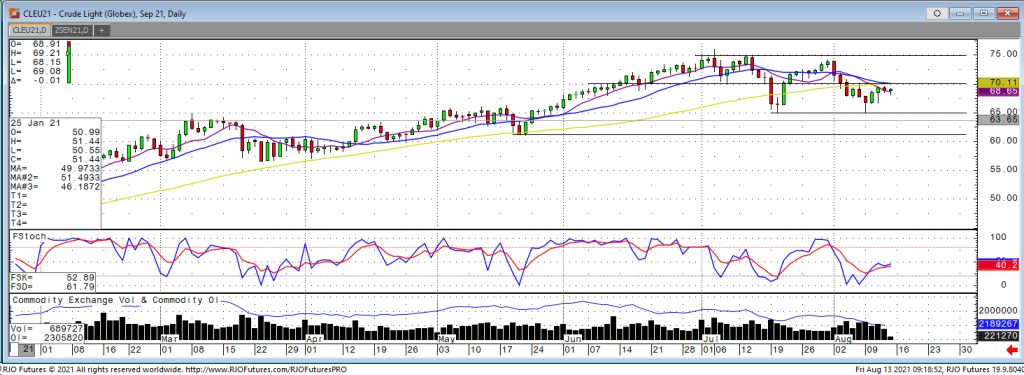
Will Recent Covid-19 Outbreaks Slow Crude Oil Demand?
On Monday crude oil continued last weeks slide lower down to $65.15 before closing up off its lows at $66.85 on the day. Mid-week we saw a recovery with a weekly high of $69.62 but at this time it looks like it will end the week on a weaker note. Pressure is being brought on by talks that OPEC will once again increase production and also that a ramp up in Covid outbreaks will slow the demand side of things. Despite these pressures we saw Sept crude bounce off support at $65 and trade back to the middle of the $65-$75 range. There are some global demand discrepancies between OPEC and the International Energy Agency which is causing the market to have some uncertainty. US production also remains lower than normal. Resistance comes in right above the $70 level and a breakthrough of that is needed to see crude oil push back to recent highs of $75. If wider global shut downs due to Covid or increased production from OPEC nations come to fruition, expect to see lower trade back down with $65 and $61 as the next downside targets.
Crude Oil Sep '21 Daily Chart If you have any questions or would like to discuss the markets further, please feel free to contact me at 800-826-2270 or therrmann@rjofutures.com. Softs - S-T Coffee Divergence Could Re-Expose Secular Bull
S-T Coffee Divergence Could Re-Expose Secular Bull
By: RJO Market InsightsPosted 08/10/2021
On the tiniest of scales, yesterday's recovery above 04-Aug's 178.65 initial counter-trend high detailed in the 240-min chart below confirms a bullish divergence in momentum. On the heels of late-Jul's relative plunge, early-Aug's piddly recovery attempt falls well within the bounds of a mere corrective hiccup ahead of a resumption of this relative plunge. Nonetheless, until or unless mitigated by a relapse below 02-Aug's 171.60 low, further corrective rebound OR the resumption of the secular bull trend are expected. Per such, this 171.60 level serves as our new short-term risk parameter from which non-bearish decisions like short-covers and cautious bullish punts can be objectively based and managed by shorter-term traders with tighter risk profiles.
The compelling thing about last week's 171.60 low and admittedly short-term risk parameter is that it comes against the backdrop of a massive, arguably accelerating secular bull trend where the relapse from 26-Jul's 215.20 high can, at this point, only be considered another correction within the secular bull. Against the backdrop of this secular bull trend, the daily log scale chart above shows the area marked by the (170.50) 61.8% retrace of Jul's 147.65 - 215.20 rally and 168.65 former resistance-turned-support as a logical support candidate. As yesterday's bullish divergence in short-term momentum rejected/defined a level (171.60) just above this pivotal area, an acute risk/reward opportunity from the bull side is presented. For IF late-Jul's exaggerated relapse/correction ended at 171.60, a resumption of the secular bull trend to new highs above 215.20 would be expected. That's quite the reward for a risk to levels just below 171.60.
From
an even longer-term perspective, the monthly log chart below shows the
magnitude of this secular bull trend. MINIMALLY, commensurately
larger-degree weakness below 06-Jul's 147.65 larger-degree
corrective low remains required to break even the portion of the bull from
Nov'20's 102.15 low, let alone threaten the 27-month secular bull
trend.
These issues considered, shorter-term traders whipsawed out of bullish exposure following 30-Jul's bearish divergence in short-term momentum are advised to return to a bullish policy and exposure from the 178.65-area OB with a failure below 171.60 required to negate this specific all and warrant its cover. Longer-term commercial players remain advised to maintain a bullish policy with a failure below 168.65 required to defer or threaten this call enough to warrant its cover. In lieu of weakness below at least 171.60 and preferably below 168.65, a resumption of the secular bull trend is anticipated.
On
the heels of mid-Sep-to-early-Oct's steeper, accelerated, 3rd-wave-looking
recovery, the past week-and-a-half's boringly lateral chop is first considered
a corrective/consolidative event that warns of a continuation of the uptrend
that preceded it to new highs above 04-Oct's 891.0 high. This count
remains consistent with our broader base/correction/recovery count introduced
in 13-Sep's Technical Blog following that
day's bullish divergence in short-term momentum above 07-Sep's 809.5 minor
corrective high detailed in the hourly chart below.
The
important takeaway from this month's lateral, sleepy price action is the
definition of Wed's 851.5 low as
the end or lower boundary of a suspected 4th-Wave correction. A failure
below 851.5 will confirm a bearish divergence in daily momentum and defer or
threaten a bullish count enough to warrant non-bullish decisions like
long-covers. A failure below 851.5 will not
necessarily negate a broader bullish count, but it will threaten it enough to
warrant defensive measures as the next pertinent technical levels below 851.5 are
13-Sep's prospective minor 1st-Wave high at 813.8 and obviously 08-Sep's 766.0
low. And making non-bullish decisions "down there" is
sub-optimal to say the least. Per such, both short- and longer-term
commercial traders are advised to pare or neutralize bullish exposure on a
failure below 851.5, acknowledging and accepting whipsaw risk- back above 04-Oct's
891.0 high- in exchange for much deeper and sub-optimal nominal risk below
766.0.
On
a broader scale, the daily log scale chart above shows the developing potential
for a bearish divergence in daily momentum that will be considered confirmed
below 851.5. This chart also shows the past month's recovery thus far
stalling in the immediate neighborhood of the (888.0) Fibonacci
minimum 38.2% retrace of Apr-Sep's entire 1128 - 766 decline). COMBINED
with a failure below 851.5, traders
would then need to be concerned with at least a larger-degree correction pf the
past month's rally and possibly a resumption of Apr-Sep's major downtrend.
Until
and unless the market fails below 851.5 however, we would
remind longer-term players of the key elements on which our bullish count is
predicated:
a confirmed bullish divergence in WEEKLY momentum
(below)
amidst
an
historically low 11% reading in out RJO Bullish Sentiment Index and
a
textbook complete and major 5-wave Elliott sequence down from 29-Apr's
1128 high to 08-Sep's 766.0 low.
Thus
far, the market is only a month into correcting a 4-MONTH, 32% drawdown, so
further and possibly protracted gains remain well within the bounds of a major
(suspected 2nd-Wave) correction of Apr-Sep's decline within an even more
massive PEAK/reversal process from 17-May's 1219 high on an active continuation
basis below.
These
issues considered, a bullish policy and exposure remain advised with a failure
below 851.5 required to defer or threaten this call enough to warrant moving to
a neutral/sideline position. In lieu of such weakness, we anticipate a
continuation of the past month's rally to new highs and potentially significant
gains above 891.0.
Agricultural - Grains - BREAKOUT!
Grains - BREAKOUT!
By: Michael Sabo, Senior Market StrategistPosted Aug 13, 2021 10:36AM CT
After
weeks of consolidation the corn market finally broke out yesterday when the
USDA released its Supply/Demand Report and Crop Production Report. Last week I advised
that the “real” would probably come from Thursday Reports, that proved to be
the case. USDA lowered its yield from 179.5 to 174.6 which was below the range
of estimates hence the strong move higher. Today’s price action has September corn
trading inside yesterday’s daily range. I would expect the market to continue
to push higher over the next week as the market carves out a new range now that
we have better insight to the yield reduction. Short-term technical indicators
have turned up suggesting it could be time to be long, couple this with the
bullish fundamental news we received yesterday, and the bulls have a lot to be
happy about. With that said, be cautious as the large trading ranges could come
back into play and easily push “weak” longs out of the market.
In
last week’s article I advised the key numbers to watch were $5.81 ½ on the upside
and $5.19 ½ on the downside. Well, yesterday the market surged through $5.81 ½.
This signifies a strong upside technical breakout in my opinion and should start
the market on a new
I would suggest using an option strategy to manage your futures position risk or an outright option strategy. Implied option volatility recently came down but is still relatively high compared to historical vol levels. You may want to incorporate some short options into your strategy in a calculated risk manner such as bull or bear option spreads. I have 25 years of grain market experience, please feel free to call me at 1-800-367-7290 for more details or to discuss in depth trading strategies. Also be sure to check out my past weekly grain market updates posted on our website.
Corn Sep '21 Daily Chart If you have any questions or would like to discuss the markets further, please feel free to contact me at 800-367-7290 or msabo@rjofutures.com. Economy - S-T Mo Failure Insufficient to End RBOB Correction, But Beware
S-T Mo Failure Insufficient to End RBOB Correction, But Beware
By: RJO Market InsightsPosted 11/08/2022
Posted on Nov 08, 2022, 07:51 by Dave Toth
In Fri's Technical Webcast we identified a
minor corrective low at 2.6328 from Thur as a mini risk parameter the market
needed to sustain gains above to maintain a more immediate bullish count.
The 240-min chart below shows the market's failure overnight below this level,
confirming a bearish divergence in very short-term momentum. This mo
failure defines Fri's 2.8172 high as
one of developing importance and a parameter from which very short-term traders
can objectively base non-bullish decisions like long-covers.
Given
the magnitude of the past three weeks' broader recovery however, this
short-term momentum failure is of an insufficient scale to conclude anything
more than another correction within this broader recovery from 26-Sep's 2.1877
low. Indeed, overnights failure below 2.6328 only allows us to conclude
the end of the portion of the month-and-a-half rally from 31-Oct's 2.4822 next
larger-degree corrective low. 2.4822 is the
risk parameter this market still needs to fail below to break the uptrend from
18-Oct's 2.3526 low while this 2.3526 low
remains intact as the risk parameter this market needs to fail below to break
the month-and-a-half uptrend. From an
intermediate-to-longer-term perspective, this week's setback falls well within
the bounds of another correction ahead of further gains. This is another
excellent example of the importance of technical and trading SCALE and
understanding and matching directional risk exposure to one's personal risk
profile.
The
reason overnight's admittedly minor mo failure might have longer-term
importance is the 2.8172-area from which it stemmed. In
Fri's Technical Blog we also noted the market's engagement of the
2.8076-to-2.8159-area marked by the 61.8% retrace of Jun0-Sewp's 3.2758 -2.1877
decline and the 1.000 progression of Sep-Oct's initial 2.1877 - 2.6185
(suspected a-Wave) rally from 18-Oct's 2.3526 (suspected b-Wave) low. We
remind longer-term players that because of the unique and compelling confluence
of:
early-Aug's bearish divergence in WEEKLY momentum
amidst
historically
extreme bullish sentiment/contrary opinion levels in our RJO Bullish
Sentiment Index
an
arguably complete and massive 5-wave Elliott sequence from Mar'20's 0.4605
low to Jun's 4.3260 high (as labeled in the weekly log active-continuation
chart below) and
the
5-wave impulsive sub-division of Jun-Sep's (suspected initial 1st-Wave) decline
The
recovery attempt from 26-Sep's 2.1877 low is arguably only a 3-wave (Wave-2)
corrective rebuttal to Jun-Sep's decline within a massive, multi-quarter
PEAK/reversal process. Now granted, due to the magnitude of 2020 -2022's
secular bull market, we discussed the prospect for this (2nd-Wave corrective)
recovery to be "extensive" in terms of both price and time. A
"more extensive" correction is typified by a retracement of 61.8% or
more and spanning weeks or even months following a 3-month decline. Per
such, the (suspected corrective) recovery from 26-Sep's 2.1877 low could easily
have further to go, with commensurately larger-degree weakness than that
exhibited this week (i.e., a failure below at least 2.4822) required
to consider the correction complete. Indeed, the daily log chart above
shows the market thus far respecting former 2.6185-area resistance from 10-Oct
as a new support candidate.
These
issues considered, very shorter-term traders have been advised to move to a neutral/sideline
position following overnight's momentum failure below 2.6328, with a recovery
above 2.8172 required to negate this call, reaffirm the recovery and re-expose
potentially significant gains thereafter. For intermediate- and
longer-term players, a bullish policy and exposure remain advised with a
failure below 2.4822 required to threaten this call enough to warrant
neutralizing exposure. We will be watchful for another bearish divergence
in momentum following a recovery attempt that falls short of Fri's 2.8172 high
that would be considered the next reinforcing factor to a count calling that
2.8172 high the prospective end to the month-and-a-half 2nd-Wave
correction. In lieu of such, a resumption of the current rally to
eventual new highs above 2.8172 should not surprise.
Economy - Post-Market Futures Outlook w/John Caruso - 08/09/2021
Post-Market Futures Outlook w/John Caruso - 08/09/2021
By: John Caruso, Senior Market StrategistPosted Aug 9, 2021 5:16PM CT
John Caruso discusses the day that was in the futures market including the big news from this weekend regarding a large selloff in the gold and silver markets. If you have any questions or would like to discuss the markets further, please feel free to contact me at 800-669-5354 or jcaruso@rjofutures.com.