New Special Report: Inflation, How Much is Too Much?
With so much money in the market, coupled with weakened supply chains and workforces due to the fallout of Covid-19, we are seeing a rampant run on inflation. Prices from everything to lumber, oil, and groceries are up. Learn why this is happening, how long it will go on for, and how to protect yourself with this Special Report!
4th of July: Freedom From Commissions
Receive free commissions when you open and fund an account through the month of August! This is one firecracker you don’t want to miss!
The Markets
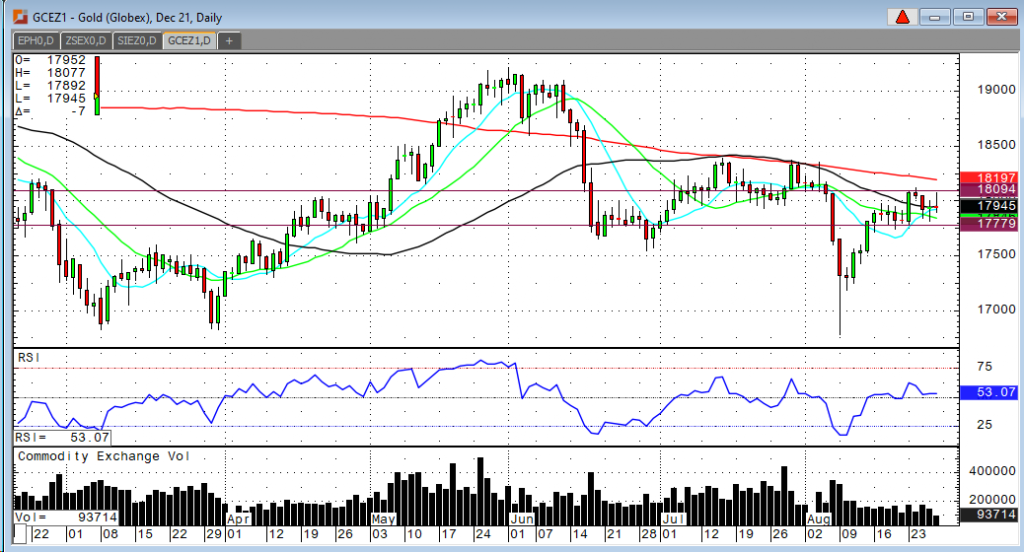
Metals - Gold Futures Marking Time
Gold Futures Marking Time
By: Frank J. Cholly, Senior Market StrategistPosted Aug 27, 2021 8:59AM CT
To taper or not to taper? When and how much? Does the rate
of inflation warrant higher rates? When are we going to stop paying people more
to stay home than to go out and work? When will the Delta variant peak? Are we
going back to lock downs? Trading gold is not like buying every dip in the
S&P. Everybody always says that “the market doesn’t like uncertainty”. Well
it seems certain that the Fed is afraid to take away the punch bowl, but at
some point, we will have to normalize rates. It would be better for the markets
if it were done slowly and incrementally as opposed to sudden and sharp hikes.
We have to keep inflation under control. If the Fed lets inflation run away, we
will have bigger problems than payer slightly higher rates. We will see how
Chairman Powell handles his speech today at the Jackson Hole Symposium. A
“virtual” Jackson Hole.
Meanwhile gold trades between $1,810 to $1,780 waiting for some clear direction.
Gold Dec '21 Daily Chart If you have any questions or would like to discuss the markets further, please feel free to contact me at 800-826-4124 or fcholly@rjofutures.com. Metals - Silver Should See Support
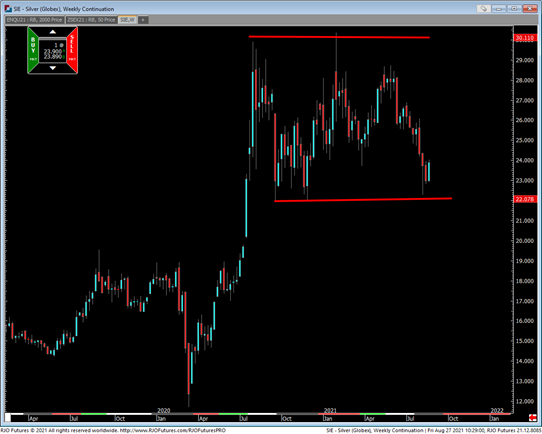
Silver Should See Support
By: Eli Tesfaye, Senior Market StrategistPosted Aug 27, 2021 10:55AM CT
The silver market is looking to set its seasonal lows sometime in the next few sessions. Currently, the silver market is trading around near $24.00 in the December contract.
The recent washout has caused the silver bulls to pull back and reassess where strong solid technical support is. The US Fed meeting at the Jackson Hole symposium underway. Sad to say, but the recent rise in the rate of new infection in the US is a genuine concern and could force the Fed hand from tightening the money supply.
From technical analysis, silver should find support here. Any absolute washout to the downside in Silver should be limited. Sideways to higher price action will prevail in the coming sessions. Reach out to me to discuss possible options strategies.
Silver Weekly Chart
If you have any questions or would like to discuss the markets further, please feel free to contact me at 800-367-7290 or etesfaye@rjofutures.com. Energy - Oil Reflates 10% Week Over Week
Oil Reflates 10% Week Over Week
By: Alex Turro, Senior Market StrategistPosted Aug 27, 2021 9:42AM CT
Oil prices are bouncing back after falling for the first time in four sessions amid renewed concerns of the impact of the delta variant on global recovery demand. Oi has reflated over 10% week over week as the USD has come off trend resistance with a strong inverse correlation developing with the USD of -0.71 on a 15-day duration. OPEC producers increased their exports during the first part of August, which was led by both Saudi Arabia and the UAE. Weekly EIA data showed inventories falling -2.98 million barrels, falling to lowest level since January 2020. Exports fell from last week to 2.812m bpd with refinery utilization up for the fourth consecutive week. Oil volitivity (OVX) has collapsed relative to last week down to the mid-30s with the market remaining bullish trend with today’s range seen between 62.11 – 70.92.
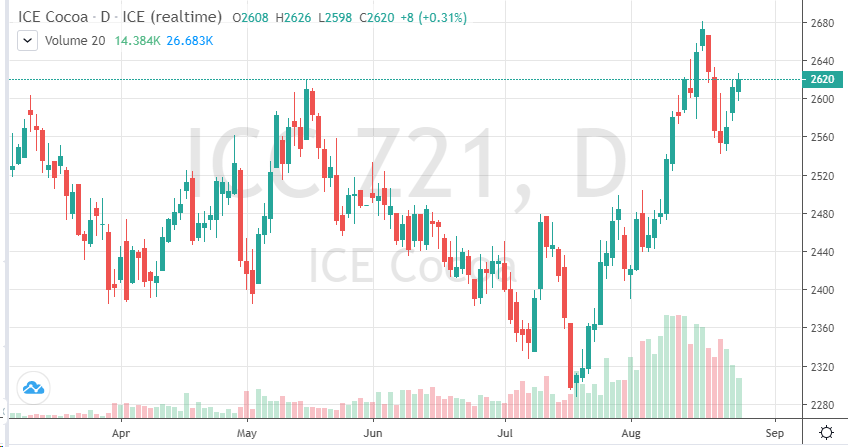
Crude Oil Oct '21 Daily Chart If you have any questions or would like to discuss the markets further, please feel free to contact me at 800-438-4805 or aturro@rjofutures.com. Softs - Cocoa Futures Above 2600, but For How Long?
Cocoa Futures Above 2600, but For How Long?
By: Peter MoosesPosted 08/27/2021
December cocoa futures continue to move higher as we head
into the weekend. The market is trading above 2600 and appears to be building
on this recent rally, but for how long? The techincals are at a key point right
now, if they can break and hold above 2635, last week’s highs are back in site.
The market is feeling overbought though. COT data will show where trader’s
minds are after the close.
The fundamentals are telling a much different story. Production numbers are high, demand is still low. If cocoa sees record production data, prices will move lower – possibly retesting 2450 again. If demand stays weak, those levels are very realistic in the short-term. With Covid-19 restrictions coming back into play, numbers surging in all parts of the world and no sign of slowing down, prices in cocoa will most likely turn lower again. Traders should look at puts in the December or March contracts.
On
the heels of mid-Sep-to-early-Oct's steeper, accelerated, 3rd-wave-looking
recovery, the past week-and-a-half's boringly lateral chop is first considered
a corrective/consolidative event that warns of a continuation of the uptrend
that preceded it to new highs above 04-Oct's 891.0 high. This count
remains consistent with our broader base/correction/recovery count introduced
in 13-Sep's Technical Blog following that
day's bullish divergence in short-term momentum above 07-Sep's 809.5 minor
corrective high detailed in the hourly chart below.
The
important takeaway from this month's lateral, sleepy price action is the
definition of Wed's 851.5 low as
the end or lower boundary of a suspected 4th-Wave correction. A failure
below 851.5 will confirm a bearish divergence in daily momentum and defer or
threaten a bullish count enough to warrant non-bullish decisions like
long-covers. A failure below 851.5 will not
necessarily negate a broader bullish count, but it will threaten it enough to
warrant defensive measures as the next pertinent technical levels below 851.5 are
13-Sep's prospective minor 1st-Wave high at 813.8 and obviously 08-Sep's 766.0
low. And making non-bullish decisions "down there" is
sub-optimal to say the least. Per such, both short- and longer-term
commercial traders are advised to pare or neutralize bullish exposure on a
failure below 851.5, acknowledging and accepting whipsaw risk- back above 04-Oct's
891.0 high- in exchange for much deeper and sub-optimal nominal risk below
766.0.
On
a broader scale, the daily log scale chart above shows the developing potential
for a bearish divergence in daily momentum that will be considered confirmed
below 851.5. This chart also shows the past month's recovery thus far
stalling in the immediate neighborhood of the (888.0) Fibonacci
minimum 38.2% retrace of Apr-Sep's entire 1128 - 766 decline). COMBINED
with a failure below 851.5, traders
would then need to be concerned with at least a larger-degree correction pf the
past month's rally and possibly a resumption of Apr-Sep's major downtrend.
Until
and unless the market fails below 851.5 however, we would
remind longer-term players of the key elements on which our bullish count is
predicated:
a confirmed bullish divergence in WEEKLY momentum
(below)
amidst
an
historically low 11% reading in out RJO Bullish Sentiment Index and
a
textbook complete and major 5-wave Elliott sequence down from 29-Apr's
1128 high to 08-Sep's 766.0 low.
Thus
far, the market is only a month into correcting a 4-MONTH, 32% drawdown, so
further and possibly protracted gains remain well within the bounds of a major
(suspected 2nd-Wave) correction of Apr-Sep's decline within an even more
massive PEAK/reversal process from 17-May's 1219 high on an active continuation
basis below.
These
issues considered, a bullish policy and exposure remain advised with a failure
below 851.5 required to defer or threaten this call enough to warrant moving to
a neutral/sideline position. In lieu of such weakness, we anticipate a
continuation of the past month's rally to new highs and potentially significant
gains above 891.0.
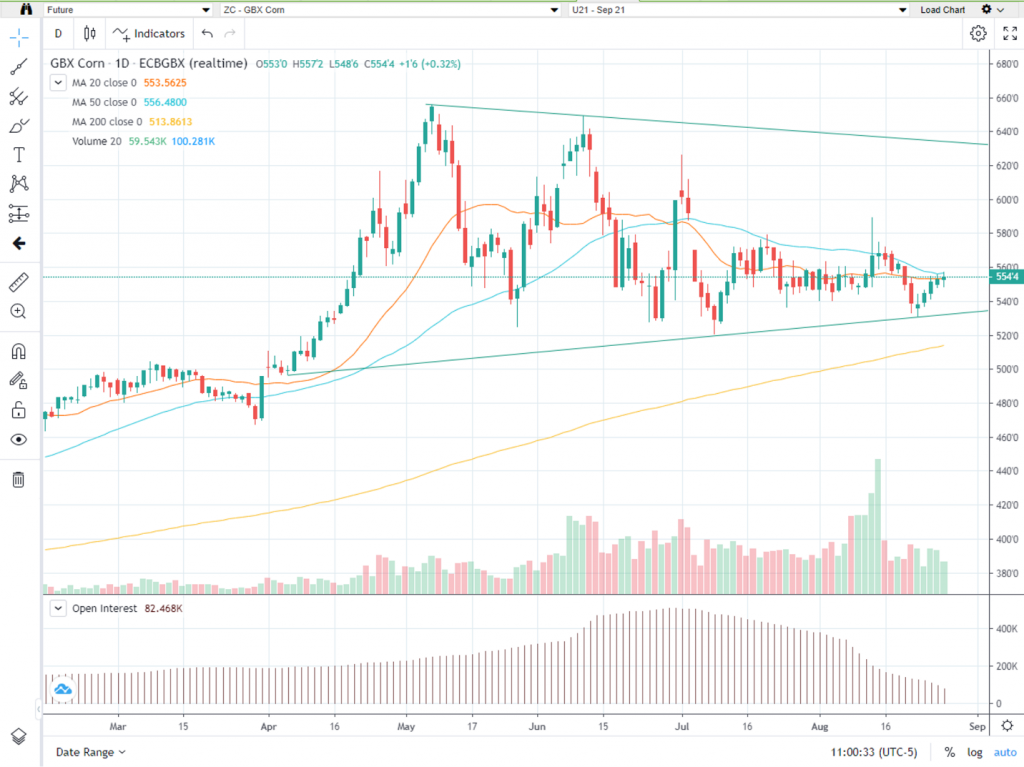
Agricultural - Grains - More Consolidation
Grains - More Consolidation
By: Michael Sabo, Senior Market StrategistPosted Aug 27, 2021 11:15AM CT
Today
is September grain option expiration, last week we watched September corn close
near the lower end of the weekly range. Since Monday, corn reversed course and
headed back higher although still trading in the major range that I mentioned
last week. Monday’s Crop Progress Report revealed further declines in the good
to excellent category which now stand at 60% and this should help support the
market. The market looks poised to close near the highs for the week. In last
week’s article I wrote the following “The market may be getting ready for a
possible bullish set up. Why do I say that?
Look at the volume, open interest, and price (see Sept corn daily chart
below). The price has fallen over the last week (although still trading in the
“big picture” bullish range) volume has fallen and so has open interest. This generally
signifies that the market is ready to strengthen and turn bullish as weak longs
are pushed out of the market.” This
came to fruition so far this week with corn gaining about 15-cents from last
week’s close and I believe there is more to come next week.
In
previous articles I advised the key numbers to watch were $5.81 ½ on the upside
and $5.19 ½ on the downside. I still believe a close above or below those prices
are crucial to establishing a new direction.
There are several, what I consider, minor areas of support and
resistance inside that range that can help with short term market direction if
violated. Call me at 1-800-367-7290 for more in-depth discussion on these
numbers.
I would suggest using an option strategy to manage your futures position risk or an outright option strategy. Implied option volatility recently came down but is still relatively high compared to historical vol levels. You may want to incorporate some short options into your strategy in a calculated risk manner such as bull or bear option spreads. I have 25-years of grain market experience, please feel free to call me at 1-800-367-7290 for more details or to discuss in depth trading strategies. Also be sure to check out my past weekly grain market updates posted on our website.
Corn Sep '21 Daily Chart If you have any questions or would like to discuss the markets further, please feel free to contact me at 800-367-7290 or msabo@rjofutures.com. Agricultural - Lean Hogs Dragging Lower
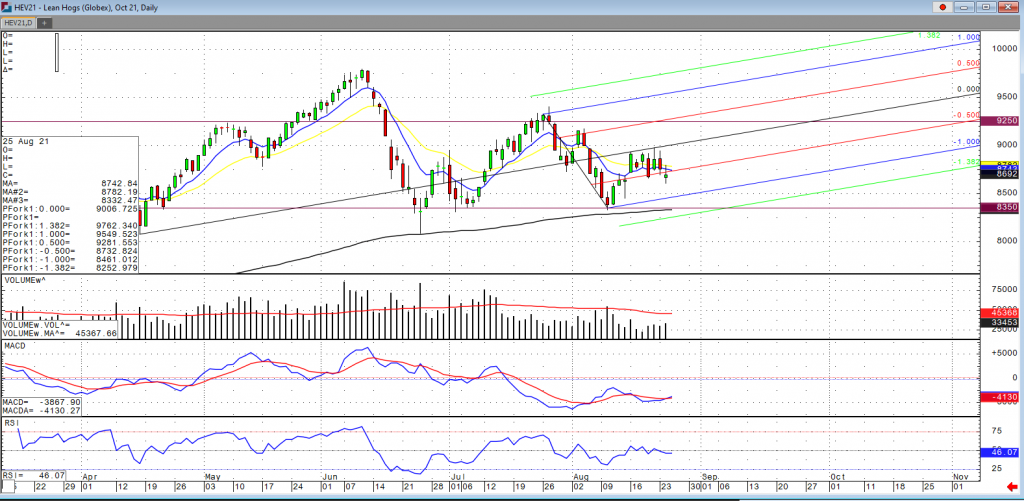
Lean Hogs Dragging Lower
By: Peter McGinnPosted 08/25/2021
Cash hogs continue to trend lower week after week. October hog futures closed lower yesterday, but were substantially off the lows showing a little support around $87. The cold storage report that came out was seen as a bearish factor so it should lend to a continued down trend in the cash market and follow through in the futures. Seasonally, we are coming into a period of increased production, further implicating that prices should continue their downward trend. The USDA pork cutout, released after the close yesterday, came in at $109.73, down from $112.22 on Monday and $116.46 the previous week. This was the lowest the cutout had been since June 25. A year ago, the cutout was 75.49, and two years ago it was 79.08. The CME Lean Hog Index as of August 20th was 107.90 up from 107.56 the previous session but down from 109.67 the previous week. This leaves October hogs at a $20.98 discount to the cash market as compared with the 5-year average discount of $5.56. Internationally, China pork production is back over pre-Covid levels and implicated that less imports are expected. I would look to short the Oct hog futures with a price target at $83.50 and a risk level up to $92.50, keeping within the current range of the market activity. December futures would look to have more of a stronger sell-off with the actual current increase in production coming to market The USDA estimated hog slaughter came in at 474,000 head yesterday. This brings the total for the week so far to 911,000 head, down from 949,000 last week and 953,000 a year ago.
Lean Hogs Oct '21 Daily ChartEquity - Stock Market Higher as it Awaits Powell's Speech
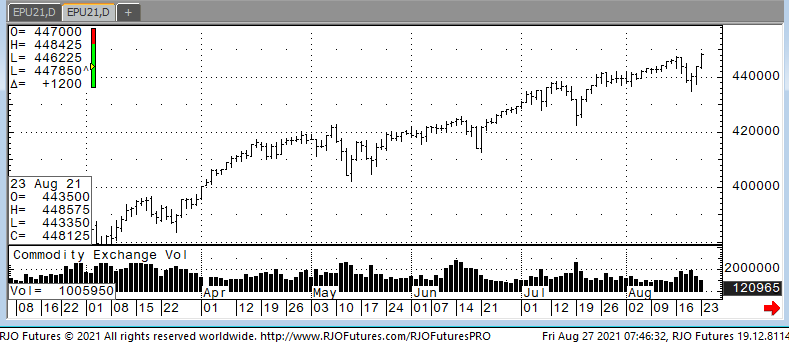
Stock Market Higher as it Awaits Powell's Speech
By: Jeff Yasak, Senior Market StrategistPosted Aug 27, 2021 9:39AM CT
The U.S. stock market had some gains early Friday erasing loses seen Thursday as traders are waiting to hear remarks from the Federal Reserve Chair Jerome Powell. There were some hawkish comments from Fed policy makers earlier in the week that derailed the market, this adding to the crisis in Afghanistan which saw mass casualties including U.S. service members. Ester George, President of the Federal Reserve in Kansas City, stated she would prefer to see asset purchases and monetary policy accommodations reduced “sooner rather than later”. Today's remarks from Powell should reveal a fuller picture of the central bank leader’s ideas on the pace of the U.S. economic recovery in the wake of a surge in covid-19 cases due to the delta variant. A definitive plan is not expected today but it will be interesting what road Powell takes as his comments have been more dovish than the others suggesting a more let’s wait and see attitude on the economy before making any adjustments.
Support today is 445500 and 444500 with resistance showing 448500 and 451000.
E-mini S&P 500 Sep '21 Daily Chart If you have any questions or would like to discuss the markets further, please feel free to contact me at 888-861-1656 or jyasak@rjofutures.com. Economy - S-T Mo Failure Insufficient to End RBOB Correction, But Beware
S-T Mo Failure Insufficient to End RBOB Correction, But Beware
By: RJO Market InsightsPosted 11/08/2022
Posted on Nov 08, 2022, 07:51 by Dave Toth
In Fri's Technical Webcast we identified a
minor corrective low at 2.6328 from Thur as a mini risk parameter the market
needed to sustain gains above to maintain a more immediate bullish count.
The 240-min chart below shows the market's failure overnight below this level,
confirming a bearish divergence in very short-term momentum. This mo
failure defines Fri's 2.8172 high as
one of developing importance and a parameter from which very short-term traders
can objectively base non-bullish decisions like long-covers.
Given
the magnitude of the past three weeks' broader recovery however, this
short-term momentum failure is of an insufficient scale to conclude anything
more than another correction within this broader recovery from 26-Sep's 2.1877
low. Indeed, overnights failure below 2.6328 only allows us to conclude
the end of the portion of the month-and-a-half rally from 31-Oct's 2.4822 next
larger-degree corrective low. 2.4822 is the
risk parameter this market still needs to fail below to break the uptrend from
18-Oct's 2.3526 low while this 2.3526 low
remains intact as the risk parameter this market needs to fail below to break
the month-and-a-half uptrend. From an
intermediate-to-longer-term perspective, this week's setback falls well within
the bounds of another correction ahead of further gains. This is another
excellent example of the importance of technical and trading SCALE and
understanding and matching directional risk exposure to one's personal risk
profile.
The
reason overnight's admittedly minor mo failure might have longer-term
importance is the 2.8172-area from which it stemmed. In
Fri's Technical Blog we also noted the market's engagement of the
2.8076-to-2.8159-area marked by the 61.8% retrace of Jun0-Sewp's 3.2758 -2.1877
decline and the 1.000 progression of Sep-Oct's initial 2.1877 - 2.6185
(suspected a-Wave) rally from 18-Oct's 2.3526 (suspected b-Wave) low. We
remind longer-term players that because of the unique and compelling confluence
of:
early-Aug's bearish divergence in WEEKLY momentum
amidst
historically
extreme bullish sentiment/contrary opinion levels in our RJO Bullish
Sentiment Index
an
arguably complete and massive 5-wave Elliott sequence from Mar'20's 0.4605
low to Jun's 4.3260 high (as labeled in the weekly log active-continuation
chart below) and
the
5-wave impulsive sub-division of Jun-Sep's (suspected initial 1st-Wave) decline
The
recovery attempt from 26-Sep's 2.1877 low is arguably only a 3-wave (Wave-2)
corrective rebuttal to Jun-Sep's decline within a massive, multi-quarter
PEAK/reversal process. Now granted, due to the magnitude of 2020 -2022's
secular bull market, we discussed the prospect for this (2nd-Wave corrective)
recovery to be "extensive" in terms of both price and time. A
"more extensive" correction is typified by a retracement of 61.8% or
more and spanning weeks or even months following a 3-month decline. Per
such, the (suspected corrective) recovery from 26-Sep's 2.1877 low could easily
have further to go, with commensurately larger-degree weakness than that
exhibited this week (i.e., a failure below at least 2.4822) required
to consider the correction complete. Indeed, the daily log chart above
shows the market thus far respecting former 2.6185-area resistance from 10-Oct
as a new support candidate.
These
issues considered, very shorter-term traders have been advised to move to a neutral/sideline
position following overnight's momentum failure below 2.6328, with a recovery
above 2.8172 required to negate this call, reaffirm the recovery and re-expose
potentially significant gains thereafter. For intermediate- and
longer-term players, a bullish policy and exposure remain advised with a
failure below 2.4822 required to threaten this call enough to warrant
neutralizing exposure. We will be watchful for another bearish divergence
in momentum following a recovery attempt that falls short of Fri's 2.8172 high
that would be considered the next reinforcing factor to a count calling that
2.8172 high the prospective end to the month-and-a-half 2nd-Wave
correction. In lieu of such, a resumption of the current rally to
eventual new highs above 2.8172 should not surprise.
By: John Caruso, Senior Market StrategistPosted Aug 26, 2021 1:54PM CT
John Caruso talks about today's moves in the futures markets and what to expect tomorrow ahead for Fed Chairman Jerome Powell's speech. If you have any questions or would like to discuss the markets further, please feel free to contact me at 800-669-5354 or jcaruso@rjofutures.com.