How do you fancy pitting your skills against other futures traders in a risk-free environment to see who’s the best? Trade a 100k simulated account from Sept 12-17 and win cash prizes with $2.5k for the winner. Learn More
New Special Report: Inflation, How Much is Too Much?
With so much money in the market, coupled with weakened supply chains and workforces due to the fallout of Covid-19, we are seeing a rampant run on inflation. Prices from everything to lumber, oil, and groceries are up. Learn why this is happening, how long it will go on for, and how to protect yourself with this Special Report!
The Markets
Metals - Gold Market Without a Direction
Gold Market Without a Direction
By: Frank J. Cholly, Senior Market StrategistPosted Sep 9, 2021 10:40AM CT
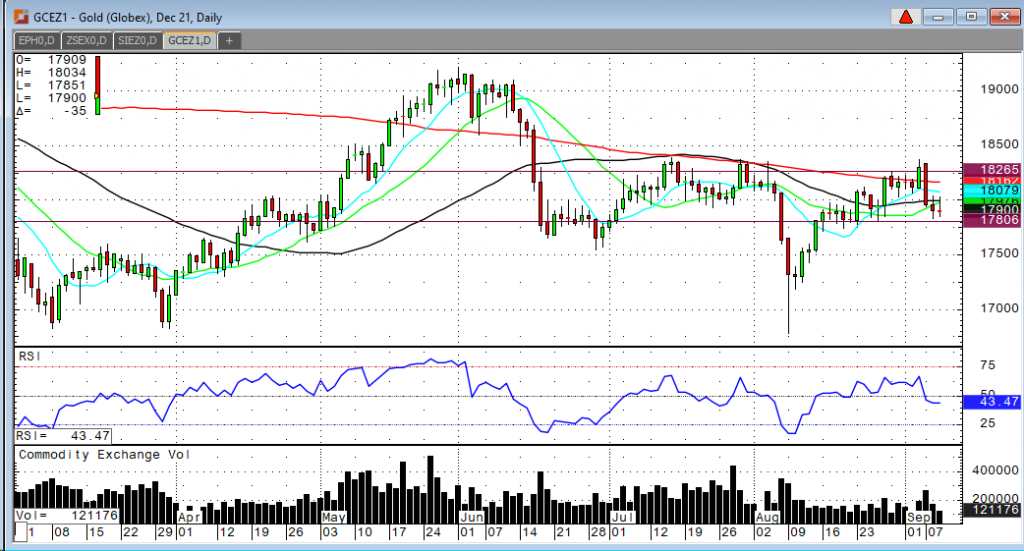
Gold traders are struggling to find direction. It seems
likely to see tapering sooner rather than later, so last weeks rally has
quickly lost steam. Sideways is a trend and easily traded while it lasts, but a
market cannot trade sideways forever either. Gold has recently gone through a
very sharp selloff and an equally sharp recovery bounce. But golds inability to
breakout above $1,830 warns for trade to revisit August swing low of $1,677
range. If gold closes below $1,780 then $1,750 to $1,720 is in the cards. Of
course, anything out of the Fed indicating a “delay” in tapering would be
supportive to gold prices moving back towards $1,830 range. However, the
strength in the dollar and the believe that the Fed will do the right thing has
pressured gold below $1,800. Other precious metals like silver and platinum
have also struggled to hold rallies and find direction.
It's my opinion that the Fed has created a dependency on easy monetary policy. We cannot depend on the Fed to always be there! It used to be easy to be bullish gold. You could always make an excuse…safe haven trade, trade it as a currency, or inflation hedge. The Fed needs to get out of the way and let traders detox cold turkey. Just my opinion. It won’t be easy, and it won’t be pretty, but it is necessary.
Gold Dec '21 Daily Chart If you have any questions or would like to discuss the markets further, please feel free to contact me at 800-826-4124 or fcholly@rjofutures.com. Energy - Oil Steady as US Output Offset by Clouded Demand
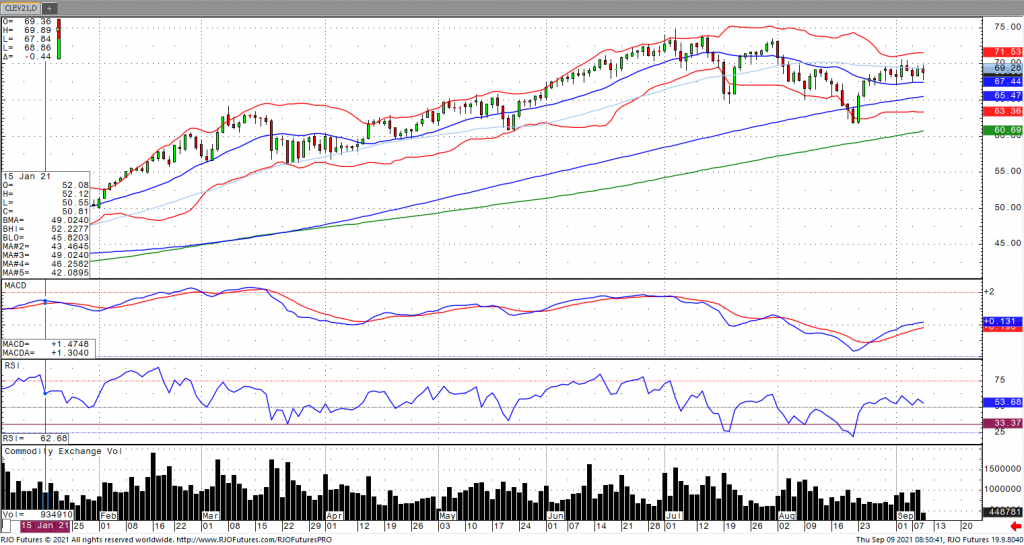
Oil prices are holding steady as of Thursday morning as demand concerns regarding the delta variant have been largely offset by production declines in the Gulf of Mexico. Reports are that only about 20% of oil production have returned, which equates to about 1.4 million barrels per day lost with the Gulf’s offshore wells making up 17% of US output. The EIA revised its 2021 oil production forecast by 200k bpd down to 11.08 million barrels per day. Weekly API data showed a smaller crude drawdown than expected with a greater than expected drawdown in gasoline and distillates. Oil still possess a strong inverse correlation on a 15-day duration with the US Dollar of -0.82 with the market remaining bullish trend as oil volatility (ovx) has fallen to the low 30s with today’s range seen between 67.21 – 71.36.
Crude Oil Oct '21 Daily Chart If you have any questions or would like to discuss the markets further, please feel free to contact me at 800-438-4805 or aturro@rjofutures.com. Softs - Comeback in Cocoa Futures
Comeback in Cocoa Futures
By: Peter MoosesPosted 09/09/2021
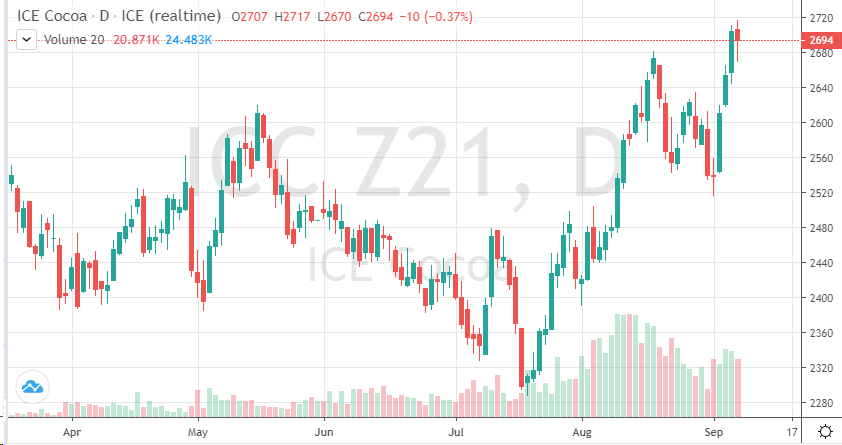
September has been a good trading month thus far for the
bulls in cocoa. December cocoa moved to a multiyear high, but technically
stalled around 2720 making that new resistance. Recent findings out of Ivory
Coast’s production data shows that there will be a continued decline in supply.
This is also being found in other key growing areas in West Africa. Lower
production expectations mixed with stronger short-term demand has led to the
recent rally in prices.
If restrictions begin to ease and Q4 data is stronger than the first ¾ of the year look for prices to continue to move in this direction. For now, weather appears to be a nonfactor in the soft and this market is mainly being driven by global supply and demand. Traders should continue to follow the technicals on pullback for entry and exit points but keep an ear on any changes to demand.
On
the heels of mid-Sep-to-early-Oct's steeper, accelerated, 3rd-wave-looking
recovery, the past week-and-a-half's boringly lateral chop is first considered
a corrective/consolidative event that warns of a continuation of the uptrend
that preceded it to new highs above 04-Oct's 891.0 high. This count
remains consistent with our broader base/correction/recovery count introduced
in 13-Sep's Technical Blog following that
day's bullish divergence in short-term momentum above 07-Sep's 809.5 minor
corrective high detailed in the hourly chart below.
The
important takeaway from this month's lateral, sleepy price action is the
definition of Wed's 851.5 low as
the end or lower boundary of a suspected 4th-Wave correction. A failure
below 851.5 will confirm a bearish divergence in daily momentum and defer or
threaten a bullish count enough to warrant non-bullish decisions like
long-covers. A failure below 851.5 will not
necessarily negate a broader bullish count, but it will threaten it enough to
warrant defensive measures as the next pertinent technical levels below 851.5 are
13-Sep's prospective minor 1st-Wave high at 813.8 and obviously 08-Sep's 766.0
low. And making non-bullish decisions "down there" is
sub-optimal to say the least. Per such, both short- and longer-term
commercial traders are advised to pare or neutralize bullish exposure on a
failure below 851.5, acknowledging and accepting whipsaw risk- back above 04-Oct's
891.0 high- in exchange for much deeper and sub-optimal nominal risk below
766.0.
On
a broader scale, the daily log scale chart above shows the developing potential
for a bearish divergence in daily momentum that will be considered confirmed
below 851.5. This chart also shows the past month's recovery thus far
stalling in the immediate neighborhood of the (888.0) Fibonacci
minimum 38.2% retrace of Apr-Sep's entire 1128 - 766 decline). COMBINED
with a failure below 851.5, traders
would then need to be concerned with at least a larger-degree correction pf the
past month's rally and possibly a resumption of Apr-Sep's major downtrend.
Until
and unless the market fails below 851.5 however, we would
remind longer-term players of the key elements on which our bullish count is
predicated:
a confirmed bullish divergence in WEEKLY momentum
(below)
amidst
an
historically low 11% reading in out RJO Bullish Sentiment Index and
a
textbook complete and major 5-wave Elliott sequence down from 29-Apr's
1128 high to 08-Sep's 766.0 low.
Thus
far, the market is only a month into correcting a 4-MONTH, 32% drawdown, so
further and possibly protracted gains remain well within the bounds of a major
(suspected 2nd-Wave) correction of Apr-Sep's decline within an even more
massive PEAK/reversal process from 17-May's 1219 high on an active continuation
basis below.
These
issues considered, a bullish policy and exposure remain advised with a failure
below 851.5 required to defer or threaten this call enough to warrant moving to
a neutral/sideline position. In lieu of such weakness, we anticipate a
continuation of the past month's rally to new highs and potentially significant
gains above 891.0.
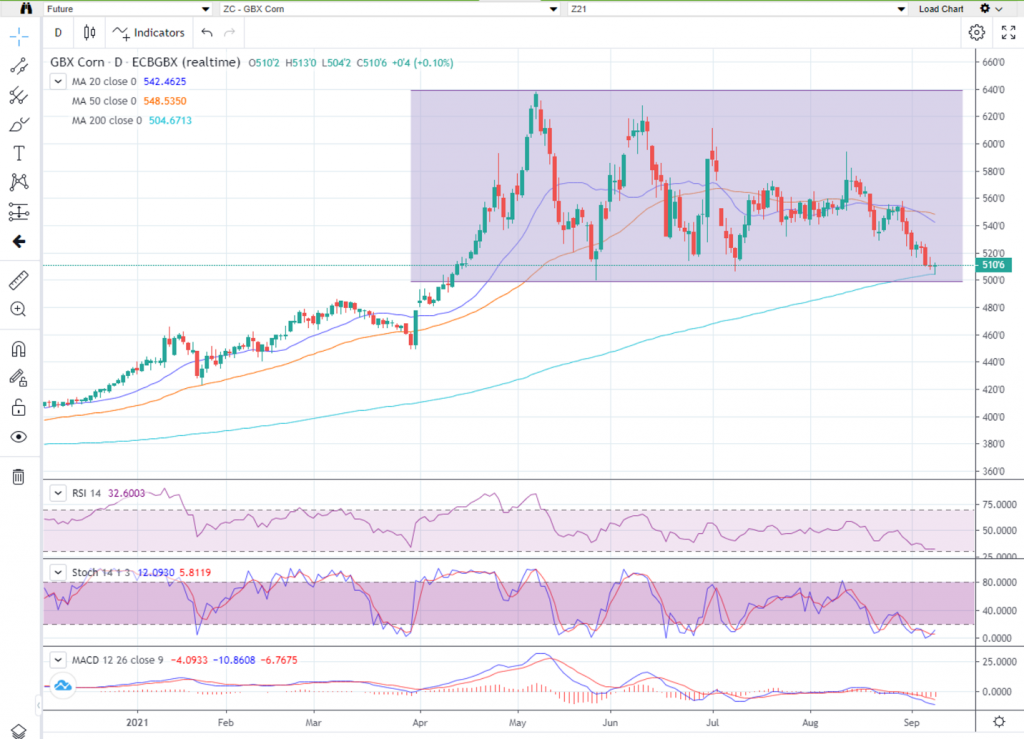
After some consolidation on the daily December corn chart last week the market broke a bit lower this week but appears it may be finding support around the 200 day moving average (see chart below) couple the 200 MA around $5.04 ½ with the monthly May low $5.00 ¼ I mentioned in several articles and the market appears ready for a major move. Tomorrow's USDA numbers could be the catalyst to break this market lower or could cause this market to take off like a rocket. As I see it most of the negative news has been “baked in” to the current prices so in order to break it lower we will need to see some rather bearish numbers otherwise look out, we could see a nice pop. USDA Supply/Demand and Crop Production will be released at 11am cst tomorrow. If you would like to receive RJO Insights right after the Reports are released please email me your contact info and I will add it to my distribution list.
The key numbers I think that are relevant to watch for December corn are $4.99 on the downside and $6.39 ½ on the upside – basically a breakout on the monthly chart, those numbers are based off December corn month of May high and low. Every month since then has been inside May's trading range. There are several, what I consider, minor areas of support and resistance inside that range that can help with short term market direction if violated. Call me at 1-800-367-7290 for more in-depth discussion on these numbers.
I would suggest using an option strategy to manage your futures position risk or an outright option strategy. Implied option volatility recently came down but is still relatively high compared to historical vol levels. You may want to incorporate some short options into your strategy in a calculated risk manner such as bull or bear option spreads. I have 25 years of grain market experience, please feel free to call me at 1-800-367-7290 for more details or to discuss in depth trading strategies. Also be sure to check out my past weekly grain market updates posted on our website.
Corn Dec '21 Daily Chart If you have any questions or would like to discuss the markets further, please feel free to contact me at 800-367-7290 or msabo@rjofutures.com. Agricultural - Hogs Appear Overbought
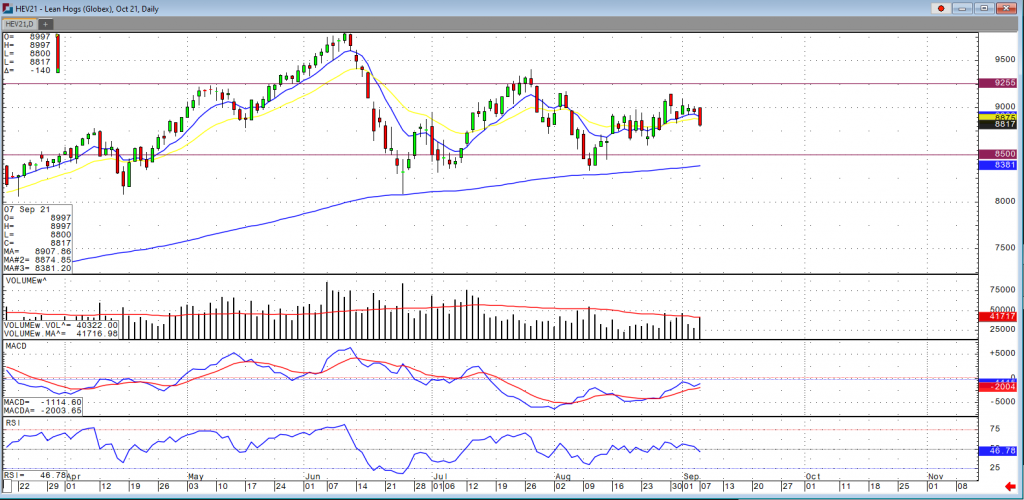
Hogs Appear Overbought
By: Peter McGinnPosted 09/08/2021
The hog trade was down yesterday close to $2 for the October contract. Right now, the market is in overbought conditions and is expected for some long liquidation unless we see some better export numbers. China, being a major market mover, has imported 8.9% less in August as compared to a year ago. The USDA pork cutout, released after the close Friday, came in at $106.99, down from $108.19 on Thursday and $115.45 the previous week. In the last two years, the cutout has traded near $70.00 in early September. There is a lot of outside forces pressuring this market to the downside and if things continue on the international stage as they are with respect to the import and export numbers, then the market has some severe downside risk. I still like taking the short side of this in the Oct futures to $85 level, I would look to reverse above $92.50. The USDA estimated hog slaughter came in at 463,000 head Friday and 28,000 head for Saturday. This brought the total for last week to 2.398 million head, down from 2.438 million the previous week and 2.466 million a year ago. Friday's Commitments of Traders report showed managed money traders were net buyers of 4,182 contracts of lean hogs for the week ending August 31, increasing their net long to 83,389. Non-commercial & non-reportable traders were net buyers of 2,629, increasing their net long to 77,151.
Live Hogs Oct '21 Daily ChartEquity - Stocks Up on Jobless Claims
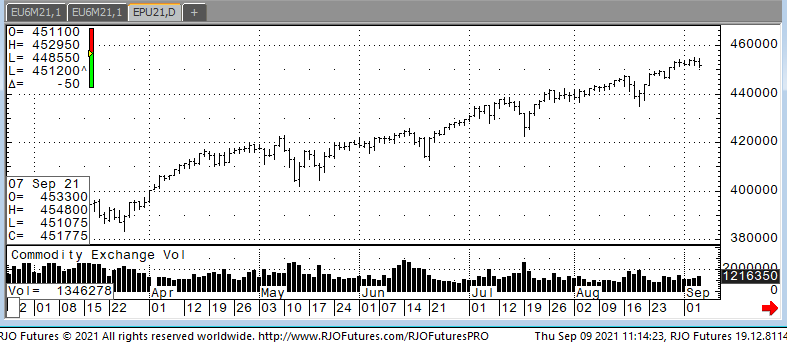
Stock futures were up this morning trying to hold off a 4th consecutive day of losses as traders are torn between a hot job market and the worries of soaring Covid-19 infections. Wednesday showed the DJIA and S&P 500 posting their 3rd consecutive days of losses as the tech-based Nasdaq fell for the first time this week. The market has taken bad news in stride, but August’s poor jobs data put a damper on 4th quarter strength. Another release by the Labor Department showed that open jobs hit a new record with nearly 11 positions remaining unfilled. New jobless claims came in today at 310,000, a pandemic era low. It yet remains to be seen how investors will try to sort the hot job market that is losing steam based on all the new cases of the Delta variant Covid-19 strain.
Support today is 449300 and 447500 with resistance showing 453000 and 454500.
E-mini S&P 500 Sep '21 Daily chart If you have any questions or would like to discuss the markets further, please feel free to contact me at 888-861-1656 or jyasak@rjofutures.com. Economy - S-T Mo Failure Insufficient to End RBOB Correction, But Beware
S-T Mo Failure Insufficient to End RBOB Correction, But Beware
By: RJO Market InsightsPosted 11/08/2022
Posted on Nov 08, 2022, 07:51 by Dave Toth
In Fri's Technical Webcast we identified a
minor corrective low at 2.6328 from Thur as a mini risk parameter the market
needed to sustain gains above to maintain a more immediate bullish count.
The 240-min chart below shows the market's failure overnight below this level,
confirming a bearish divergence in very short-term momentum. This mo
failure defines Fri's 2.8172 high as
one of developing importance and a parameter from which very short-term traders
can objectively base non-bullish decisions like long-covers.
Given
the magnitude of the past three weeks' broader recovery however, this
short-term momentum failure is of an insufficient scale to conclude anything
more than another correction within this broader recovery from 26-Sep's 2.1877
low. Indeed, overnights failure below 2.6328 only allows us to conclude
the end of the portion of the month-and-a-half rally from 31-Oct's 2.4822 next
larger-degree corrective low. 2.4822 is the
risk parameter this market still needs to fail below to break the uptrend from
18-Oct's 2.3526 low while this 2.3526 low
remains intact as the risk parameter this market needs to fail below to break
the month-and-a-half uptrend. From an
intermediate-to-longer-term perspective, this week's setback falls well within
the bounds of another correction ahead of further gains. This is another
excellent example of the importance of technical and trading SCALE and
understanding and matching directional risk exposure to one's personal risk
profile.
The
reason overnight's admittedly minor mo failure might have longer-term
importance is the 2.8172-area from which it stemmed. In
Fri's Technical Blog we also noted the market's engagement of the
2.8076-to-2.8159-area marked by the 61.8% retrace of Jun0-Sewp's 3.2758 -2.1877
decline and the 1.000 progression of Sep-Oct's initial 2.1877 - 2.6185
(suspected a-Wave) rally from 18-Oct's 2.3526 (suspected b-Wave) low. We
remind longer-term players that because of the unique and compelling confluence
of:
early-Aug's bearish divergence in WEEKLY momentum
amidst
historically
extreme bullish sentiment/contrary opinion levels in our RJO Bullish
Sentiment Index
an
arguably complete and massive 5-wave Elliott sequence from Mar'20's 0.4605
low to Jun's 4.3260 high (as labeled in the weekly log active-continuation
chart below) and
the
5-wave impulsive sub-division of Jun-Sep's (suspected initial 1st-Wave) decline
The
recovery attempt from 26-Sep's 2.1877 low is arguably only a 3-wave (Wave-2)
corrective rebuttal to Jun-Sep's decline within a massive, multi-quarter
PEAK/reversal process. Now granted, due to the magnitude of 2020 -2022's
secular bull market, we discussed the prospect for this (2nd-Wave corrective)
recovery to be "extensive" in terms of both price and time. A
"more extensive" correction is typified by a retracement of 61.8% or
more and spanning weeks or even months following a 3-month decline. Per
such, the (suspected corrective) recovery from 26-Sep's 2.1877 low could easily
have further to go, with commensurately larger-degree weakness than that
exhibited this week (i.e., a failure below at least 2.4822) required
to consider the correction complete. Indeed, the daily log chart above
shows the market thus far respecting former 2.6185-area resistance from 10-Oct
as a new support candidate.
These
issues considered, very shorter-term traders have been advised to move to a neutral/sideline
position following overnight's momentum failure below 2.6328, with a recovery
above 2.8172 required to negate this call, reaffirm the recovery and re-expose
potentially significant gains thereafter. For intermediate- and
longer-term players, a bullish policy and exposure remain advised with a
failure below 2.4822 required to threaten this call enough to warrant
neutralizing exposure. We will be watchful for another bearish divergence
in momentum following a recovery attempt that falls short of Fri's 2.8172 high
that would be considered the next reinforcing factor to a count calling that
2.8172 high the prospective end to the month-and-a-half 2nd-Wave
correction. In lieu of such, a resumption of the current rally to
eventual new highs above 2.8172 should not surprise.
Economy - Futures Market Outlook w/John Caruso - 09/08/2021
Futures Market Outlook w/John Caruso - 09/08/2021
By: John Caruso, Senior Market StrategistPosted Sep 8, 2021 12:39PM CT
John Caruso talks about the latest news moving the futures markets including some material reversals in metals. If you have any questions or would like to discuss the markets further, please feel free to contact me at 800-669-5354 or jcaruso@rjofutures.com.