The difference between historical & implied volatility
How to spot regimes of high and low volatility
Which option strategies to apply and when
How to read price action to support your option trades
New Special Report: Inflation, How Much is Too Much?
With so much money in the market, coupled with weakened supply chains and workforces due to the fallout of Covid-19, we are seeing a rampant run on inflation. Prices from everything to lumber, oil, and groceries are up. Learn why this is happening, how long it will go on for, and how to protect yourself with this Special Report!
The Markets
Metals - In Gold, The Bears Have Control
In Gold, The Bears Have Control
By: Frank J. Cholly, Senior Market StrategistPosted Sep 17, 2021 10:16AM CT
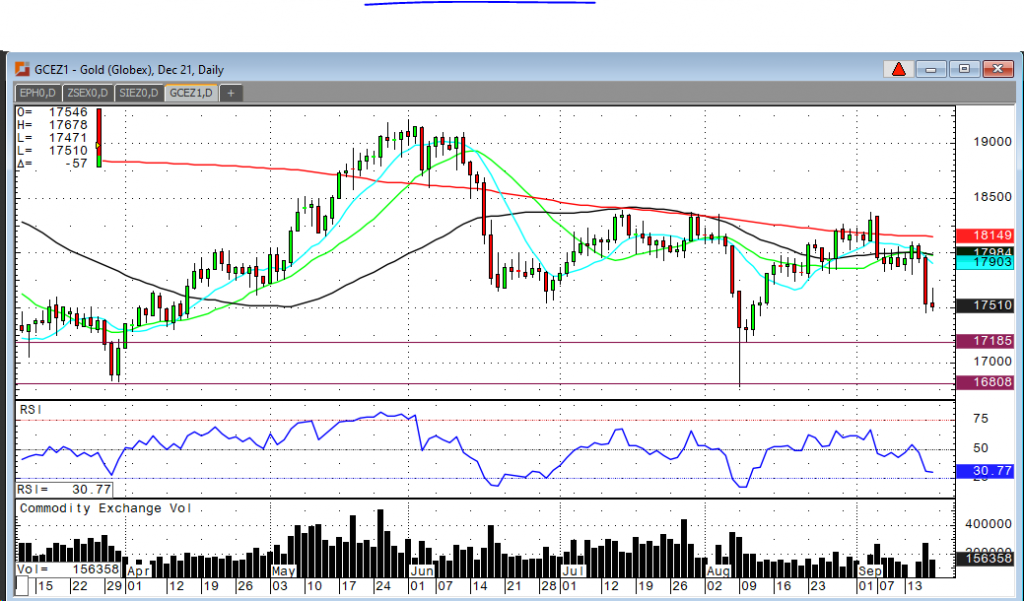
After yesterday’s big washout in gold, due to a complete
flip in the Retail Sales report from what the market expected and what was
actually reported, the path of least resistance now is down. Yesterday’s action
was a trend changer. With gold now trading at $1,750 we can now target $1,720
to $1,700 as the next level or range to be tested. Gold traders want a “dovish”
Fed. Strong inflation data will force the Fed’s hand to taper sooner rather
than later. I wouldn’t be surprised to see gold take a breather after
yesterday’s sharp selloff and trade sideways until next week’s FOMC Meeting.
Today there’s red all over the board. Dollar strength coming from prospects of higher rates puts pressure on all commodities. Equities down for the same reason. Treasuries down as yields tic higher. You know how it works. You have to pay attention to outside markets regardless of what market you trade.
Gold Dec '21 Daily Chart If you have any questions or would like to discuss the markets further, please feel free to contact me at 800-826-4124 or fcholly@rjofutures.com. Energy - Oil Poised For Weekly Gain of 2.6%
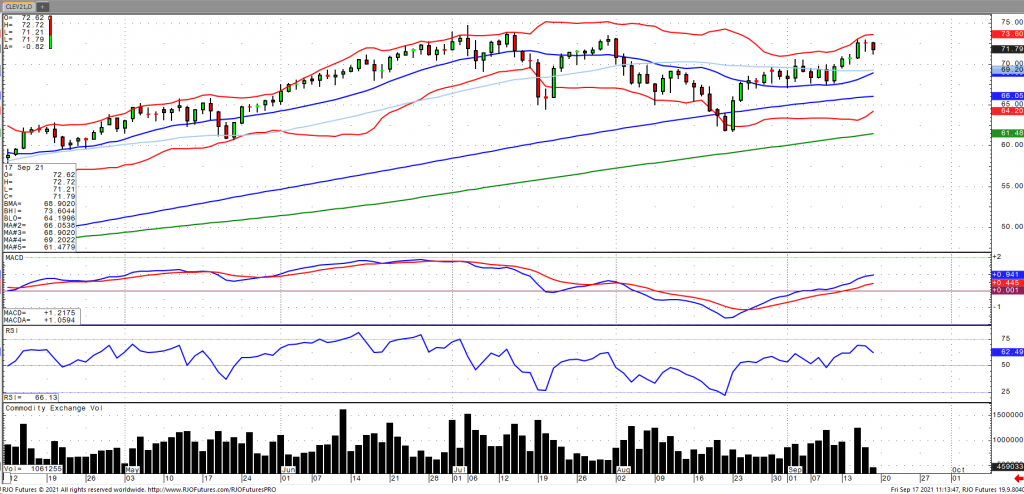
Oil prices are softer by 1% on Friday as more US offshore production continues to come back online despite indications by US Gulf market regulators that 28% of US Gulf production remains unavailable. Crude stocks declined -6.42 million barrels for the sixth consecutive draw, according to the EIA. Stocks are now -786 mb below last year’s levels and -27.78 mb below the five-year average. To note, Saudi Arabian oil exports reached a 6-month high as OPEC+ is continues to ramp up output for the rest of the year. This comes as OPEC and the IEA reported that oil demand could reach 100 million barrels per day as soon as the second quarter of next year. Oil volatility (OVX) has continued to fall to cycle lows with the market remaining bullish trend with today’s range seen between 68.32 – 73.33.
Crude Oil Oct '21 Daily Chart If you have any questions or would like to discuss the markets further, please feel free to contact me at 800-438-4805 or aturro@rjofutures.com. Agricultural - Bullish Canola Count Intact Above Minimum 851.5
Bullish Canola Count Intact Above Minimum 851.5
By: RJO Market InsightsPosted 10/14/2022
Posted on Oct 14, 2022, 07:42 by Dave Toth
On
the heels of mid-Sep-to-early-Oct's steeper, accelerated, 3rd-wave-looking
recovery, the past week-and-a-half's boringly lateral chop is first considered
a corrective/consolidative event that warns of a continuation of the uptrend
that preceded it to new highs above 04-Oct's 891.0 high. This count
remains consistent with our broader base/correction/recovery count introduced
in 13-Sep's Technical Blog following that
day's bullish divergence in short-term momentum above 07-Sep's 809.5 minor
corrective high detailed in the hourly chart below.
The
important takeaway from this month's lateral, sleepy price action is the
definition of Wed's 851.5 low as
the end or lower boundary of a suspected 4th-Wave correction. A failure
below 851.5 will confirm a bearish divergence in daily momentum and defer or
threaten a bullish count enough to warrant non-bullish decisions like
long-covers. A failure below 851.5 will not
necessarily negate a broader bullish count, but it will threaten it enough to
warrant defensive measures as the next pertinent technical levels below 851.5 are
13-Sep's prospective minor 1st-Wave high at 813.8 and obviously 08-Sep's 766.0
low. And making non-bullish decisions "down there" is
sub-optimal to say the least. Per such, both short- and longer-term
commercial traders are advised to pare or neutralize bullish exposure on a
failure below 851.5, acknowledging and accepting whipsaw risk- back above 04-Oct's
891.0 high- in exchange for much deeper and sub-optimal nominal risk below
766.0.
On
a broader scale, the daily log scale chart above shows the developing potential
for a bearish divergence in daily momentum that will be considered confirmed
below 851.5. This chart also shows the past month's recovery thus far
stalling in the immediate neighborhood of the (888.0) Fibonacci
minimum 38.2% retrace of Apr-Sep's entire 1128 - 766 decline). COMBINED
with a failure below 851.5, traders
would then need to be concerned with at least a larger-degree correction pf the
past month's rally and possibly a resumption of Apr-Sep's major downtrend.
Until
and unless the market fails below 851.5 however, we would
remind longer-term players of the key elements on which our bullish count is
predicated:
a confirmed bullish divergence in WEEKLY momentum
(below)
amidst
an
historically low 11% reading in out RJO Bullish Sentiment Index and
a
textbook complete and major 5-wave Elliott sequence down from 29-Apr's
1128 high to 08-Sep's 766.0 low.
Thus
far, the market is only a month into correcting a 4-MONTH, 32% drawdown, so
further and possibly protracted gains remain well within the bounds of a major
(suspected 2nd-Wave) correction of Apr-Sep's decline within an even more
massive PEAK/reversal process from 17-May's 1219 high on an active continuation
basis below.
These
issues considered, a bullish policy and exposure remain advised with a failure
below 851.5 required to defer or threaten this call enough to warrant moving to
a neutral/sideline position. In lieu of such weakness, we anticipate a
continuation of the past month's rally to new highs and potentially significant
gains above 891.0.
In
last week’s article which was published on Thursday the day before the USDA
Report I advised the following: Tomorrow’s USDA numbers could be the
catalyst to break this market lower or could cause this market to take off like
a rocket. As I see it most of the negative news has been “baked in” to the
current prices so in order to break it lower we will need to see some rather
bearish numbers otherwise look out, we could see a nice pop. After the report
came out on Friday, we saw the bulls “shake the tree” and knock the weak longs
out of the market and attract some fresh short sellers only to then climb from
Friday’s low of $4.97 ½ to yesterday’s high of $5.37 ½, a nice 40 cent move
higher over 5 trading sessions! The report basically ended up inside the range
of guestimates and with prices already depressed heading into the report
coupled with strong support around the May monthly low and 200 moving average
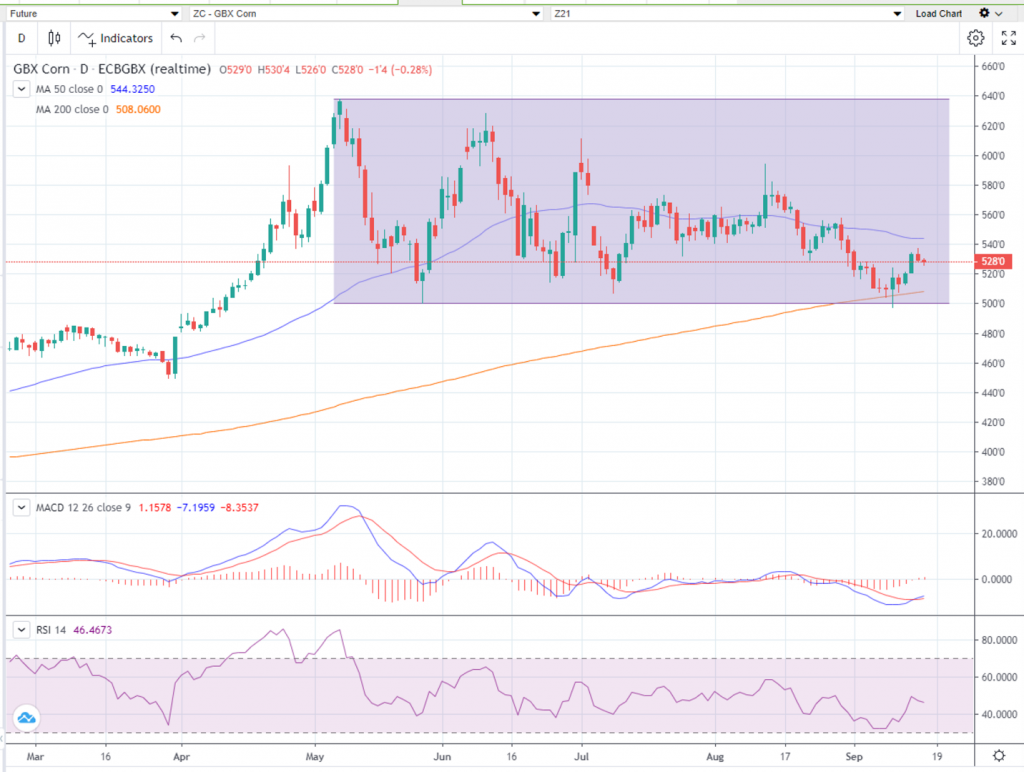
one could see why the market performed the way it. Currently, prices are
trading around $5.25 which appears to be some profit taking ahead of the
weekend, if the market consolidates around this area I would expect to see the
market head to around the $5.42ish range before running into resistance again. Watch
for short term support around $5.18 area.
Slight
revision on major support areas: Watch December
corn at $4.96 on the downside vs $4.99 and $6.39 ½ on the upside – basically a
breakout on the May monthly chart, those numbers are based off December corn
month of May high and Friday’s low. There are several, what I consider, minor
areas of support and resistance inside that range that can help with short term
market direction if violated. Call me at 1-800-367-7290 for more in-depth
discussion on these numbers.
I would suggest using an option strategy to manage your futures position risk or an outright option strategy. Implied option volatility recently came down but is still relatively high compared to historical vol levels. You may want to incorporate some short options into your strategy in a calculated risk manner such as bull or bear option spreads. I have 25 years of grain market experience, please feel free to call me at 1-800-367-7290 for more details or to discuss in depth trading strategies. Also be sure to check out my past weekly grain market updates posted on our website.
Corn Dec '21 Daily Chart If you have any questions or would like to discuss the markets further, please feel free to contact me at 800-367-7290 or msabo@rjofutures.com. Interest Rates - Interest Rates Enter Short-Term Downtrend
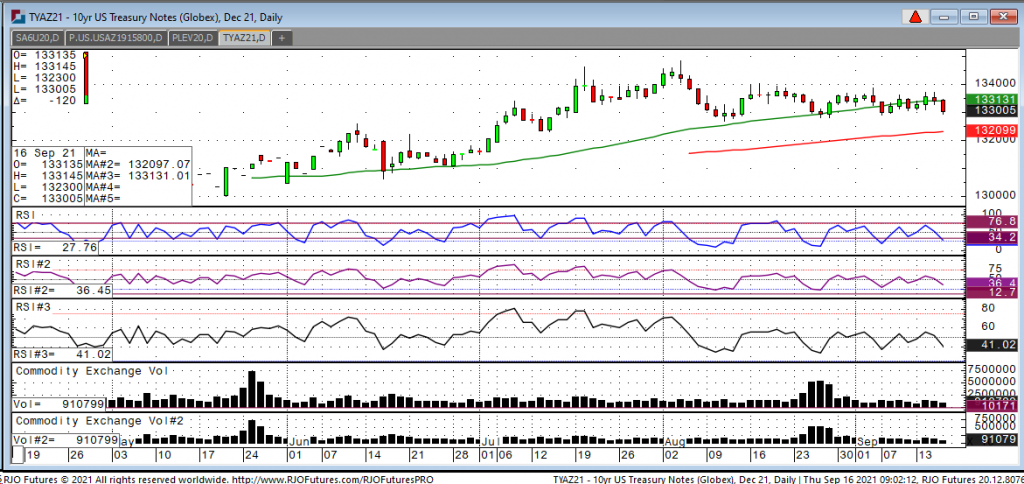
Looking at the December 10-year note we have a high of 133-145 and a low of 132-305 and currently trading at 132-315. What we have been seeing in the last few weeks is data coming out on the weak side which has given the note a bid. Today that changed and possibly the trend as well. This morning the street was watching retail sales and was expecting a reading of down 0.8% but instead we saw a somewhat robust reading of up 0.7% which definitely took traders by surprise and we are seeing the yield on the 10-year at 1.35%, which making traders think that chairman Powell might actually taper earlier rather than later. In today’s down move we are currently under the 50-day moving average which currently lies at 133-13 and often is a good predictor of a trend change. Looking at this market from a technical view, I would say selling rallies in the note with protection above the 50-day moving average might be a good trade since, in my opinion, we have entered a short-term downtrend.
10-Yr Note Dec '21 Daily Chart If you have any questions or would like to discuss the markets further, please feel free to contact me at 800-826-2270 or gperlin@rjofutures.com. Equity - Stocks Lower to End Week
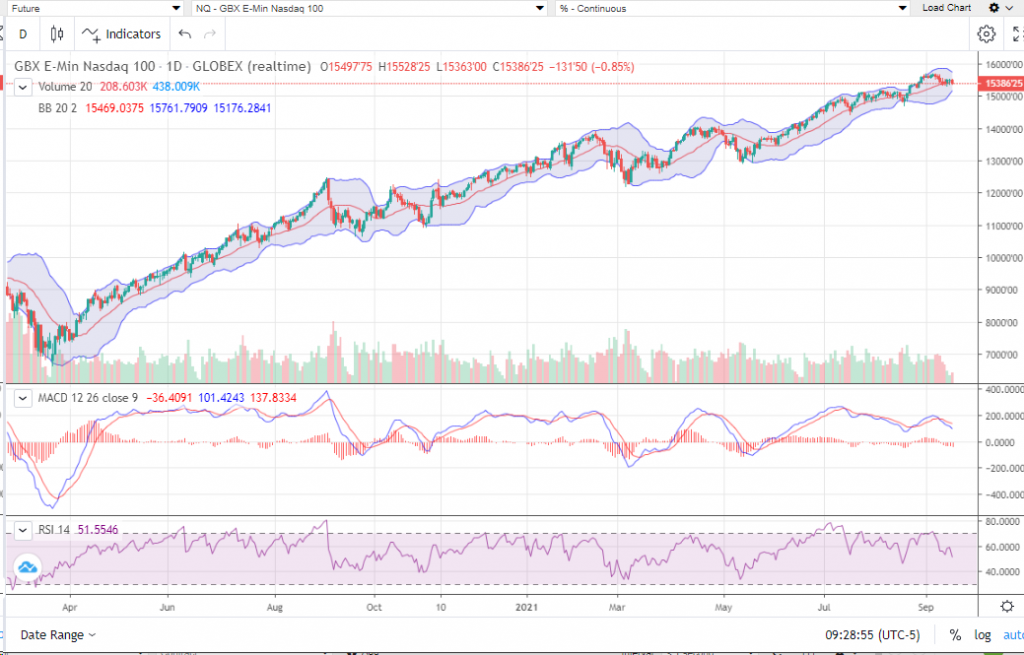
Indices appeared poised to finish of the week in positive territory yesterday afternoon. That is all in jeopardy this morning as selling has dominated the early going. The four major indices are off anywhere from 0.4-0.8%. September futures are coming off the board this morning, and an estimated $3.4 Trillion in options are set to mature (With a September record of approximately $740 billion in individual names). Consensus is now bearish, and people are paying large premiums to hedge as indicated by the large increases in implied volatility premiums. This can be viewed as an indication that people are willing to pay up for protection, because they fell the next big selloff is coming. The market has a funny way of pleasing the least amount of people, but perhaps they’ll be right. Since the Covid bottom last March, any and all multi-day selloffs have been buying opportunities. Surely that will stop working at some point, but I just don’t think it is broken yet. Perhaps that changes next week with the Fed. If so, a lot of people will finally be happy to have had their downside hedges in place.
E-mini S&P 500 Sep '21 Daily Chart If you have any questions or would like to discuss the markets further, please feel free to contact me at 800-669-5354 or bdixon@rjofutures.com. Economy - S-T Mo Failure Insufficient to End RBOB Correction, But Beware
S-T Mo Failure Insufficient to End RBOB Correction, But Beware
By: RJO Market InsightsPosted 11/08/2022
Posted on Nov 08, 2022, 07:51 by Dave Toth
In Fri's Technical Webcast we identified a
minor corrective low at 2.6328 from Thur as a mini risk parameter the market
needed to sustain gains above to maintain a more immediate bullish count.
The 240-min chart below shows the market's failure overnight below this level,
confirming a bearish divergence in very short-term momentum. This mo
failure defines Fri's 2.8172 high as
one of developing importance and a parameter from which very short-term traders
can objectively base non-bullish decisions like long-covers.
Given
the magnitude of the past three weeks' broader recovery however, this
short-term momentum failure is of an insufficient scale to conclude anything
more than another correction within this broader recovery from 26-Sep's 2.1877
low. Indeed, overnights failure below 2.6328 only allows us to conclude
the end of the portion of the month-and-a-half rally from 31-Oct's 2.4822 next
larger-degree corrective low. 2.4822 is the
risk parameter this market still needs to fail below to break the uptrend from
18-Oct's 2.3526 low while this 2.3526 low
remains intact as the risk parameter this market needs to fail below to break
the month-and-a-half uptrend. From an
intermediate-to-longer-term perspective, this week's setback falls well within
the bounds of another correction ahead of further gains. This is another
excellent example of the importance of technical and trading SCALE and
understanding and matching directional risk exposure to one's personal risk
profile.
The
reason overnight's admittedly minor mo failure might have longer-term
importance is the 2.8172-area from which it stemmed. In
Fri's Technical Blog we also noted the market's engagement of the
2.8076-to-2.8159-area marked by the 61.8% retrace of Jun0-Sewp's 3.2758 -2.1877
decline and the 1.000 progression of Sep-Oct's initial 2.1877 - 2.6185
(suspected a-Wave) rally from 18-Oct's 2.3526 (suspected b-Wave) low. We
remind longer-term players that because of the unique and compelling confluence
of:
early-Aug's bearish divergence in WEEKLY momentum
amidst
historically
extreme bullish sentiment/contrary opinion levels in our RJO Bullish
Sentiment Index
an
arguably complete and massive 5-wave Elliott sequence from Mar'20's 0.4605
low to Jun's 4.3260 high (as labeled in the weekly log active-continuation
chart below) and
the
5-wave impulsive sub-division of Jun-Sep's (suspected initial 1st-Wave) decline
The
recovery attempt from 26-Sep's 2.1877 low is arguably only a 3-wave (Wave-2)
corrective rebuttal to Jun-Sep's decline within a massive, multi-quarter
PEAK/reversal process. Now granted, due to the magnitude of 2020 -2022's
secular bull market, we discussed the prospect for this (2nd-Wave corrective)
recovery to be "extensive" in terms of both price and time. A
"more extensive" correction is typified by a retracement of 61.8% or
more and spanning weeks or even months following a 3-month decline. Per
such, the (suspected corrective) recovery from 26-Sep's 2.1877 low could easily
have further to go, with commensurately larger-degree weakness than that
exhibited this week (i.e., a failure below at least 2.4822) required
to consider the correction complete. Indeed, the daily log chart above
shows the market thus far respecting former 2.6185-area resistance from 10-Oct
as a new support candidate.
These
issues considered, very shorter-term traders have been advised to move to a neutral/sideline
position following overnight's momentum failure below 2.6328, with a recovery
above 2.8172 required to negate this call, reaffirm the recovery and re-expose
potentially significant gains thereafter. For intermediate- and
longer-term players, a bullish policy and exposure remain advised with a
failure below 2.4822 required to threaten this call enough to warrant
neutralizing exposure. We will be watchful for another bearish divergence
in momentum following a recovery attempt that falls short of Fri's 2.8172 high
that would be considered the next reinforcing factor to a count calling that
2.8172 high the prospective end to the month-and-a-half 2nd-Wave
correction. In lieu of such, a resumption of the current rally to
eventual new highs above 2.8172 should not surprise.