Basic technical analysis and trading strategy applicable to these markets
New Special Report: Inflation, How Much is Too Much?
With so much money in the market, coupled with weakened supply chains and workforces due to the fallout of Covid-19, we are seeing a rampant run on inflation. Prices from everything to lumber, oil, and groceries are up. Learn why this is happening, how long it will go on for, and how to protect yourself with this Special Report!
The Markets
Metals - Gold Seeing a Slight Dip Friday
Gold Seeing a Slight Dip Friday
By: RJOF Editorial TeamPosted 10/01/2021
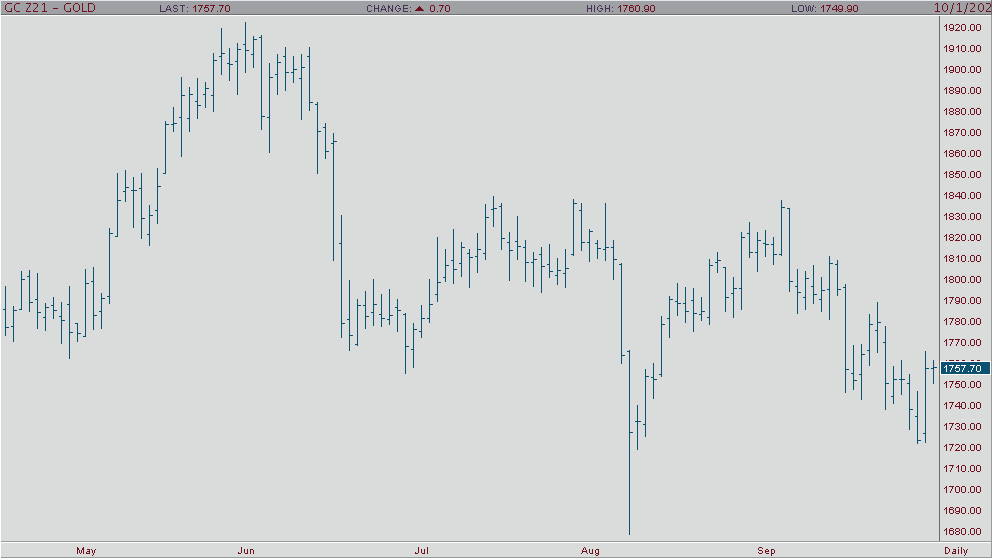
Despite a dip in the U.S. dollar and bonds, we saw gold
futures trend a little bit lower this morning giving us a rather sluggish start
to Q3. At the time of this writing, December gold is trading down .01% after we
saw a 2% rise on Thursday, so not all is lost, but it is something worth
following closely as gold is trading at $1757/oz.
It is interesting that we are seeing a loss today as most investors seem to be rather bullish on gold. When you take into consideration the weakness of the U.S. dollar and the probable tapering on bond buying by the Fed, it should create some opportunities in gold. The fundamentals are all there for gold to go on a bullish run.
Gold Dec '21 Daily ChartEnergy - Oil Set for Sixth Consecutive Week of Gains
Oil Set for Sixth Consecutive Week of Gains
By: Alex Turro, Senior Market StrategistPosted Oct 1, 2021 9:48AM CT
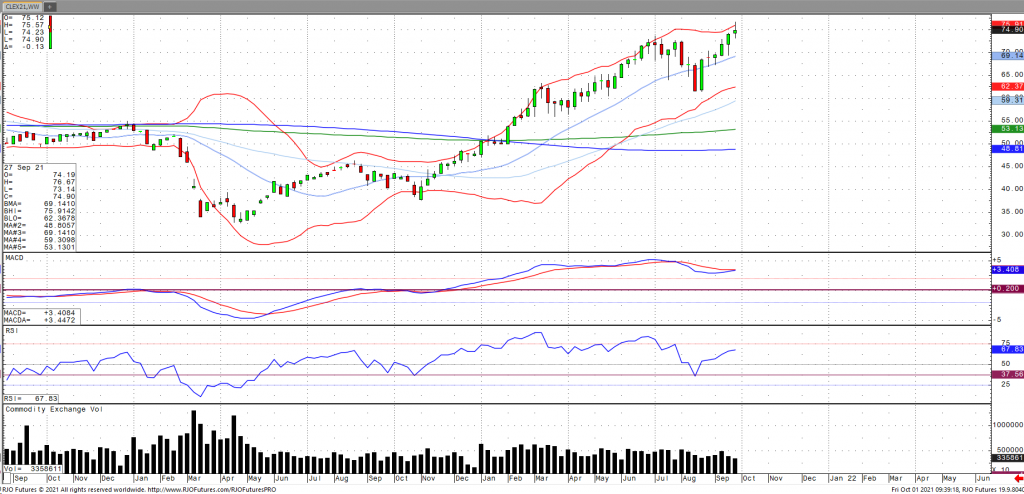
Oil prices are holding steady as of Friday morning and are poised for their sixth consecutive week of gains as the market assess the impact of OPEC+ potentially raising their output production by 400k barrels per day in November and December. This comes as OPEC+ noted an increase in output in the month of September, in large part due to a surprise output increase from Nigeria. Crude stocks rose for the first time in seven weeks, up +4.578 million barrels bringing stocks down to -73.884 million barrels below last year’s levels and -32.079 million barrels below the five-year average. The market continues to remain bullish trend with today’s range seen observed amid yet another higher low between 71.47 – 77.52.
Crude Oil Nov '21 Daily Chart If you have any questions or would like to discuss the markets further, please feel free to contact me at 800-438-4805 or aturro@rjofutures.com. Agricultural - Bullish Canola Count Intact Above Minimum 851.5
Bullish Canola Count Intact Above Minimum 851.5
By: RJO Market InsightsPosted 10/14/2022
Posted on Oct 14, 2022, 07:42 by Dave Toth
On
the heels of mid-Sep-to-early-Oct's steeper, accelerated, 3rd-wave-looking
recovery, the past week-and-a-half's boringly lateral chop is first considered
a corrective/consolidative event that warns of a continuation of the uptrend
that preceded it to new highs above 04-Oct's 891.0 high. This count
remains consistent with our broader base/correction/recovery count introduced
in 13-Sep's Technical Blog following that
day's bullish divergence in short-term momentum above 07-Sep's 809.5 minor
corrective high detailed in the hourly chart below.
The
important takeaway from this month's lateral, sleepy price action is the
definition of Wed's 851.5 low as
the end or lower boundary of a suspected 4th-Wave correction. A failure
below 851.5 will confirm a bearish divergence in daily momentum and defer or
threaten a bullish count enough to warrant non-bullish decisions like
long-covers. A failure below 851.5 will not
necessarily negate a broader bullish count, but it will threaten it enough to
warrant defensive measures as the next pertinent technical levels below 851.5 are
13-Sep's prospective minor 1st-Wave high at 813.8 and obviously 08-Sep's 766.0
low. And making non-bullish decisions "down there" is
sub-optimal to say the least. Per such, both short- and longer-term
commercial traders are advised to pare or neutralize bullish exposure on a
failure below 851.5, acknowledging and accepting whipsaw risk- back above 04-Oct's
891.0 high- in exchange for much deeper and sub-optimal nominal risk below
766.0.
On
a broader scale, the daily log scale chart above shows the developing potential
for a bearish divergence in daily momentum that will be considered confirmed
below 851.5. This chart also shows the past month's recovery thus far
stalling in the immediate neighborhood of the (888.0) Fibonacci
minimum 38.2% retrace of Apr-Sep's entire 1128 - 766 decline). COMBINED
with a failure below 851.5, traders
would then need to be concerned with at least a larger-degree correction pf the
past month's rally and possibly a resumption of Apr-Sep's major downtrend.
Until
and unless the market fails below 851.5 however, we would
remind longer-term players of the key elements on which our bullish count is
predicated:
a confirmed bullish divergence in WEEKLY momentum
(below)
amidst
an
historically low 11% reading in out RJO Bullish Sentiment Index and
a
textbook complete and major 5-wave Elliott sequence down from 29-Apr's
1128 high to 08-Sep's 766.0 low.
Thus
far, the market is only a month into correcting a 4-MONTH, 32% drawdown, so
further and possibly protracted gains remain well within the bounds of a major
(suspected 2nd-Wave) correction of Apr-Sep's decline within an even more
massive PEAK/reversal process from 17-May's 1219 high on an active continuation
basis below.
These
issues considered, a bullish policy and exposure remain advised with a failure
below 851.5 required to defer or threaten this call enough to warrant moving to
a neutral/sideline position. In lieu of such weakness, we anticipate a
continuation of the past month's rally to new highs and potentially significant
gains above 891.0.
Agricultural - Grains - Corn Breakout on Weekly Chart
Grains - Corn Breakout on Weekly Chart
By: Michael Sabo, Senior Market StrategistPosted Oct 1, 2021 11:13AM CT
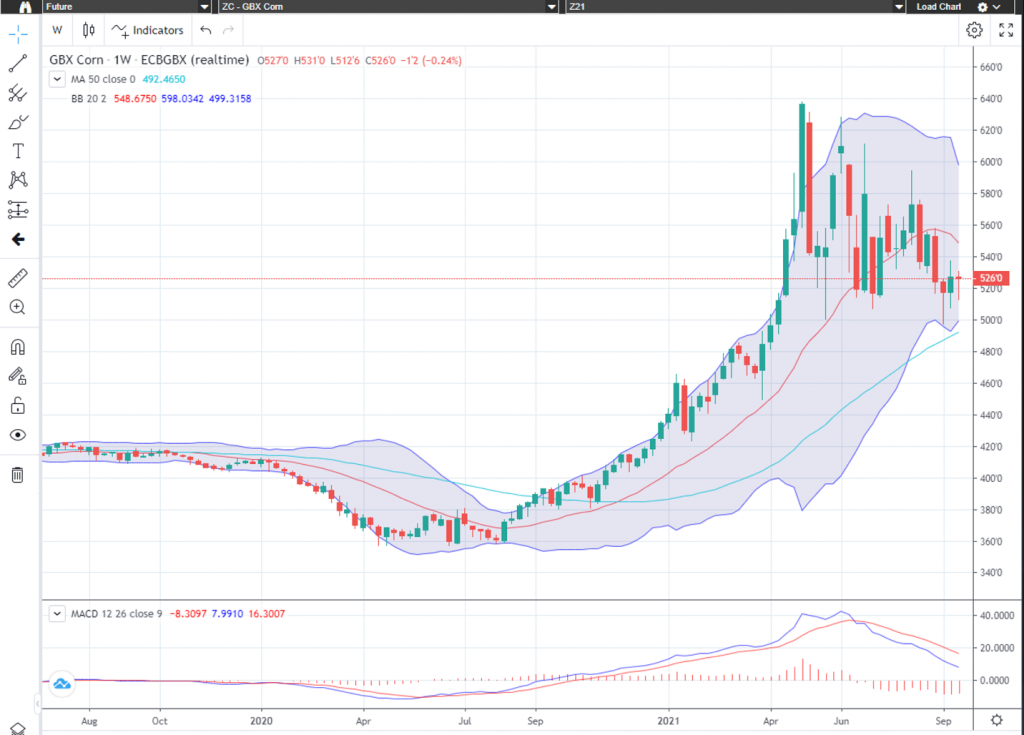
In last week’s Grain Insight article,
I advised traders on the following “Below is a weekly December corn chart,
as one can see, this week December corn is trading inside last weeks price
range. If it closes out the week this
way (and I think it will) next week’s key short-term numbers to watch will be
$5.38 ½ on the upside and $5.06 ½ on the downside. I would recommend traders
take their cue from the breakout.” We
got exactly that, a breakout on the weekly chart to the upside (see below)
which suggests to me further upside. Yesterday’s Grain Stocks Report was inside
expectations, leaning slightly bearish but not enough to damage the bullish
chart pattern. For now, I think traders should remain cautiously bullish.
These numbers still remain the same
for now - Watch December corn at $4.96 on the downside vs $4.99 and $6.39 ½ on
the upside – basically a breakout on the May monthly chart. There are several minor
areas of support and resistance inside that range that can help with short term
market direction if violated as I mentioned above. Call me at 1-800-367-7290
for more in-depth discussion on these numbers.
I would suggest using an option strategy to manage your futures position risk or an outright option strategy. Implied option volatility recently came down but is still relatively high compared to historical vol levels. You may want to incorporate some short options into your strategy in a calculated risk manner such as bull or bear option spreads. I have 25 years of grain market experience, please feel free to call me at 1-800-367-7290 for more details or to discuss in depth trading strategies. Also be sure to check out my past weekly grain market updates posted on our website.
Corn Sep '21 Daily Chart If you have any questions or would like to discuss the markets further, please feel free to contact me at 800-367-7290 or msabo@rjofutures.com. Interest Rates - Volatility in Interest Rates
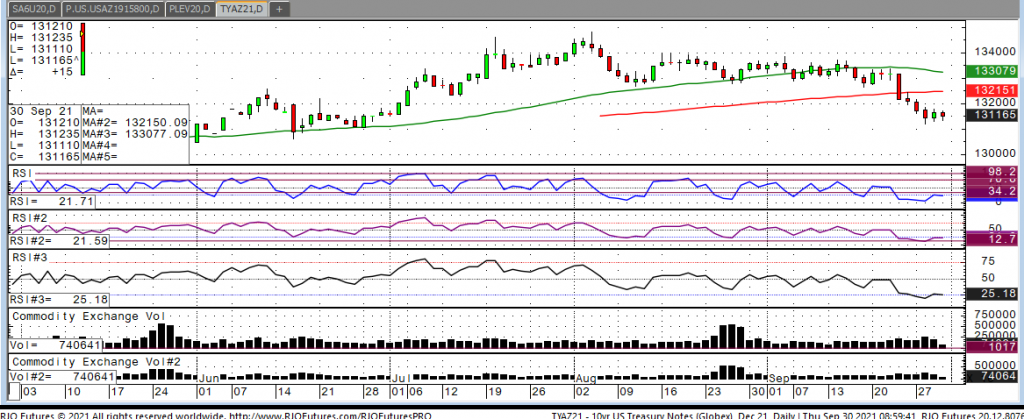
Volatility is starting to pick up the treasury complex, overnight, we saw a high in the December 10-year note of 131-235 and a low of 131-11 and currently we are trading at 131-135. The theme of the last week has seen the note breakout to the downside and yields, which move inversely to price, follow suit making new highs for move. What we have been seeing here is the ongoing talk of the Fed possibly begin to taper. What that means is that the Fed has been buying bonds monthly since the beginning of the pandemic to keep rates artificially low to make borrowing cheaper. Unfortunately, while doing this, even as the economy has performed, the market has been sniffing out inflation. All one has to do is go to their local grocery store and gas station to see increases in both. Grain and meat products have gone up substantially and it is starting to hurt the medium and lower the class. As prices continue to skyrocket, some can’t afford to buy their wants and needs. All along, Fed Chair Powell has said he believes the rapid move in inflation is “transitory”, meaning it should subside soon. Unfortunately for most people the market has lost faith in this believe as higher prices for consumers does not look to slow down anytime soon and the Fed might be forced to hike rates much earlier than expected.
10-Yr Note Dec '21 Daily Chart If you have any questions or would like to discuss the markets further, please feel free to contact me at 800-826-2270 or gperlin@rjofutures.com. Equity - Stocks Mixed to Kick Off Q4
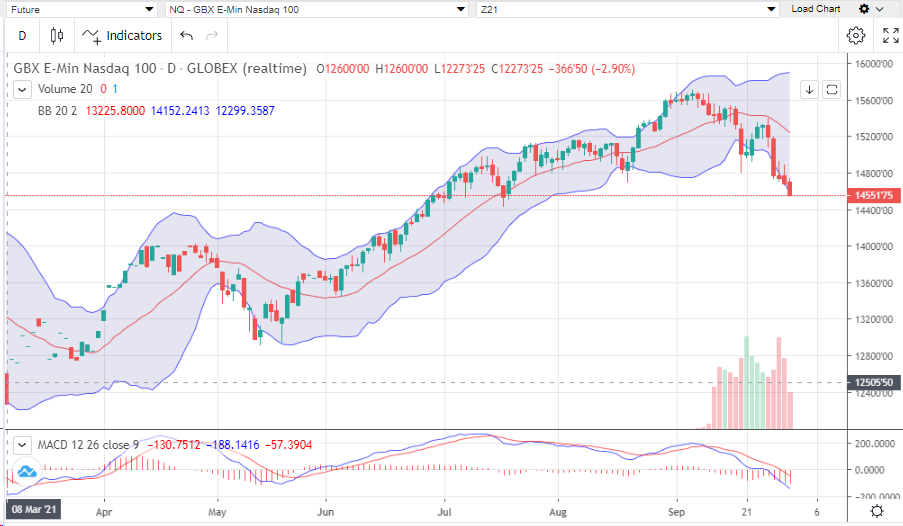
Stocks Mixed to Kick Off Q4
By: Bill Dixon, Senior Market StrategistPosted Oct 1, 2021 9:50AM CT
Global equities were lower
overnight, and domestic markets seem to be struggling to hold onto some signs
of strength early in the day. All four
indices have made new lows for the week.
Rising yields have been hammering tech stocks, and the Nasdaq is now off
it’s all-time high by a bit over seven percent.
In addition to yields, supply chain issues are piling up, and the
forecasted timelines for them to get straightened out are not encouraging. A more hawkish Fed has the dollar rallying,
Chinese crackdowns, debt ceiling issues (likely just political theater for now)
persist, and what’s looking to be a rough road to passage on the next
infrastructure bill have also managed to pump the brakes on what’s been a tremendous
rally.
While there’s a fair share of doom and gloom out there, the Nasdaq is still up thirteen percent on the year following this drop. Many medical professionals are suggesting Delta has peaked, and there was tremendous news from Merck and Ridgeback Biotherapeutics. Evidently they’ve developed a pill that has greatly reduced symptoms and death amongst the high risk population when administered shortly after showing symptoms.
E-mini S&P 500 Daily Chart If you have any questions or would like to discuss the markets further, please feel free to contact me at 800-669-5354 or bdixon@rjofutures.com. Economy - S-T Mo Failure Insufficient to End RBOB Correction, But Beware
S-T Mo Failure Insufficient to End RBOB Correction, But Beware
By: RJO Market InsightsPosted 11/08/2022
Posted on Nov 08, 2022, 07:51 by Dave Toth
In Fri's Technical Webcast we identified a
minor corrective low at 2.6328 from Thur as a mini risk parameter the market
needed to sustain gains above to maintain a more immediate bullish count.
The 240-min chart below shows the market's failure overnight below this level,
confirming a bearish divergence in very short-term momentum. This mo
failure defines Fri's 2.8172 high as
one of developing importance and a parameter from which very short-term traders
can objectively base non-bullish decisions like long-covers.
Given
the magnitude of the past three weeks' broader recovery however, this
short-term momentum failure is of an insufficient scale to conclude anything
more than another correction within this broader recovery from 26-Sep's 2.1877
low. Indeed, overnights failure below 2.6328 only allows us to conclude
the end of the portion of the month-and-a-half rally from 31-Oct's 2.4822 next
larger-degree corrective low. 2.4822 is the
risk parameter this market still needs to fail below to break the uptrend from
18-Oct's 2.3526 low while this 2.3526 low
remains intact as the risk parameter this market needs to fail below to break
the month-and-a-half uptrend. From an
intermediate-to-longer-term perspective, this week's setback falls well within
the bounds of another correction ahead of further gains. This is another
excellent example of the importance of technical and trading SCALE and
understanding and matching directional risk exposure to one's personal risk
profile.
The
reason overnight's admittedly minor mo failure might have longer-term
importance is the 2.8172-area from which it stemmed. In
Fri's Technical Blog we also noted the market's engagement of the
2.8076-to-2.8159-area marked by the 61.8% retrace of Jun0-Sewp's 3.2758 -2.1877
decline and the 1.000 progression of Sep-Oct's initial 2.1877 - 2.6185
(suspected a-Wave) rally from 18-Oct's 2.3526 (suspected b-Wave) low. We
remind longer-term players that because of the unique and compelling confluence
of:
early-Aug's bearish divergence in WEEKLY momentum
amidst
historically
extreme bullish sentiment/contrary opinion levels in our RJO Bullish
Sentiment Index
an
arguably complete and massive 5-wave Elliott sequence from Mar'20's 0.4605
low to Jun's 4.3260 high (as labeled in the weekly log active-continuation
chart below) and
the
5-wave impulsive sub-division of Jun-Sep's (suspected initial 1st-Wave) decline
The
recovery attempt from 26-Sep's 2.1877 low is arguably only a 3-wave (Wave-2)
corrective rebuttal to Jun-Sep's decline within a massive, multi-quarter
PEAK/reversal process. Now granted, due to the magnitude of 2020 -2022's
secular bull market, we discussed the prospect for this (2nd-Wave corrective)
recovery to be "extensive" in terms of both price and time. A
"more extensive" correction is typified by a retracement of 61.8% or
more and spanning weeks or even months following a 3-month decline. Per
such, the (suspected corrective) recovery from 26-Sep's 2.1877 low could easily
have further to go, with commensurately larger-degree weakness than that
exhibited this week (i.e., a failure below at least 2.4822) required
to consider the correction complete. Indeed, the daily log chart above
shows the market thus far respecting former 2.6185-area resistance from 10-Oct
as a new support candidate.
These
issues considered, very shorter-term traders have been advised to move to a neutral/sideline
position following overnight's momentum failure below 2.6328, with a recovery
above 2.8172 required to negate this call, reaffirm the recovery and re-expose
potentially significant gains thereafter. For intermediate- and
longer-term players, a bullish policy and exposure remain advised with a
failure below 2.4822 required to threaten this call enough to warrant
neutralizing exposure. We will be watchful for another bearish divergence
in momentum following a recovery attempt that falls short of Fri's 2.8172 high
that would be considered the next reinforcing factor to a count calling that
2.8172 high the prospective end to the month-and-a-half 2nd-Wave
correction. In lieu of such, a resumption of the current rally to
eventual new highs above 2.8172 should not surprise.
Economy - Futures Market Outlook w/John Caruso - 09/30/2021
Futures Market Outlook w/John Caruso - 09/30/2021
By: John Caruso, Senior Market StrategistPosted Sep 30, 2021 2:21PM CT
John Caruso takes a look into what's happening in the markets today as we have somewhat of a hectic close to Q3. If you have any questions or would like to discuss the markets further, please feel free to contact me at 800-669-5354 or jcaruso@rjofutures.com.