Technical analysis and trading strategy applicable to these markets
New Special Report: Inflation, How Much is Too Much?
With so much money in the market, coupled with weakened supply chains and workforces due to the fallout of Covid-19, we are seeing a rampant run on inflation. Prices from everything to lumber, oil, and groceries are up. Learn why this is happening, how long it will go on for, and how to protect yourself with this Special Report!
The Markets
Metals - Gold on Pace for Best Week Since August
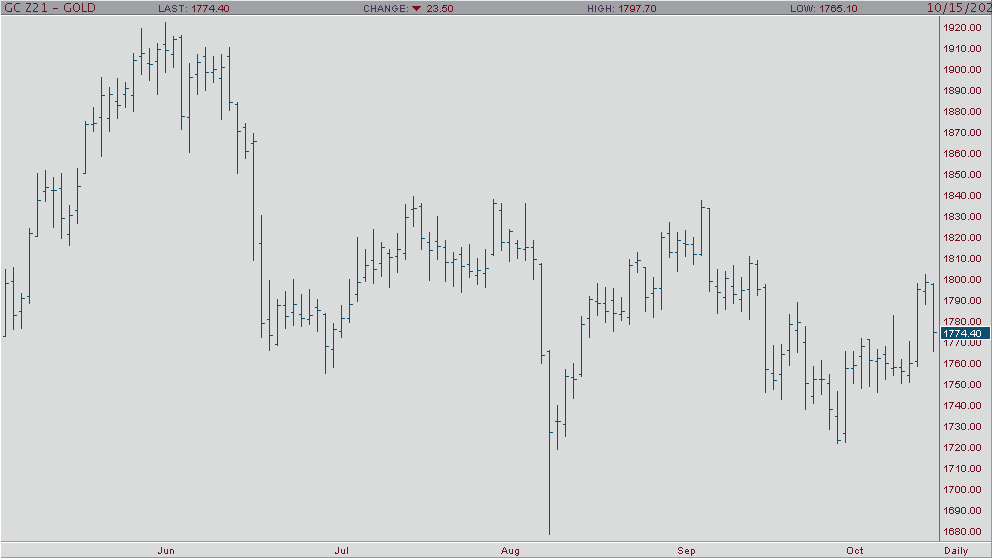
Gold on Pace for Best Week Since August
By: RJOF Editorial TeamPosted 10/15/2021
Gold futures have fallen early this morning as we saw treasury yields rise and it’s threatening to halt a 3 consecutive session rise. However, gold is still on pace to have its best week in nearly 5-months. December gold is currently trading at $1772.30 at the time of this writing, about $28 off the recent highwater mark of about $1800. All-in-all December gold is still on pace to make a 1% gain on the week, so gold bulls can’t be too upset. Analysts attest that the recent run in gold has been partially fueled by the diminished value of the dollar as the market is flooded with money coupled with the Fed holding interest rates artificially low. This could change soon though as the Fed has signaled they will taper their bond buying in the coming months. Keep an eye on gold today and the coming weeks and check back for more updates.
Gold Dec '21 Daily ChartEnergy - Crude Oil Still Surging
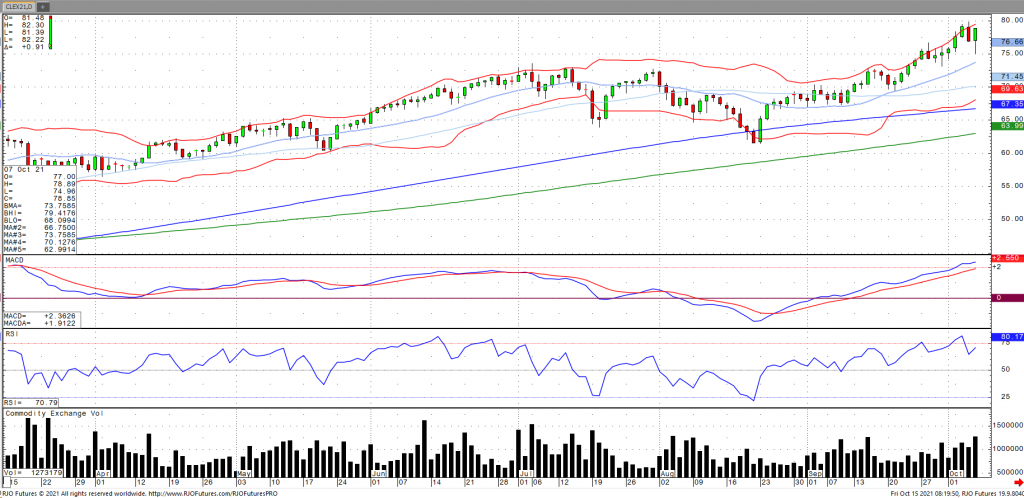
Crude Oil Still Surging
By: Alex Turro, Senior Market StrategistPosted Oct 15, 2021 8:47AM CT
Oil prices continued to inflate higher as of Friday morning and are set to for a weekly gain of more than 2% on increasing signs of tightening supply. This comes as OPEC+ dismissed the notion of additional supply coming online coupled with the IEA noting that increasingly higher gas prices could boost oil demand with their expectation that oil demand is set to jump half million barrels per day (bpd), which would result in a supply crunch of around 700k bpd through the end of the year. The IEA noted in its monthly report that oil demand is forecasted to increase by 210,00 bpd in 2022 and oil demand to reach 99.6 million bpd. This comes as weekly US crude stocks rose by 6.088mb, much greater than the expected 702k barrels. Contributing to the build was a slowdown in refinery utilization (-2.9%) and refinery input (-684bpd). Oil volatility (OVX) continues to breakdown to cycle lows with the market remaining bullish trend with today’s range seen between 76.29 – 83.24.
Crude Oil Nov '21 Daily Chart If you have any questions or would like to discuss the markets further, please feel free to contact me at 800-438-4805 or aturro@rjofutures.com. Softs - Coffee Continues to Grind Higher, In A Position to Test Old Highs
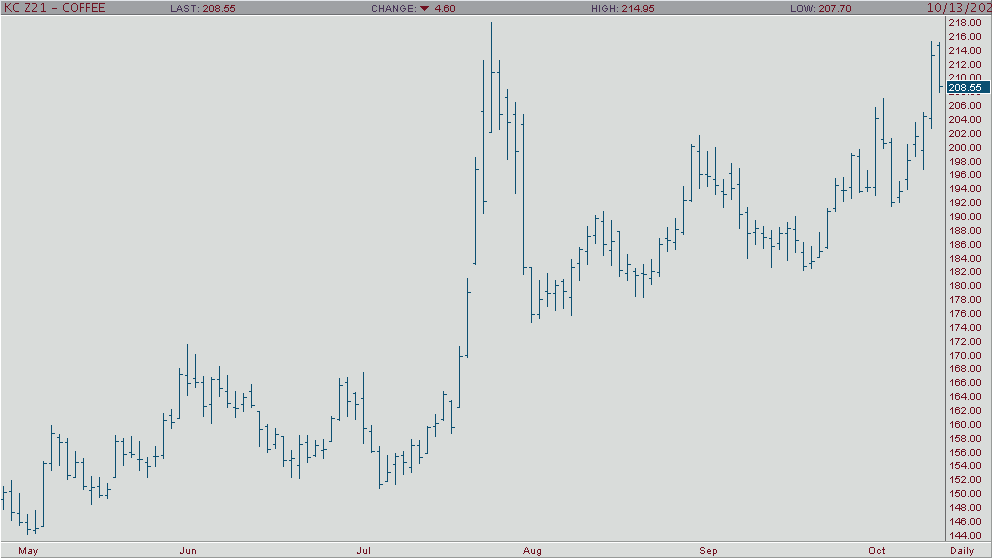
Coffee Continues to Grind Higher, In A Position to Test Old Highs
By: Tony Cholly, Senior Market StrategistPosted Oct 13, 2021 8:36AM CT
Coffee prices have jumped more than 10% over the span of one week, as supply-side developments both near and longer term have fueled this rally. Although the coffee market is beginning to reach overbought levels, it looks to have much more upside left to go before this rally runs out of steam. Brazil could see crops negatively impacted by extensive drought conditions and frosts during July. Reports that farmers may default on over one million bags in deliveries have also ramped up near term supply anxiety. These supply issues are exacerbated by the global shipping container shortage that continues to fuel coffee’s longer-term uptrend. Rising overbought levels warrant some caution for bullish traders. A positive signal for trend short-term was given on a close over the 9-bar moving average. There could be more upside follow through. Resistance comes in at 21940 and 22355. Support comes in at 20685 and 19845.
Coffee Dec '21 Daily Chart If you have any questions or would like to discuss the markets further, please feel free to contact me at 800-826-2270 or tcholly@rjofutures.com. Agricultural - Bullish Canola Count Intact Above Minimum 851.5
Bullish Canola Count Intact Above Minimum 851.5
By: RJO Market InsightsPosted 10/14/2022
Posted on Oct 14, 2022, 07:42 by Dave Toth
On
the heels of mid-Sep-to-early-Oct's steeper, accelerated, 3rd-wave-looking
recovery, the past week-and-a-half's boringly lateral chop is first considered
a corrective/consolidative event that warns of a continuation of the uptrend
that preceded it to new highs above 04-Oct's 891.0 high. This count
remains consistent with our broader base/correction/recovery count introduced
in 13-Sep's Technical Blog following that
day's bullish divergence in short-term momentum above 07-Sep's 809.5 minor
corrective high detailed in the hourly chart below.
The
important takeaway from this month's lateral, sleepy price action is the
definition of Wed's 851.5 low as
the end or lower boundary of a suspected 4th-Wave correction. A failure
below 851.5 will confirm a bearish divergence in daily momentum and defer or
threaten a bullish count enough to warrant non-bullish decisions like
long-covers. A failure below 851.5 will not
necessarily negate a broader bullish count, but it will threaten it enough to
warrant defensive measures as the next pertinent technical levels below 851.5 are
13-Sep's prospective minor 1st-Wave high at 813.8 and obviously 08-Sep's 766.0
low. And making non-bullish decisions "down there" is
sub-optimal to say the least. Per such, both short- and longer-term
commercial traders are advised to pare or neutralize bullish exposure on a
failure below 851.5, acknowledging and accepting whipsaw risk- back above 04-Oct's
891.0 high- in exchange for much deeper and sub-optimal nominal risk below
766.0.
On
a broader scale, the daily log scale chart above shows the developing potential
for a bearish divergence in daily momentum that will be considered confirmed
below 851.5. This chart also shows the past month's recovery thus far
stalling in the immediate neighborhood of the (888.0) Fibonacci
minimum 38.2% retrace of Apr-Sep's entire 1128 - 766 decline). COMBINED
with a failure below 851.5, traders
would then need to be concerned with at least a larger-degree correction pf the
past month's rally and possibly a resumption of Apr-Sep's major downtrend.
Until
and unless the market fails below 851.5 however, we would
remind longer-term players of the key elements on which our bullish count is
predicated:
a confirmed bullish divergence in WEEKLY momentum
(below)
amidst
an
historically low 11% reading in out RJO Bullish Sentiment Index and
a
textbook complete and major 5-wave Elliott sequence down from 29-Apr's
1128 high to 08-Sep's 766.0 low.
Thus
far, the market is only a month into correcting a 4-MONTH, 32% drawdown, so
further and possibly protracted gains remain well within the bounds of a major
(suspected 2nd-Wave) correction of Apr-Sep's decline within an even more
massive PEAK/reversal process from 17-May's 1219 high on an active continuation
basis below.
These
issues considered, a bullish policy and exposure remain advised with a failure
below 851.5 required to defer or threaten this call enough to warrant moving to
a neutral/sideline position. In lieu of such weakness, we anticipate a
continuation of the past month's rally to new highs and potentially significant
gains above 891.0.
Agricultural - Grains - Corn Breakout This Week
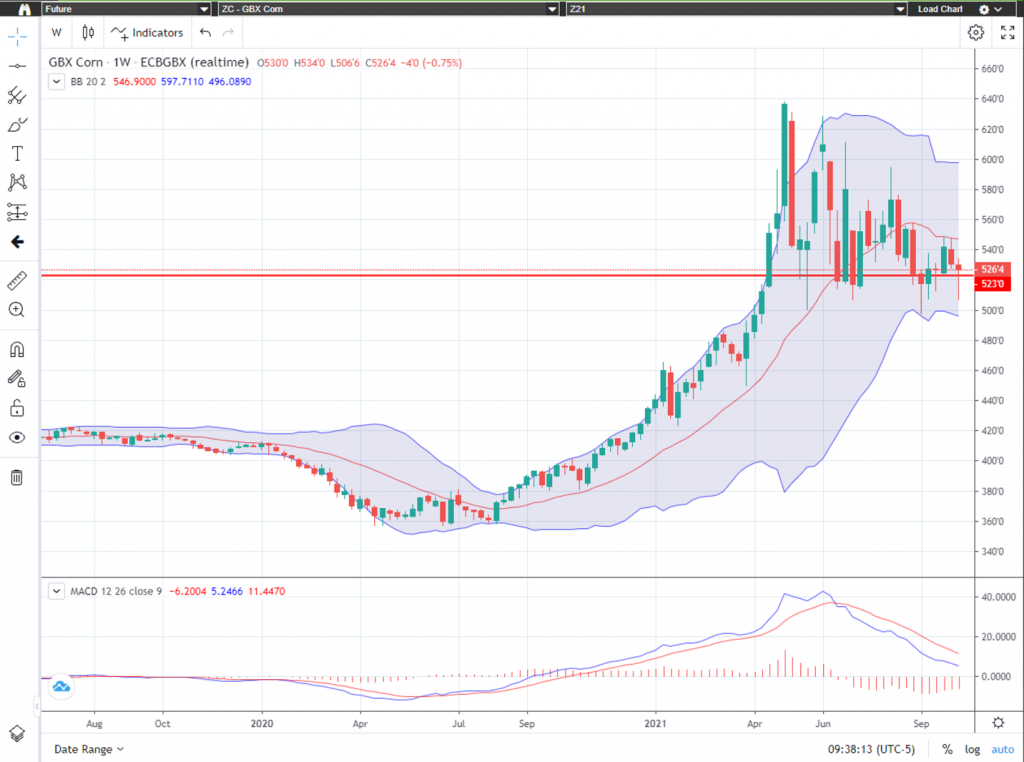
Grains - Corn Breakout This Week
By: Michael Sabo, Senior Market StrategistPosted Oct 15, 2021 9:54AM CT
Last week I advised traders on
the following “This week is showing us another inside week setup. Traders should watch for a break above $5.49
or a break below $5.23, basically last week’s range.” Sure enough, the
market broke through $5.23 and made a weekly low of $5.06 ¾ before reversing.
At the time of this writing, December corn is trading around $5.26 ¼ with a
weekly high of $5.34. It appears the market still has strong support around the
$5.00 area. If we see corn close in the upper 1/3 of the daily trading range we
may see some follow through to the upside early next week. The USDA Supply
Demand and Crop Production Reports that were released on Tuesday were inside
the range of estimates but leaned slightly bearish. I still remain cautiously
bullish even with the same pullback we saw this week. In my opinion to really
get the bulls excited we would need to see December corn trade up above $5.49.
The “big picture” numbers remain the
same and probably will for some time. I firmly believe a break below $4.96 could
give the bears control of the market and a break above $6.39 ½ on the upside may
have enough bulls behind it to propel corn to all-time highs. There are several
minor areas of support and resistance inside this range that can help with
short term market direction if violated. Call me directly at 1-800-367-7290 for
more in-depth discussion on these numbers and to discuss trading strategies
specific to your situation.
I would suggest using an option
strategy to manage your futures position risk or an outright option strategy.
Implied option volatility has come down quite a bit from its most recent highs
mainly due to the consolidation and tighter trading ranges. I have 25 years of grain
market experience, feel free to call or email with any questions you may have. Be sure to check out my archived weekly grain
market insight articles posted on our website.
**** Reserve your FREE 2022 Commodity Trading Guide Today! ****
This 55-page guide is packed with indispensable market information. It has a complete commodity calendar that lists the dates and times of Market Reports, option expiration dates, futures first notice dates, futures last trade dates, etc. It readily serves as your commodity market encyclopedia giving you an in depth look at each commodity, there is market almanac for all actively traded commodities and much more! To reserve your complimentary Commodity Trading Guide, send me an email at msabo@rjofutures.com with the following information: your full name, mailing address and a preferred phone number so we can confirm your request. Once confirmed, I will reserve your trading guide, and have it sent out as soon as we receive them.
Corn Dec '21 Daily Chart If you have any questions or would like to discuss the markets further, please feel free to contact me at 800-367-7290 or msabo@rjofutures.com. Interest Rates - Treasuries Trending Down
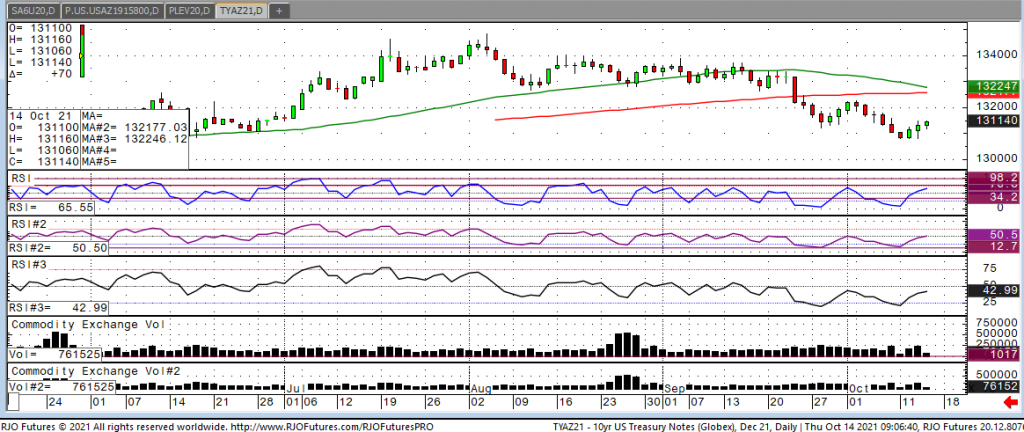
Looking at the December 10-year note, overnight we had a high of 131-160 and a low of 131-06 and currently trading 131-12. This morning we had PPI, which came out a tad weaker than expected which has given the note a mild boost in early trading. The trend is down in treasuries with a “sell the rally” mentality firmly in place as inflation continues to creep higher with crude reaching 81.68 overnight and natural gas currently up 21-cents as we speak. This week we have seen many fed speakers come on tape and suggest that the Fed should start to taper as early as November which should keep a lid on prices for the remainder of the week. The continued talking of tapering is the Fed slowing down the purchases of bonds which has been going on since the pandemic in early 2020. The Feds continued the buying of bonds which is keeping rates artificially low, creating a bubble that is ready to burst. Being able to pick the exact time is impossible but the fed has created a monster and I believe has cornered itself while inflation related commodities have skyrocketed. It’s not a good position as investors have seen the yield on treasuries jump om the last two weeks, so I would encourage traders to be on guard as more fed officials express their desire to begin to taper.
10-Year Note Daily Chart If you have any questions or would like to discuss the markets further, please feel free to contact me at 800-826-2270 or gperlin@rjofutures.com. Equity - Stocks Continue to Rally
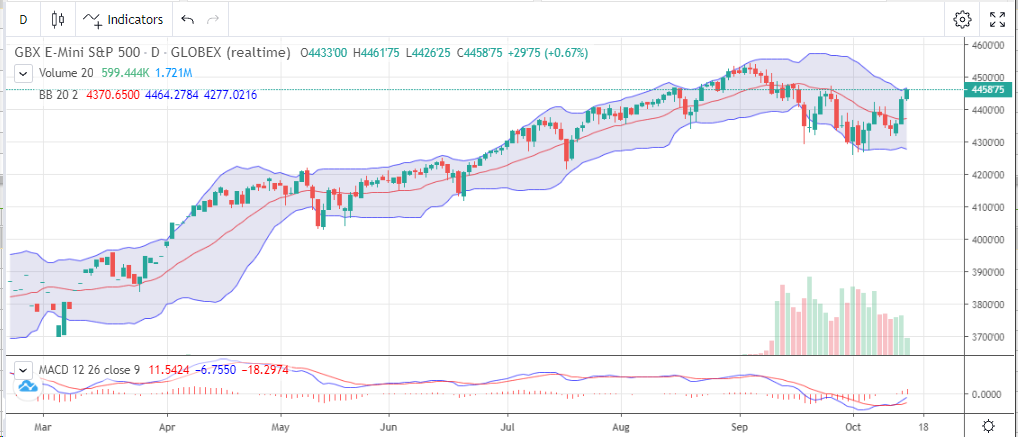
Stocks Continue to Rally
By: Bill Dixon, Senior Market StrategistPosted Oct 15, 2021 10:25AM CT
The markets are higher for the third day in a row as we get
ready to call it a week. Inflation is
back in the news, and it appears that it is trending more so than it is
transitory. Retail sales clocked in at
the higher end of the expectations (0.7%) M/M despite labor shortages, material
shortages, and supply chain disruptions driving prices higher (.04% M/M and
5.4% Y/Y). While there is hope for the
labor side of things given the expiration of benefits for many, it seems as
though it will be a while before things are anywhere near back to normal.
Earnings season is back in full swing. Thus far, results have been positive with most of those reporting beating analysts’ estimates. Despite some of the obvious headwinds that persisted through the last quarter, the consumer remained quite active. I would expect strong earnings to continue to be released as a result. However, consumer sentiment came in this morning at a mere 71.4. That is the worst reading since 2011 as consumers are starting to show signs of concern over inflation.
E-mini S&P 500 Daily Chart If you have any questions or would like to discuss the markets further, please feel free to contact me at 800-669-5354 or bdixon@rjofutures.com. Economy - S-T Mo Failure Insufficient to End RBOB Correction, But Beware
S-T Mo Failure Insufficient to End RBOB Correction, But Beware
By: RJO Market InsightsPosted 11/08/2022
Posted on Nov 08, 2022, 07:51 by Dave Toth
In Fri's Technical Webcast we identified a
minor corrective low at 2.6328 from Thur as a mini risk parameter the market
needed to sustain gains above to maintain a more immediate bullish count.
The 240-min chart below shows the market's failure overnight below this level,
confirming a bearish divergence in very short-term momentum. This mo
failure defines Fri's 2.8172 high as
one of developing importance and a parameter from which very short-term traders
can objectively base non-bullish decisions like long-covers.
Given
the magnitude of the past three weeks' broader recovery however, this
short-term momentum failure is of an insufficient scale to conclude anything
more than another correction within this broader recovery from 26-Sep's 2.1877
low. Indeed, overnights failure below 2.6328 only allows us to conclude
the end of the portion of the month-and-a-half rally from 31-Oct's 2.4822 next
larger-degree corrective low. 2.4822 is the
risk parameter this market still needs to fail below to break the uptrend from
18-Oct's 2.3526 low while this 2.3526 low
remains intact as the risk parameter this market needs to fail below to break
the month-and-a-half uptrend. From an
intermediate-to-longer-term perspective, this week's setback falls well within
the bounds of another correction ahead of further gains. This is another
excellent example of the importance of technical and trading SCALE and
understanding and matching directional risk exposure to one's personal risk
profile.
The
reason overnight's admittedly minor mo failure might have longer-term
importance is the 2.8172-area from which it stemmed. In
Fri's Technical Blog we also noted the market's engagement of the
2.8076-to-2.8159-area marked by the 61.8% retrace of Jun0-Sewp's 3.2758 -2.1877
decline and the 1.000 progression of Sep-Oct's initial 2.1877 - 2.6185
(suspected a-Wave) rally from 18-Oct's 2.3526 (suspected b-Wave) low. We
remind longer-term players that because of the unique and compelling confluence
of:
early-Aug's bearish divergence in WEEKLY momentum
amidst
historically
extreme bullish sentiment/contrary opinion levels in our RJO Bullish
Sentiment Index
an
arguably complete and massive 5-wave Elliott sequence from Mar'20's 0.4605
low to Jun's 4.3260 high (as labeled in the weekly log active-continuation
chart below) and
the
5-wave impulsive sub-division of Jun-Sep's (suspected initial 1st-Wave) decline
The
recovery attempt from 26-Sep's 2.1877 low is arguably only a 3-wave (Wave-2)
corrective rebuttal to Jun-Sep's decline within a massive, multi-quarter
PEAK/reversal process. Now granted, due to the magnitude of 2020 -2022's
secular bull market, we discussed the prospect for this (2nd-Wave corrective)
recovery to be "extensive" in terms of both price and time. A
"more extensive" correction is typified by a retracement of 61.8% or
more and spanning weeks or even months following a 3-month decline. Per
such, the (suspected corrective) recovery from 26-Sep's 2.1877 low could easily
have further to go, with commensurately larger-degree weakness than that
exhibited this week (i.e., a failure below at least 2.4822) required
to consider the correction complete. Indeed, the daily log chart above
shows the market thus far respecting former 2.6185-area resistance from 10-Oct
as a new support candidate.
These
issues considered, very shorter-term traders have been advised to move to a neutral/sideline
position following overnight's momentum failure below 2.6328, with a recovery
above 2.8172 required to negate this call, reaffirm the recovery and re-expose
potentially significant gains thereafter. For intermediate- and
longer-term players, a bullish policy and exposure remain advised with a
failure below 2.4822 required to threaten this call enough to warrant
neutralizing exposure. We will be watchful for another bearish divergence
in momentum following a recovery attempt that falls short of Fri's 2.8172 high
that would be considered the next reinforcing factor to a count calling that
2.8172 high the prospective end to the month-and-a-half 2nd-Wave
correction. In lieu of such, a resumption of the current rally to
eventual new highs above 2.8172 should not surprise.
Economy - Futures Market Outlook w/John Caruso - 10/14/2021
Futures Market Outlook w/John Caruso - 10/14/2021
By: John Caruso, Senior Market StrategistPosted Oct 14, 2021 8:40AM CT
After seeing a rather soft PPI number and a jobless claims number that has fallen below 300k we are seeing a pretty strong rally in the equities. It will be interesting to see how the day plays out. If you have any questions or would like to discuss the markets further, please feel free to contact me at 800-669-5354 or jcaruso@rjofutures.com.