Looking to diversify your investment portfolio with futures trading, but lack the expertise on your own? Trading Systems and their programs are now listed on our website complete with track records, products traded and minimum account requirements and fees. If you need help navigating the site and viewing the results, give us a call.
New: Micro Bitcoin Investor Kit
Bitcoin is on an unprecedented run and is at the forefront of the trend in cryptocurrency and as a response, the CME has released a micro Bitcoin futures contract that is 1/10th the size of a regular Bitcoin futures contract. Learn everything you need to trade the micro Bitcoin futures contract with this Investor Kit!
The Markets
Metals - Gold in Technical Recovery
Gold in Technical Recovery
By: Frank J. Cholly, Senior Market StrategistPosted Nov 4, 2021 9:01AM CT
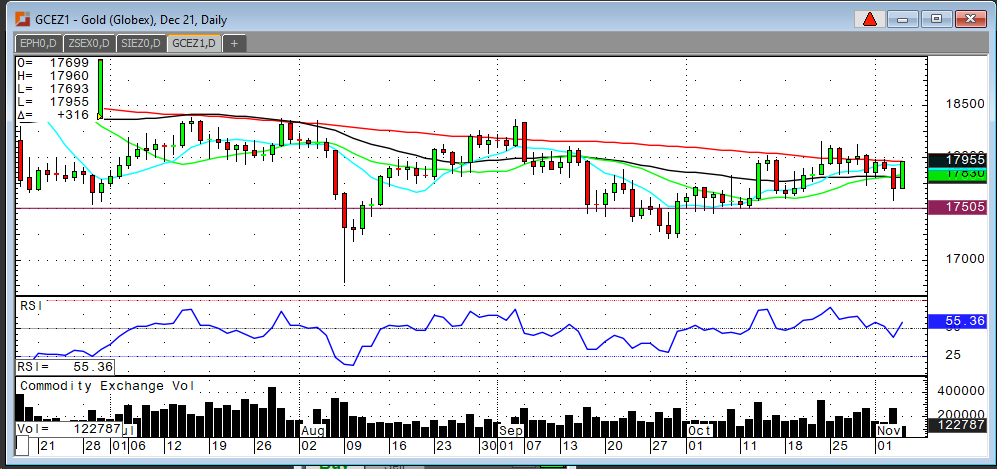
After yesterday’s sharp selloff in gold, today’s rally is most likely just a technical correction. If, however, December gold could manage a close above $1,796 that would bring in new longs. The gold market has been stuck in a big choppy sideways channel for so long now that it feels like it will never find direction. Every time it tries to breakout above it $1,800 it gets smacked back down, but also seems that gold is basing a long-term bottom in the $1,750 range. Until gold manages a breakout, up or down, there is a clear and tradeable range. I still favor an upside breakout due to all the idle cash out there and of course the longer lasting inflationary fears. Who still thinks inflation is “transitory”? Signs of real inflation are everywhere, and inflation is structural. Gold, in my opinion, can only move higher from this current range that it’s been marking time in. I think playing gold from the long side still makes the most sense. I’d rather buy dips than “short” rallies.
Gold Dec '21 Daily Chart If you have any questions or would like to discuss the markets further, please feel free to contact me at 800-826-4124 or fcholly@rjofutures.com. Metals - Silver Continues Shining
Silver Continues Shining
By: Eli Tesfaye, Senior Market StrategistPosted Nov 4, 2021 11:01AM CT
Silver is currently trading near a psychological level of $24.00. Given the current price structure, $20.00 silver will hold firm. As I said in previously, any pullback in price will be seen as a buying opportunity rather than selling. The Fed made it clear that they would start the tapering process. Currently, there is a slow recovery process coming out of the pandemic, so the Fed is very cautious not to slow down recovery. Now, the economic recovery faces a supply logistics problem, and there isn't much the Fed can do about that. So, silver will continue to shine. Anything over $30.00 would probably be overpriced in the near term, and anything below $20.00 is way cheap. So short range that the market will stay in for the rest of the year.
From a technical perspective, as seen per the weekly chart price structure attached, near term lows are in. Call me or email me if you want to get involved in the current silver market.
Silver Weekly Chart If you have any questions or would like to discuss the markets further, please feel free to contact me at 800-367-7290 or etesfaye@rjofutures.com. Energy - Oil Eases at OPEC+ Agrees to Production Plan
Oil Eases at OPEC+ Agrees to Production Plan
By: Alex Turro, Senior Market StrategistPosted Nov 4, 2021 10:22AM CT
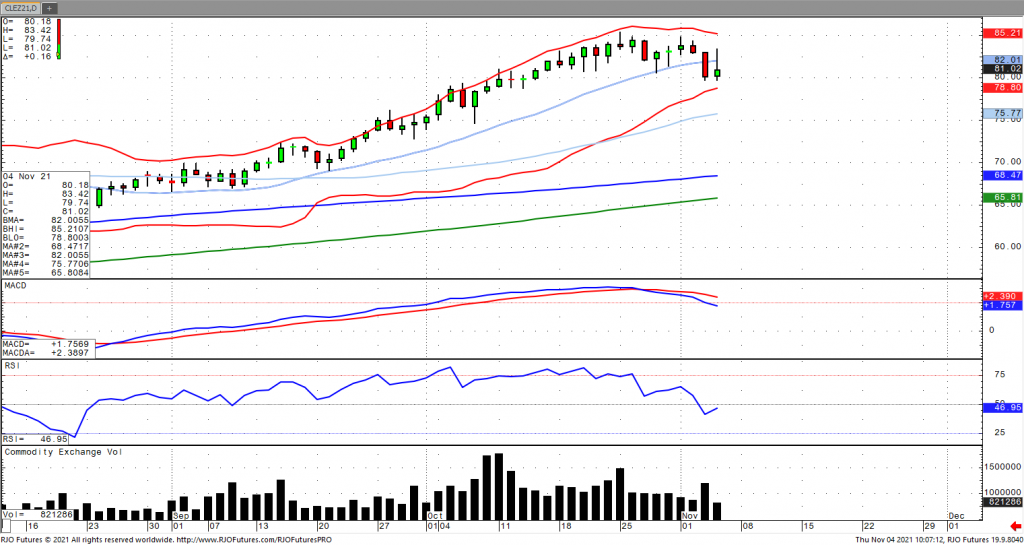
Oil prices ramped up more than 2% early Thursday as OPEC+ held onto output increases of 400k barrels per day despite outside calls and pressure from the United States to raise output. Japan and India had also joined efforts by the US in order to curb energy prices. Crude stocks increased 3.29 million barrels with stocks increasing 20.13 million barrels over the last 6 weeks. Stocks are now -50.32 million barrels below last year and 26.92 below the five-year average, according to the EIA. US refinery rate increased 1.20% and along with strong global demand for diesel continue to support. The market remains bullish trend with today’s range seen between 80.35 – 85.72.
Crude Oil Dec '21 Daily Chart If you have any questions or would like to discuss the markets further, please feel free to contact me at 800-438-4805 or aturro@rjofutures.com. Softs - Fed Tapering, Weak Demand, and Growing Supply - Cocoa Futures
Fed Tapering, Weak Demand, and Growing Supply - Cocoa Futures
By: Peter MoosesPosted 11/04/2021
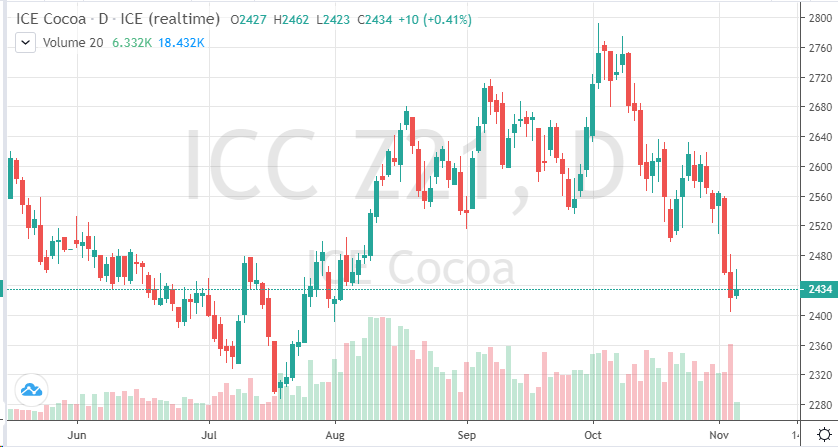
December
cocoa is attempting to find support. After the market found consolidation last
week, it broke lower the past few sessions. Technically, the market broke
support and moved to levels last seen in August. At that point on the chart,
cocoa saw a decent rally – will the same happen now?
The
fundamentals are similar – unknown demand for the rest of the year, will the
recent weather affect production levels and will the global economy pressure
commodities? Currently, there are a lot of unknowns.
Trader’s need to monitor the Fed tapering and how outside markets react. At the moment, this recent pullback could be a good buying opportunity for bulls looking to gain exposure. A not so far off target of 2600 is realistic in the near-term for December cocoa. Expect volatility as we approach contract expiration.
On
the heels of mid-Sep-to-early-Oct's steeper, accelerated, 3rd-wave-looking
recovery, the past week-and-a-half's boringly lateral chop is first considered
a corrective/consolidative event that warns of a continuation of the uptrend
that preceded it to new highs above 04-Oct's 891.0 high. This count
remains consistent with our broader base/correction/recovery count introduced
in 13-Sep's Technical Blog following that
day's bullish divergence in short-term momentum above 07-Sep's 809.5 minor
corrective high detailed in the hourly chart below.
The
important takeaway from this month's lateral, sleepy price action is the
definition of Wed's 851.5 low as
the end or lower boundary of a suspected 4th-Wave correction. A failure
below 851.5 will confirm a bearish divergence in daily momentum and defer or
threaten a bullish count enough to warrant non-bullish decisions like
long-covers. A failure below 851.5 will not
necessarily negate a broader bullish count, but it will threaten it enough to
warrant defensive measures as the next pertinent technical levels below 851.5 are
13-Sep's prospective minor 1st-Wave high at 813.8 and obviously 08-Sep's 766.0
low. And making non-bullish decisions "down there" is
sub-optimal to say the least. Per such, both short- and longer-term
commercial traders are advised to pare or neutralize bullish exposure on a
failure below 851.5, acknowledging and accepting whipsaw risk- back above 04-Oct's
891.0 high- in exchange for much deeper and sub-optimal nominal risk below
766.0.
On
a broader scale, the daily log scale chart above shows the developing potential
for a bearish divergence in daily momentum that will be considered confirmed
below 851.5. This chart also shows the past month's recovery thus far
stalling in the immediate neighborhood of the (888.0) Fibonacci
minimum 38.2% retrace of Apr-Sep's entire 1128 - 766 decline). COMBINED
with a failure below 851.5, traders
would then need to be concerned with at least a larger-degree correction pf the
past month's rally and possibly a resumption of Apr-Sep's major downtrend.
Until
and unless the market fails below 851.5 however, we would
remind longer-term players of the key elements on which our bullish count is
predicated:
a confirmed bullish divergence in WEEKLY momentum
(below)
amidst
an
historically low 11% reading in out RJO Bullish Sentiment Index and
a
textbook complete and major 5-wave Elliott sequence down from 29-Apr's
1128 high to 08-Sep's 766.0 low.
Thus
far, the market is only a month into correcting a 4-MONTH, 32% drawdown, so
further and possibly protracted gains remain well within the bounds of a major
(suspected 2nd-Wave) correction of Apr-Sep's decline within an even more
massive PEAK/reversal process from 17-May's 1219 high on an active continuation
basis below.
These
issues considered, a bullish policy and exposure remain advised with a failure
below 851.5 required to defer or threaten this call enough to warrant moving to
a neutral/sideline position. In lieu of such weakness, we anticipate a
continuation of the past month's rally to new highs and potentially significant
gains above 891.0.
Equity - Stocks Hold Near Record Highs
Stocks Hold Near Record Highs
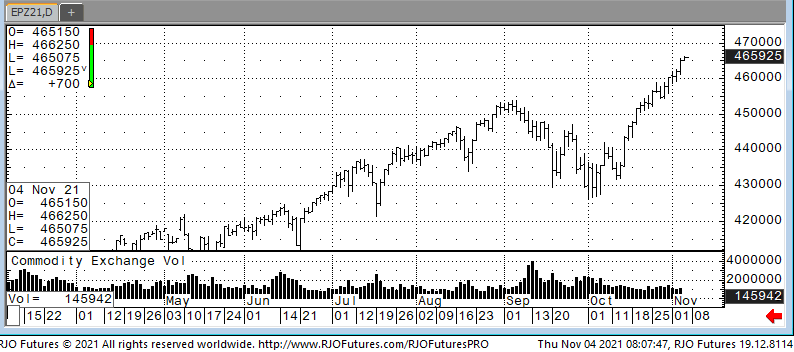
By: Jeff Yasak, Senior Market StrategistPosted Nov 4, 2021 9:05AM CT
This morning has stock futures mixed, holding close to record highs as investors digested the Federal reserve’s decision to taper some of their monetary policies as the economy continues to recover. Tech stocks were higher, and the Nasdaq led the way on the major indexes. With the Fed’s latest monetary policy decision and the stronger than expected quarterly corporate earnings released on Thursday the S&P 500, Dow and Nasdaq set intraday and closing highs once again. Not to anyone’s surprise the central bank announced that it would begin tapering its asset purchase program starting this month. The Federal Open Market Committee members decided that the economy had made “substantial further progress” in recovery paving the way for removal of policy support. The next month will see a reduction in $15 billion in asset purchases and another $15 billion in December but they have added flexibility with the uncertainty around inflation.
Support today is 462950 and 460000 with resistance at 467500 and 469000.
E-mini S&P 500 Daily Chart If you have any questions or would like to discuss the markets further, please feel free to contact me at 888-861-1656 or jyasak@rjofutures.com. Economy - S-T Mo Failure Insufficient to End RBOB Correction, But Beware
S-T Mo Failure Insufficient to End RBOB Correction, But Beware
By: RJO Market InsightsPosted 11/08/2022
Posted on Nov 08, 2022, 07:51 by Dave Toth
In Fri's Technical Webcast we identified a
minor corrective low at 2.6328 from Thur as a mini risk parameter the market
needed to sustain gains above to maintain a more immediate bullish count.
The 240-min chart below shows the market's failure overnight below this level,
confirming a bearish divergence in very short-term momentum. This mo
failure defines Fri's 2.8172 high as
one of developing importance and a parameter from which very short-term traders
can objectively base non-bullish decisions like long-covers.
Given
the magnitude of the past three weeks' broader recovery however, this
short-term momentum failure is of an insufficient scale to conclude anything
more than another correction within this broader recovery from 26-Sep's 2.1877
low. Indeed, overnights failure below 2.6328 only allows us to conclude
the end of the portion of the month-and-a-half rally from 31-Oct's 2.4822 next
larger-degree corrective low. 2.4822 is the
risk parameter this market still needs to fail below to break the uptrend from
18-Oct's 2.3526 low while this 2.3526 low
remains intact as the risk parameter this market needs to fail below to break
the month-and-a-half uptrend. From an
intermediate-to-longer-term perspective, this week's setback falls well within
the bounds of another correction ahead of further gains. This is another
excellent example of the importance of technical and trading SCALE and
understanding and matching directional risk exposure to one's personal risk
profile.
The
reason overnight's admittedly minor mo failure might have longer-term
importance is the 2.8172-area from which it stemmed. In
Fri's Technical Blog we also noted the market's engagement of the
2.8076-to-2.8159-area marked by the 61.8% retrace of Jun0-Sewp's 3.2758 -2.1877
decline and the 1.000 progression of Sep-Oct's initial 2.1877 - 2.6185
(suspected a-Wave) rally from 18-Oct's 2.3526 (suspected b-Wave) low. We
remind longer-term players that because of the unique and compelling confluence
of:
early-Aug's bearish divergence in WEEKLY momentum
amidst
historically
extreme bullish sentiment/contrary opinion levels in our RJO Bullish
Sentiment Index
an
arguably complete and massive 5-wave Elliott sequence from Mar'20's 0.4605
low to Jun's 4.3260 high (as labeled in the weekly log active-continuation
chart below) and
the
5-wave impulsive sub-division of Jun-Sep's (suspected initial 1st-Wave) decline
The
recovery attempt from 26-Sep's 2.1877 low is arguably only a 3-wave (Wave-2)
corrective rebuttal to Jun-Sep's decline within a massive, multi-quarter
PEAK/reversal process. Now granted, due to the magnitude of 2020 -2022's
secular bull market, we discussed the prospect for this (2nd-Wave corrective)
recovery to be "extensive" in terms of both price and time. A
"more extensive" correction is typified by a retracement of 61.8% or
more and spanning weeks or even months following a 3-month decline. Per
such, the (suspected corrective) recovery from 26-Sep's 2.1877 low could easily
have further to go, with commensurately larger-degree weakness than that
exhibited this week (i.e., a failure below at least 2.4822) required
to consider the correction complete. Indeed, the daily log chart above
shows the market thus far respecting former 2.6185-area resistance from 10-Oct
as a new support candidate.
These
issues considered, very shorter-term traders have been advised to move to a neutral/sideline
position following overnight's momentum failure below 2.6328, with a recovery
above 2.8172 required to negate this call, reaffirm the recovery and re-expose
potentially significant gains thereafter. For intermediate- and
longer-term players, a bullish policy and exposure remain advised with a
failure below 2.4822 required to threaten this call enough to warrant
neutralizing exposure. We will be watchful for another bearish divergence
in momentum following a recovery attempt that falls short of Fri's 2.8172 high
that would be considered the next reinforcing factor to a count calling that
2.8172 high the prospective end to the month-and-a-half 2nd-Wave
correction. In lieu of such, a resumption of the current rally to
eventual new highs above 2.8172 should not surprise.
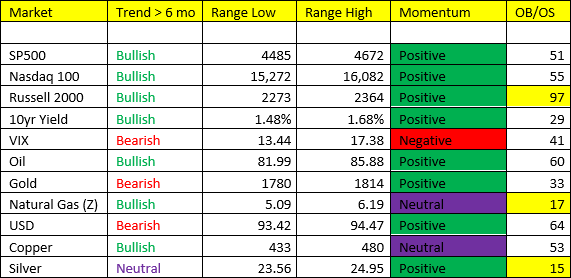
By: John Caruso, Senior Market StrategistPosted Nov 2, 2021 9:12AM CT
A massive rally yesterday in US Value with the Russell 2000
gaining +2.3%. Now signaling immediate OB, but on the brink of eclipsing
a new ATH. We did catch it with some of our core longs, but it’s my fault
we didn’t catch it “bigger”. We’ll likely have another look in coming
weeks we think from more favorable levels – or maybe not, we’ll see. The
SP500 also closed at a new ATH which I believe is its 60th All-time
CLOSING High of the year. Earnings remain solid, despite the
disappointments from Apple, Facebook, and Amazon. Aggregate SPY Sales
growth +17.69%, and EPS growth +38% with more than half of the Index having
reported.
*ISM MFG PMI slowed yesterday m/m but rose y/y to
60.8.
Today marks the beginning of the FOMCs 2 day policy
meeting. I think by now we all know what’s coming, and to be honest, it’s
overdue and much ado about nothing if you ask me.
*Copper catching a slight bid here, with the LME stocks
reporting another decline in inventories.
*Oil- can’t stop, won’t stop. Lower high in the range,
could mean a quick but shallow correction, but you certainly don’t play for
one. Path of least resistance remains UP, and every break in the market
has been a buying opportunity.
*USD/Gold – just a lot of chop in these 2 markets with no real sense of direction. I will certainly welcome another SELL opportunity in Gold if presented with one. Gold doesn’t look to be ready to move into a favorable period until out into next year/and may likely coincide with a cool down period in US Rates/a stronger USD as we head into very difficult y/y comparisons for macro data and corporate earnings in Q2/Q3 2022.
If you have any questions or would like to discuss the markets further, please feel free to contact me at 800-669-5354 or jcaruso@rjofutures.com.