Looking to diversify your investment portfolio with futures trading, but lack the expertise on your own? Trading Systems and their programs are now listed on our website complete with track records, products traded and minimum account requirements and fees. If you need help navigating the site and viewing the results, give us a call.
New Special Report: Inflation, How Much is Too Much?
With so much money in the market, coupled with weakened supply chains and workforces due to the fallout of Covid-19, we are seeing a rampant run on inflation. Prices from everything to lumber, oil, and groceries are up. Learn why this is happening, how long it will go on for, and how to protect yourself with this Special Report!
The Markets
Metals - Gold Set for Best Week Since November
Gold Set for Best Week Since November
By: RJOF Editorial TeamPosted 01/14/2022
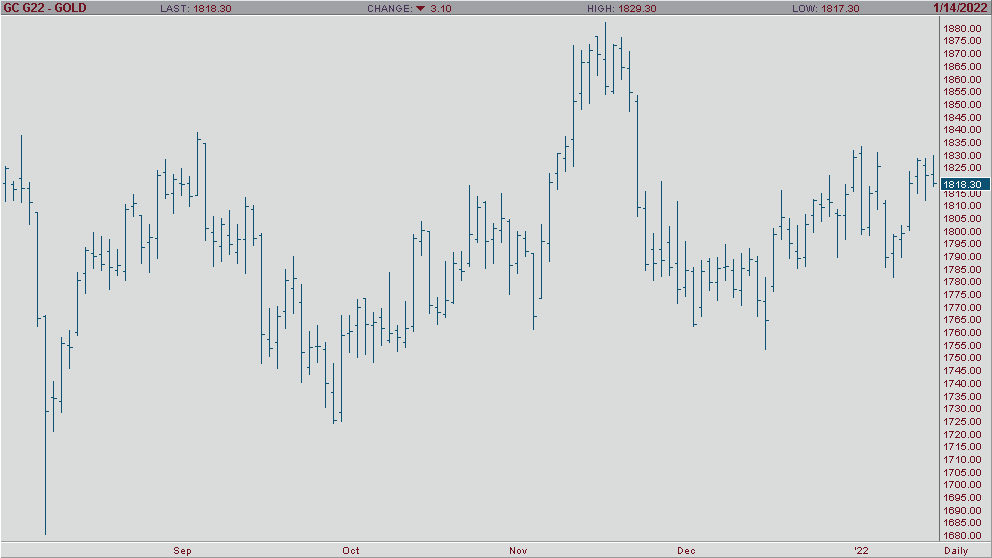
It has been a great week for the gold bulls out there as gold edged higher on Friday looking to complete its best week since November 2021. Gold prices are being bolstered by the weakness we are seeing in the U.S. dollar along with a decline in retail sails and lackluster consumer confidence. While the recent run-on inflation has been bad for most, it has done nothing but help gold. There is sentiment that the Fed will be more aggressive in their plan to raise interest rates to combat inflation in 2022 which would not be good for gold, but in the meantime the market is having a hard time trying to price that in and see it as a reality as we are still seeing rates near zero. After the news of a 1.8% decline in U.S. retail sales we saw gold jump a little bit higher and should everything hold steady we are looking at a 1.3% gain for the week. Whether this week a sign of a larger trend to come or if it's “fools gold” remains to be seen. Stay tuned for more updates.
Gold Feb '22 Daily ChartMetals - Silver Eyeing Inflation Tick
Silver Eyeing Inflation Tick
By: Eli Tesfaye, Senior Market StrategistPosted Jan 14, 2022 11:43AM CT
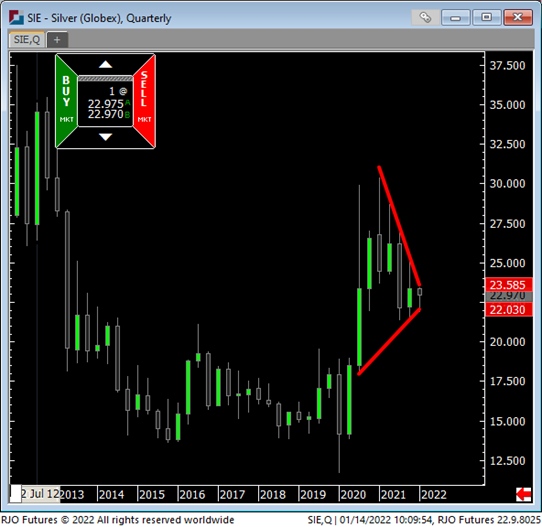
The recent inflation reading of 7% had silver bulls thinking that the market is heading to a higher price in coming sessions. Attached is a rarely seen quarterly silver chart outlining this possibility. You will see there is a rather bullish structure appearing on the chart. The market is triggering a reversal up so, long as we hold above $21.00, a close above $23.50 will likely entice a technical buy. Any corrective pullback will probably be seen as a buy interest rather than sell. Any dip below 21.00 will signal deflation risk, which is least likely but not impossible.
To learn more about inflation, please take a look at our newly updated Inflation Special Report. If there is anything else I can help you with today, and please let me know.
If you have any questions or would like to discuss the markets further, please feel free to contact me at 800-367-7290 or etesfaye@rjofutures.com. Energy - Oil Poised for Fourth Consecutive Week of Gains
Oil Poised for Fourth Consecutive Week of Gains
By: Alex Turro, Senior Market StrategistPosted Jan 14, 2022 9:17AM CT
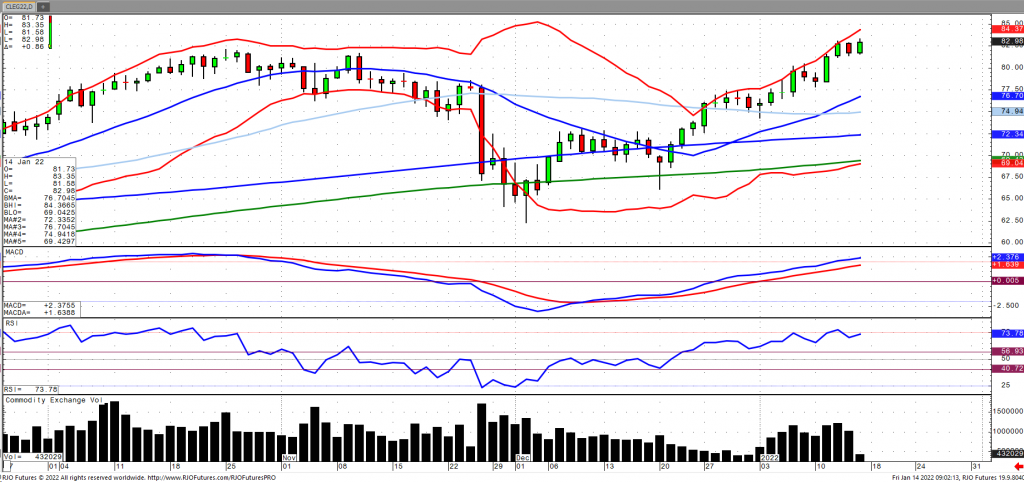
Oil prices are edging higher as of Friday morning and are set for their fourth consecutive week of gains amid supply constraints as well as a softer US Dollar, which has developed an inverse correlation of about -0.70 on both a 15 day as well as a 30-day duration. This comes as the US and China are set to release crude reserves prior to the Lunar New Year Holiday with the US Energy Department stating on Thursday that it had sold 18 million barrels of oil. In addition, China reported that its 2021 imports declined for the first time in nearly two decades. Oil stocks fell -4.553 million barrels for the seventh consecutive week totaling -20.722 million barrels in that time. Stocks are now down -68.913 million barrels below last year and -35.879 million barrels below the five-year average. The market has transitioned to bullish trend with today’s range seen between 74.23 – 83.46.
Crude Oil Feb '22 Daily Chart If you have any questions or would like to discuss the markets further, please feel free to contact me at 800-438-4805 or aturro@rjofutures.com. Softs - Technical Trade Taking Over in Cocoa Futures
Technical Trade Taking Over in Cocoa Futures
By: Peter MoosesPosted 01/14/2022
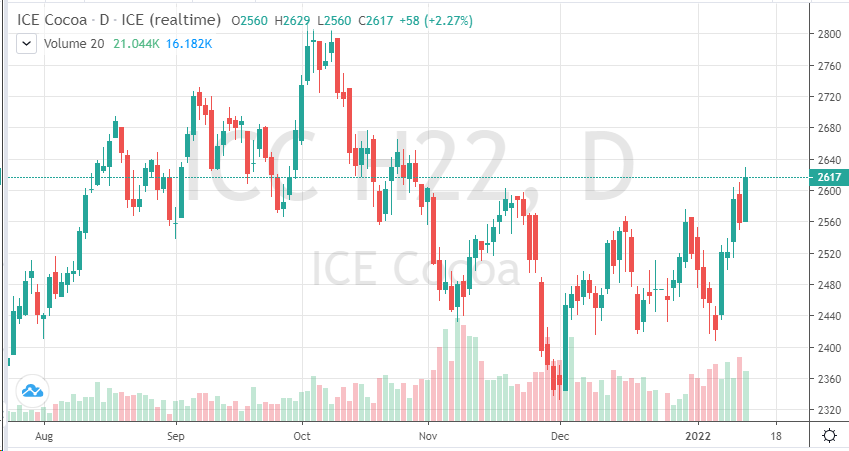
Traders
have been leaning on technical information to trade cocoa futures. With the
recent leg up, March cocoa appears to be headed towards 2640. Key resistance
levels have been broken, most recently, 2560. COT data shows a short position
that may be weakening.
As
for the fundamentals, there are a few developing stories that should boost
cocoa prices higher in the coming months. Production issues in Ghana will
support this current move higher. Ghana is well behind last year’s pace and it
appears that things can only get worse.
Milder weather in key growing regions have thrown off production
numbers.
Grinding
data is around the corner, next week we will get Europe’s numbers from the
fourth quarter of 2021. This paired with current currency volatility will
likely lead to cocoa prices edging higher.
For now, traders should continue to keep a close eye on the charts and wait for the fundamental stories to develop.
On
the heels of mid-Sep-to-early-Oct's steeper, accelerated, 3rd-wave-looking
recovery, the past week-and-a-half's boringly lateral chop is first considered
a corrective/consolidative event that warns of a continuation of the uptrend
that preceded it to new highs above 04-Oct's 891.0 high. This count
remains consistent with our broader base/correction/recovery count introduced
in 13-Sep's Technical Blog following that
day's bullish divergence in short-term momentum above 07-Sep's 809.5 minor
corrective high detailed in the hourly chart below.
The
important takeaway from this month's lateral, sleepy price action is the
definition of Wed's 851.5 low as
the end or lower boundary of a suspected 4th-Wave correction. A failure
below 851.5 will confirm a bearish divergence in daily momentum and defer or
threaten a bullish count enough to warrant non-bullish decisions like
long-covers. A failure below 851.5 will not
necessarily negate a broader bullish count, but it will threaten it enough to
warrant defensive measures as the next pertinent technical levels below 851.5 are
13-Sep's prospective minor 1st-Wave high at 813.8 and obviously 08-Sep's 766.0
low. And making non-bullish decisions "down there" is
sub-optimal to say the least. Per such, both short- and longer-term
commercial traders are advised to pare or neutralize bullish exposure on a
failure below 851.5, acknowledging and accepting whipsaw risk- back above 04-Oct's
891.0 high- in exchange for much deeper and sub-optimal nominal risk below
766.0.
On
a broader scale, the daily log scale chart above shows the developing potential
for a bearish divergence in daily momentum that will be considered confirmed
below 851.5. This chart also shows the past month's recovery thus far
stalling in the immediate neighborhood of the (888.0) Fibonacci
minimum 38.2% retrace of Apr-Sep's entire 1128 - 766 decline). COMBINED
with a failure below 851.5, traders
would then need to be concerned with at least a larger-degree correction pf the
past month's rally and possibly a resumption of Apr-Sep's major downtrend.
Until
and unless the market fails below 851.5 however, we would
remind longer-term players of the key elements on which our bullish count is
predicated:
a confirmed bullish divergence in WEEKLY momentum
(below)
amidst
an
historically low 11% reading in out RJO Bullish Sentiment Index and
a
textbook complete and major 5-wave Elliott sequence down from 29-Apr's
1128 high to 08-Sep's 766.0 low.
Thus
far, the market is only a month into correcting a 4-MONTH, 32% drawdown, so
further and possibly protracted gains remain well within the bounds of a major
(suspected 2nd-Wave) correction of Apr-Sep's decline within an even more
massive PEAK/reversal process from 17-May's 1219 high on an active continuation
basis below.
These
issues considered, a bullish policy and exposure remain advised with a failure
below 851.5 required to defer or threaten this call enough to warrant moving to
a neutral/sideline position. In lieu of such weakness, we anticipate a
continuation of the past month's rally to new highs and potentially significant
gains above 891.0.
Agricultural - Grains - Minor Breakdown in March Corn
Grains - Minor Breakdown in March Corn
By: Michael Sabo, Senior Market StrategistPosted Jan 14, 2022 10:26AM CT
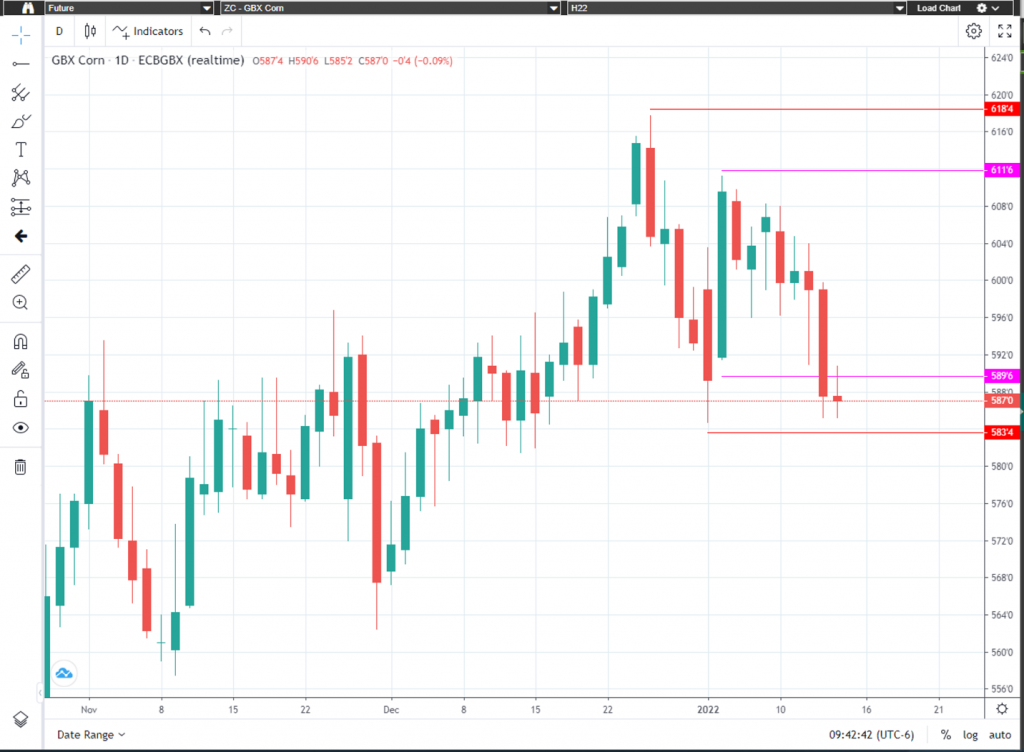
On January 7th I advised traders on the following “Today I would advise traders to watch for another breakout” “I believe short term aggressive levels are $6.11 ¾ on the upside and $5.89 ¾ on the downside and the medium term breakout levels are $6.18 ½ upside and $5.83 ½ on the downside.” Let’s take a look at what has happened since last Friday. March corn started off the week continuing to consolidate between the short-term breakout levels I mentioned last Friday until yesterday. On Wednesday the USDA Crop Report was fairly in line with expectations and generally considered a nonevent. Yesterday, we saw a broad-based selloff which pressured corn and took it below $5.89 ¾ triggering a short term sell for aggressive traders. Traders should watch to see if March Corn trades below $5.83 ½ , if it does, we could see additional downside pressure. Big picture I still remain bullish, but traders should remain alert to potential selloffs.
The “big picture” numbers remain the same and probably will for some time. I firmly believe a break below $4.96 could give the bears control of the market and a break above $6.39 ½ on the upside may have enough bulls behind it to propel corn to all-time highs. There are several minor areas of support and resistance inside this range that can help with short term market direction if violated. Call me directly at 1-800-367-7290 for more in-depth discussion on these numbers and to discuss trading strategies specific to your situation.
I would suggest using an option strategy to manage your futures position risk or an outright option strategy. Implied option volatility has come down quite a bit from its most recent highs mainly due to the consolidation and tighter trading ranges. I have 25 years of grain market experience, feel free to call or email with any questions you may have. Be sure to check out my archived weekly grain market insight articles posted on our website.
**** Reserve
your FREE 2022 Commodity Trading Guide Today! ****
This 55-page guide is packed with indispensable market information. It has a complete commodity calendar that lists the dates and times of Market Reports, option expiration dates, futures first notice dates, futures last trade dates, etc. It readily serves as your commodity market encyclopedia giving you an in depth look at each commodity, there is market almanac for all actively traded commodities and much more! To reserve your complimentary Commodity Trading Guide, send me an email at msabo@rjofutures.com with the following information: your full name, mailing address and a preferred phone number so we can confirm your request. Once confirmed, I will reserve your trading guide, and have it sent out as soon as we receive them.
Corn Mar '22 Daily Chart If you have any questions or would like to discuss the markets further, please feel free to contact me at 800-367-7290 or msabo@rjofutures.com. Equity - Stock Futures Losses Extended
Stock Futures Losses Extended
By: Jeff Yasak, Senior Market StrategistPosted Jan 14, 2022 9:15AM CT
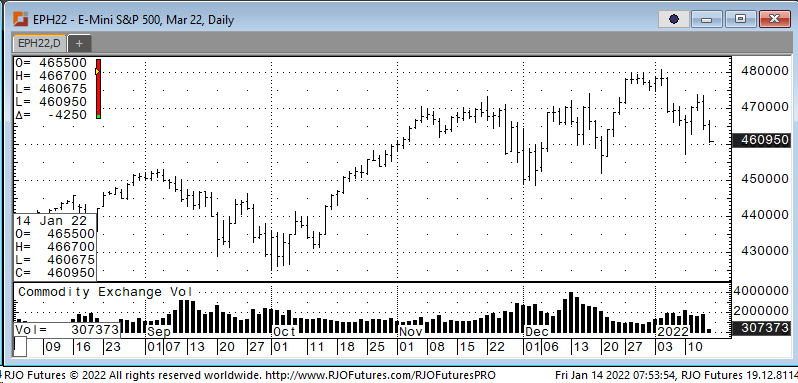
Futures losses continued this morning adding to Thursday’s tech-driven selloff, while traders were watching a mixed group of bank earnings and a larger than expected drop in U.S. retail sales. Friday’s economic data came in much weaker than expected, adding to the current sell off. U.S. retail sales fell 1.9% in December month-to-month, far exceeding the estimate of a 0.1% drop making it the largest drop since February 2021. The November number was also downwardly revised to 0.2% compared to the 0.3 percent previously reported. In Fed Governor Lael Brainard's hearing before the Senate Banking Committee on Thursday, she suggested the central bank could begin raising interest rates — a move that would tighten financial conditions and help bring down inflation — "as soon as asset purchases are terminated." The Federal Reserve is currently set to end its asset-purchase tapering process in March.
Support today is 460300 and 457500 with resistance showing 469500 and 476300.
E-mini S&P 500 Daily Chart If you have any questions or would like to discuss the markets further, please feel free to contact me at 888-861-1656 or jyasak@rjofutures.com. Economy - S-T Mo Failure Insufficient to End RBOB Correction, But Beware
S-T Mo Failure Insufficient to End RBOB Correction, But Beware
By: RJO Market InsightsPosted 11/08/2022
Posted on Nov 08, 2022, 07:51 by Dave Toth
In Fri's Technical Webcast we identified a
minor corrective low at 2.6328 from Thur as a mini risk parameter the market
needed to sustain gains above to maintain a more immediate bullish count.
The 240-min chart below shows the market's failure overnight below this level,
confirming a bearish divergence in very short-term momentum. This mo
failure defines Fri's 2.8172 high as
one of developing importance and a parameter from which very short-term traders
can objectively base non-bullish decisions like long-covers.
Given
the magnitude of the past three weeks' broader recovery however, this
short-term momentum failure is of an insufficient scale to conclude anything
more than another correction within this broader recovery from 26-Sep's 2.1877
low. Indeed, overnights failure below 2.6328 only allows us to conclude
the end of the portion of the month-and-a-half rally from 31-Oct's 2.4822 next
larger-degree corrective low. 2.4822 is the
risk parameter this market still needs to fail below to break the uptrend from
18-Oct's 2.3526 low while this 2.3526 low
remains intact as the risk parameter this market needs to fail below to break
the month-and-a-half uptrend. From an
intermediate-to-longer-term perspective, this week's setback falls well within
the bounds of another correction ahead of further gains. This is another
excellent example of the importance of technical and trading SCALE and
understanding and matching directional risk exposure to one's personal risk
profile.
The
reason overnight's admittedly minor mo failure might have longer-term
importance is the 2.8172-area from which it stemmed. In
Fri's Technical Blog we also noted the market's engagement of the
2.8076-to-2.8159-area marked by the 61.8% retrace of Jun0-Sewp's 3.2758 -2.1877
decline and the 1.000 progression of Sep-Oct's initial 2.1877 - 2.6185
(suspected a-Wave) rally from 18-Oct's 2.3526 (suspected b-Wave) low. We
remind longer-term players that because of the unique and compelling confluence
of:
early-Aug's bearish divergence in WEEKLY momentum
amidst
historically
extreme bullish sentiment/contrary opinion levels in our RJO Bullish
Sentiment Index
an
arguably complete and massive 5-wave Elliott sequence from Mar'20's 0.4605
low to Jun's 4.3260 high (as labeled in the weekly log active-continuation
chart below) and
the
5-wave impulsive sub-division of Jun-Sep's (suspected initial 1st-Wave) decline
The
recovery attempt from 26-Sep's 2.1877 low is arguably only a 3-wave (Wave-2)
corrective rebuttal to Jun-Sep's decline within a massive, multi-quarter
PEAK/reversal process. Now granted, due to the magnitude of 2020 -2022's
secular bull market, we discussed the prospect for this (2nd-Wave corrective)
recovery to be "extensive" in terms of both price and time. A
"more extensive" correction is typified by a retracement of 61.8% or
more and spanning weeks or even months following a 3-month decline. Per
such, the (suspected corrective) recovery from 26-Sep's 2.1877 low could easily
have further to go, with commensurately larger-degree weakness than that
exhibited this week (i.e., a failure below at least 2.4822) required
to consider the correction complete. Indeed, the daily log chart above
shows the market thus far respecting former 2.6185-area resistance from 10-Oct
as a new support candidate.
These
issues considered, very shorter-term traders have been advised to move to a neutral/sideline
position following overnight's momentum failure below 2.6328, with a recovery
above 2.8172 required to negate this call, reaffirm the recovery and re-expose
potentially significant gains thereafter. For intermediate- and
longer-term players, a bullish policy and exposure remain advised with a
failure below 2.4822 required to threaten this call enough to warrant
neutralizing exposure. We will be watchful for another bearish divergence
in momentum following a recovery attempt that falls short of Fri's 2.8172 high
that would be considered the next reinforcing factor to a count calling that
2.8172 high the prospective end to the month-and-a-half 2nd-Wave
correction. In lieu of such, a resumption of the current rally to
eventual new highs above 2.8172 should not surprise.
By: John Caruso, Senior Market StrategistPosted Jan 14, 2022 8:29AM CT
Just a few notes this morning,
*Stock selling has intensified a bit in the overnight SPY
-0.65%, NQ -0.80%, RTY -0.80%.
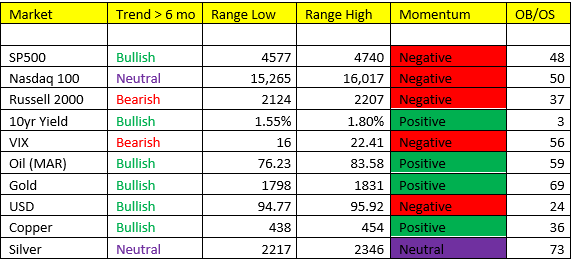
*The Russell 2000 has flipped back to bearish trend, SPY
Bullish, NQ Neutral
*The USD has gained a little ground vs the euro, perhaps on a slight flight to safety bid. USD remains immediate OS vs euro here.
*Japanese yen looks like it may have secured an intermediate term “bottom” that could lift JPY/USD back to 92.00
*Yields have ticked up to 1.73%; The yield curve has
flattened for the 5th straight day to 80.5bps vs 82 yesterday, and
88 on Monday
*Copper back down -2.35%
Is growth slowing front running the inflation signal? Retail sales just bombed m/m to -1.9%. We saw more hot inflation data (highly probable it slows over the next 1 to 2 months), that takes us straight into Scenario 4.
Be careful out there. Embrace the non-linearity of this market – Remember: yesterday’s market is not today’s, and these market need not follow any patterns nor ANYONE’s rules. Stay small….if you lose too much in a bad tape, you can’t participate in the good ones.
If you have any questions or would like to discuss the markets further, please feel free to contact me at 800-669-5354 or jcaruso@rjofutures.com.