Looking to diversify your investment portfolio with futures trading, but lack the expertise on your own? Trading Systems and their programs are now listed on our website complete with track records, products traded and minimum account requirements and fees. If you need help navigating the site and viewing the results, give us a call.
New Special Report: Inflation, How Much is Too Much?
With so much money in the market, coupled with weakened supply chains and workforces due to the fallout of Covid-19, we are seeing a rampant run on inflation. Prices from everything to lumber, oil, and groceries are up. Learn why this is happening, how long it will go on for, and how to protect yourself with this Special Report!
The Markets
Metals - Gold Beginning to Embrace Inflation
Gold Beginning to Embrace Inflation
By: Frank J. Cholly, Senior Market StrategistPosted Feb 11, 2022 9:15AM CT
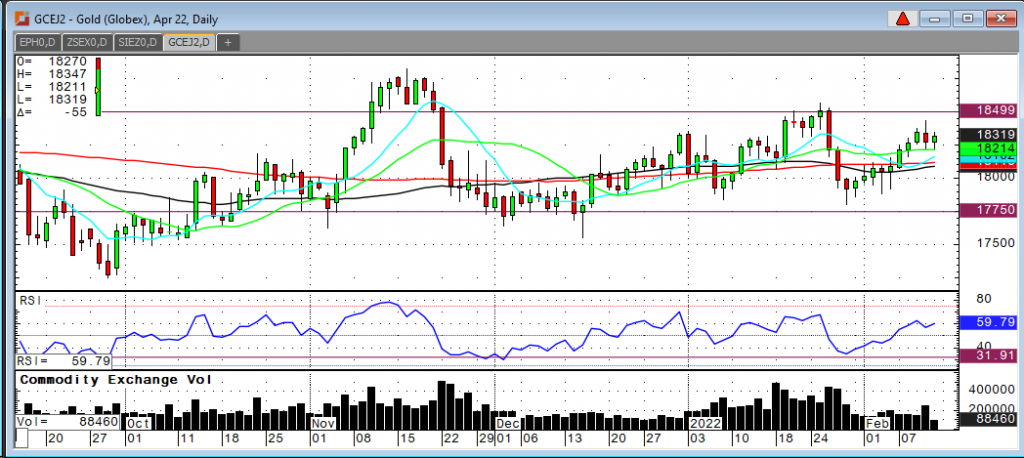
While gold does continue to trade a big choppy range of
$1,775 to $1,850, the rally of the past two weeks is impressive. Gold has based
a bottom and it looks like gold traders are finally coming to terms with all the
inflation data out there. Rates are moving higher, and gold has been climbing
higher also. The next breakout above $1,850 is likely, in my opinion, to move
prices back to challenge $1,900. I also believe that once gold moves above
$1,850 that it will begin basing a higher low. In the range of $1,850 to
$1,900.
Platinum is coming back to life also. A move above $1,100 is
in the cards. It seems to be a good value between $1,010 to $1,020 April basis.
Platinum will have an easier path forward than silver, but once silver starts
to move it will be very fast, probably a $1.00 at a time.
Energy prices are very strong. Interest rates are moving higher and there’s still too much cash out there. It’s about the money supply and gold and other precious metals have to move higher too!
Gold Apr '22 Daily Chart If you have any questions or would like to discuss the markets further, please feel free to contact me at 800-826-4124 or fcholly@rjofutures.com. Energy - Oil Poised for Weekly Loss
Oil Poised for Weekly Loss
By: Alex Turro, Senior Market StrategistPosted Feb 11, 2022 10:08AM CT
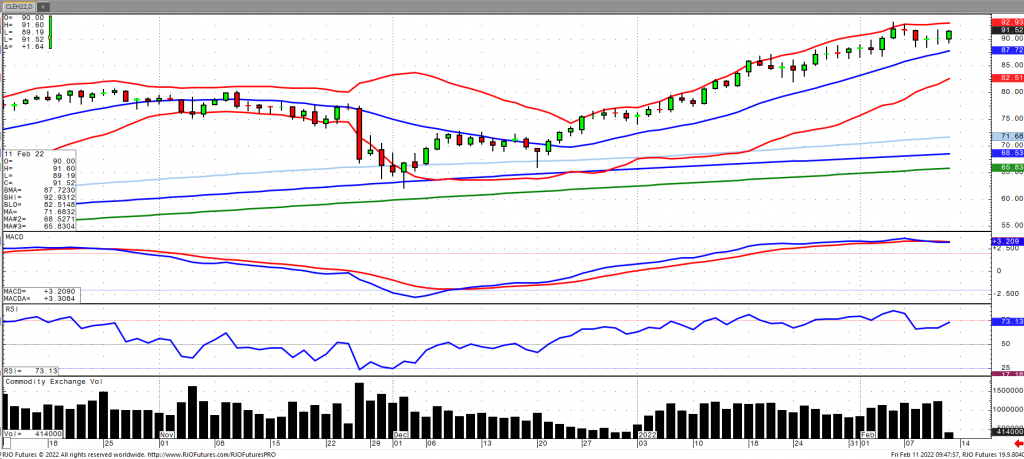
Oil prices are moving higher as of Friday morning but are poised for their first weekly loss after seven consecutive weekly gains as the IEA noted that global supplies continue to remain tight, while simultaneously noting that OPEC+ production came in 900k barrels below their target for January. Moreover, the IEA noted that Saudi Arabia and the UAE could help combat higher prices by providing more supply as they have excess productive capacity. OPEC+, in turn, had an upward revision to demand for the coming year. Nuclear talks between the US and Iran were revived this week with a deal potentially lifting sanctions on Iranian oil, which would ease supply tightness. Crude stocks fell -4.75 million barrels with the deficit narrowing -58.627 million barrels below last year with the five-year average widening to -50.12 million barrels, according to the EIA. This now puts US crude stocks at the lowest since October 2018. Oil volatility (ovx) continues to remain elevated in the mid 40s with the market remaining bullish trend with today’s range seen between 85. 32 – 92.19.
Crude Oil Daily Chart If you have any questions or would like to discuss the markets further, please feel free to contact me at 800-438-4805 or aturro@rjofutures.com. Softs - Cocoa Recovers as Macroeconomic Data Continues Stronger Patter
Cocoa Recovers as Macroeconomic Data Continues Stronger Patter
By: Peter MoosesPosted 02/11/2022
Cocoa
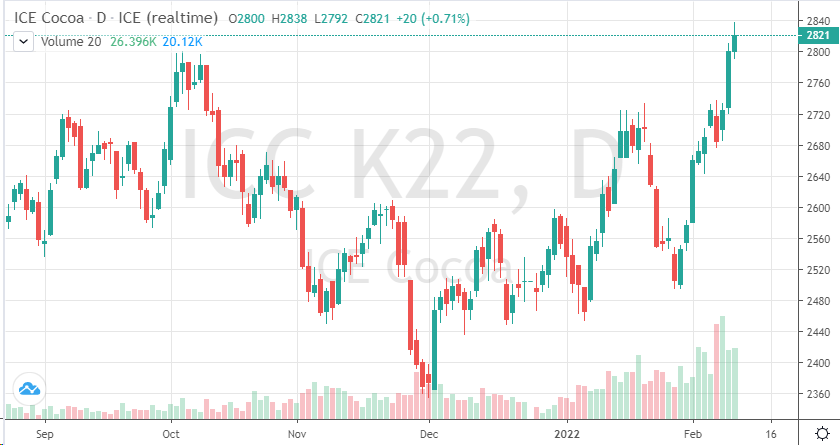
futures’ prices have recently rallied more than 10%. Recent global data is
indicating that this trend higher may continue. As an individual commodity, the
demand for cocoa is increasing. Key areas of the world for cocoa purchases - Europe
and North America, have begun removing Covid restrictions which appears to be
boosting the demand in chocolate. The equity markets in Europe and the U.S.
have also been strengthening, although still very volatile.
Weather
patterns in West Africa have been very dry due to high temperatures, causing
some concern in production numbers which could help support prices to stay
above 2800. Weather will be a key factor in prices for the short-term. If
production is affected later this season, prices could touch new contract highs
in the coming months.
Grinding data in the future will also be telling for the outlook of cocoa this year. For now, supply and demand are working together to move cocoa prices higher. Traders should monitor the 2850 level and consider buying calls in further out months if the bullish trend continues.
On
the heels of mid-Sep-to-early-Oct's steeper, accelerated, 3rd-wave-looking
recovery, the past week-and-a-half's boringly lateral chop is first considered
a corrective/consolidative event that warns of a continuation of the uptrend
that preceded it to new highs above 04-Oct's 891.0 high. This count
remains consistent with our broader base/correction/recovery count introduced
in 13-Sep's Technical Blog following that
day's bullish divergence in short-term momentum above 07-Sep's 809.5 minor
corrective high detailed in the hourly chart below.
The
important takeaway from this month's lateral, sleepy price action is the
definition of Wed's 851.5 low as
the end or lower boundary of a suspected 4th-Wave correction. A failure
below 851.5 will confirm a bearish divergence in daily momentum and defer or
threaten a bullish count enough to warrant non-bullish decisions like
long-covers. A failure below 851.5 will not
necessarily negate a broader bullish count, but it will threaten it enough to
warrant defensive measures as the next pertinent technical levels below 851.5 are
13-Sep's prospective minor 1st-Wave high at 813.8 and obviously 08-Sep's 766.0
low. And making non-bullish decisions "down there" is
sub-optimal to say the least. Per such, both short- and longer-term
commercial traders are advised to pare or neutralize bullish exposure on a
failure below 851.5, acknowledging and accepting whipsaw risk- back above 04-Oct's
891.0 high- in exchange for much deeper and sub-optimal nominal risk below
766.0.
On
a broader scale, the daily log scale chart above shows the developing potential
for a bearish divergence in daily momentum that will be considered confirmed
below 851.5. This chart also shows the past month's recovery thus far
stalling in the immediate neighborhood of the (888.0) Fibonacci
minimum 38.2% retrace of Apr-Sep's entire 1128 - 766 decline). COMBINED
with a failure below 851.5, traders
would then need to be concerned with at least a larger-degree correction pf the
past month's rally and possibly a resumption of Apr-Sep's major downtrend.
Until
and unless the market fails below 851.5 however, we would
remind longer-term players of the key elements on which our bullish count is
predicated:
a confirmed bullish divergence in WEEKLY momentum
(below)
amidst
an
historically low 11% reading in out RJO Bullish Sentiment Index and
a
textbook complete and major 5-wave Elliott sequence down from 29-Apr's
1128 high to 08-Sep's 766.0 low.
Thus
far, the market is only a month into correcting a 4-MONTH, 32% drawdown, so
further and possibly protracted gains remain well within the bounds of a major
(suspected 2nd-Wave) correction of Apr-Sep's decline within an even more
massive PEAK/reversal process from 17-May's 1219 high on an active continuation
basis below.
These
issues considered, a bullish policy and exposure remain advised with a failure
below 851.5 required to defer or threaten this call enough to warrant moving to
a neutral/sideline position. In lieu of such weakness, we anticipate a
continuation of the past month's rally to new highs and potentially significant
gains above 891.0.
Agricultural - Grains - Upside Breakout - New Contract Highs
Grains - Upside Breakout - New Contract Highs
By: Michael Sabo, Senior Market StrategistPosted Feb 11, 2022 10:56AM CT
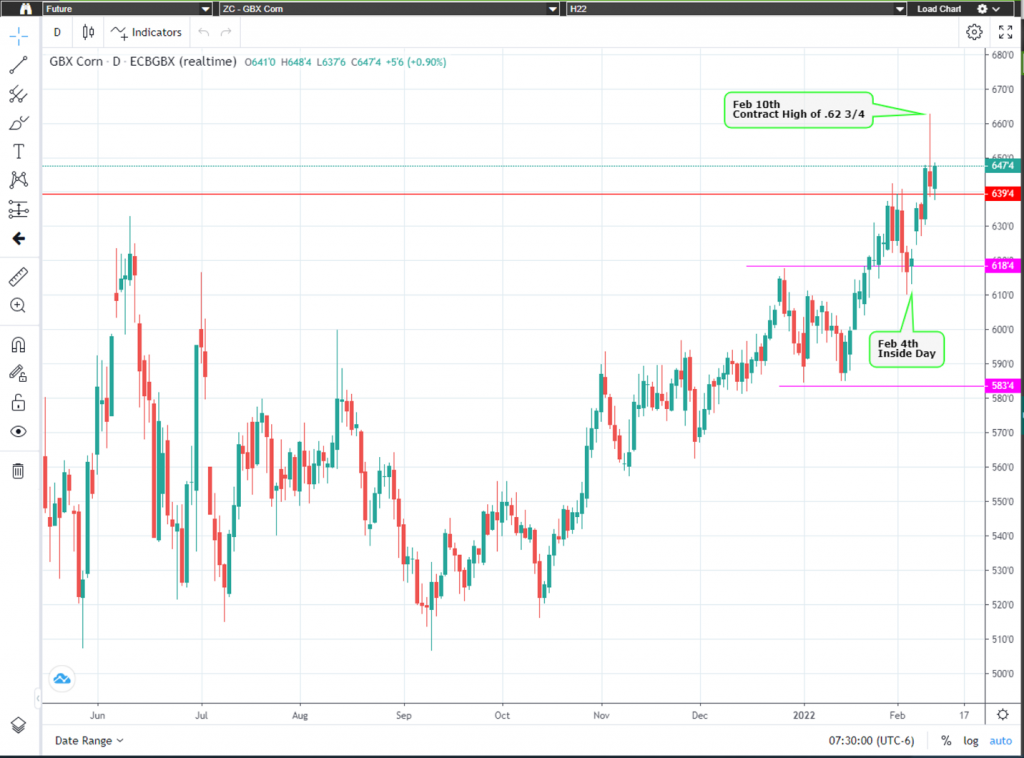
On February 4th I advised traders on the following: “As one can see by looking at the chart below on Jan 24th March corn broke out above $6.18 ½, a level I mentioned several times in my articles. By January 31st March corn reached a contract high of $6.42 ½ which took out another key level, in my opinion, of $6.39 ½ a level I have been advising on for months. With the small pullback to current trading / consolidation levels (inside day forming so far today). If today forms an inside day I would advise traders buying on a breakout above today’s high. I remain bullish for now, but traders should be prepared for additional volatility at these prices especially with the recent breakout.” Last Friday which was February 4th, the market did form an inside trading day as I thought it could (see chart below) on Monday the market broke out to the upside indicating a buy signal. I still remain bullish but would advise traders to be cautious as we could see short term selloffs to push the weak longs out of the market.
For months I have been advising traders on the following in my articles: “The “big picture” numbers remain the same and probably will for some time. I firmly believe a break below $4.96 could give the bears control of the market and a break above $6.39 ½ on the upside may have enough bulls behind it to propel corn to all-time highs." FINALLY, after months of corn consolidating in a rather large trading range, March corn broke out above $6.39 ½, made a small pullback to a low of $6.10 ¼ and then quickly made a move to $6.62 ¾ on February 10th printing a new contract high! Call me directly at 1-800-367-7290 for more in-depth discussion on these numbers and to discuss trading strategies specific to your situation.
I would suggest using an option strategy to manage the risk on a futures position or a 3-legged option strategy for producers looking to forward market their grain. A strategy like this gives producers an opportunity to take advantage of further upside while protecting a sizable price area of downside risk. Implied option volatility is currently up, when compared to the historic volatility levels, so now may be an excellent time to implement strategies like this. Call for specific entry levels and strike prices. I have 26 years of grain trading experience, feel free to call or email with any questions you may have and be sure to check out my archived weekly grain market insight articles posted on our website.
**** Request
your FREE 2022 Commodity Trading Guide Today! ****
This 55-page guide is packed with indispensable market information. It has a complete commodity calendar that lists the dates and times of Market Reports, option expiration dates, futures first notice dates, futures last trade dates, etc. It readily serves as your commodity market encyclopedia giving you an in depth look at each commodity, there is market almanac for all actively traded commodities and much more! To receive your complimentary Commodity Trading Guide, send me an email at msabo@rjofutures.com with the following information: your full name, mailing address and a preferred phone number so we can confirm your request. Once confirmed I will have it sent out.
Corn Daily Chart If you have any questions or would like to discuss the markets further, please feel free to contact me at 800-367-7290 or msabo@rjofutures.com. Equity - Stocks Flat After Thursday's Sell-Off
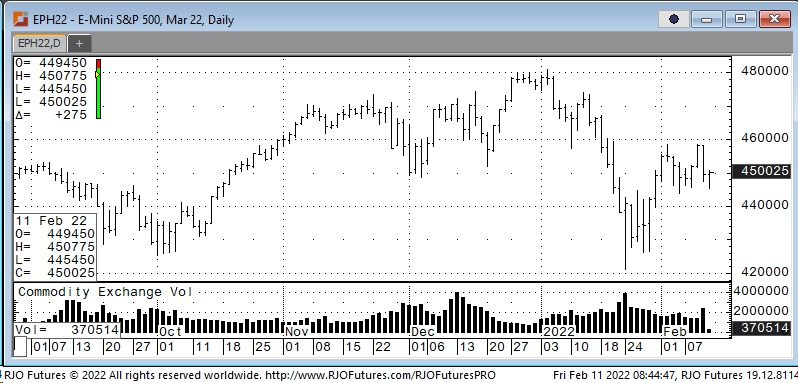
Stocks Flat After Thursday's Sell-Off
By: Jeff Yasak, Senior Market StrategistPosted Feb 11, 2022 9:37AM CT
U.S. stock futures
were relatively flat Friday morning after Thursday’s sharp sell-off initiated
by the high inflation number and an announcement of a 100-basis point increase
to the Fed Rate by July. The Labor department
released data on Thursday that showed a 7.5% increase in the consumer price
index, a composite of the cost on everyday good, as opposed to the expected
7.2%. This was the highest reading since
the first quarter of 1982. James
Bullard, the St, Louis Federal Reserve Charmain, called for a 100 pt increase
during the three regularly scheduled meetings before July with the first being
in March. Most economist are predicting
an aggressive 50-pt hike during that first meeting in March with a total of
150-pts for the year to curtail the rising inflation.
Support today is checking in at 443150 and 441000 with resistance showing 454000 and 461400.
E-mini S&P 500 Mar '22 Daily Chart If you have any questions or would like to discuss the markets further, please feel free to contact me at 888-861-1656 or jyasak@rjofutures.com. Economy - S-T Mo Failure Insufficient to End RBOB Correction, But Beware
S-T Mo Failure Insufficient to End RBOB Correction, But Beware
By: RJO Market InsightsPosted 11/08/2022
Posted on Nov 08, 2022, 07:51 by Dave Toth
In Fri's Technical Webcast we identified a
minor corrective low at 2.6328 from Thur as a mini risk parameter the market
needed to sustain gains above to maintain a more immediate bullish count.
The 240-min chart below shows the market's failure overnight below this level,
confirming a bearish divergence in very short-term momentum. This mo
failure defines Fri's 2.8172 high as
one of developing importance and a parameter from which very short-term traders
can objectively base non-bullish decisions like long-covers.
Given
the magnitude of the past three weeks' broader recovery however, this
short-term momentum failure is of an insufficient scale to conclude anything
more than another correction within this broader recovery from 26-Sep's 2.1877
low. Indeed, overnights failure below 2.6328 only allows us to conclude
the end of the portion of the month-and-a-half rally from 31-Oct's 2.4822 next
larger-degree corrective low. 2.4822 is the
risk parameter this market still needs to fail below to break the uptrend from
18-Oct's 2.3526 low while this 2.3526 low
remains intact as the risk parameter this market needs to fail below to break
the month-and-a-half uptrend. From an
intermediate-to-longer-term perspective, this week's setback falls well within
the bounds of another correction ahead of further gains. This is another
excellent example of the importance of technical and trading SCALE and
understanding and matching directional risk exposure to one's personal risk
profile.
The
reason overnight's admittedly minor mo failure might have longer-term
importance is the 2.8172-area from which it stemmed. In
Fri's Technical Blog we also noted the market's engagement of the
2.8076-to-2.8159-area marked by the 61.8% retrace of Jun0-Sewp's 3.2758 -2.1877
decline and the 1.000 progression of Sep-Oct's initial 2.1877 - 2.6185
(suspected a-Wave) rally from 18-Oct's 2.3526 (suspected b-Wave) low. We
remind longer-term players that because of the unique and compelling confluence
of:
early-Aug's bearish divergence in WEEKLY momentum
amidst
historically
extreme bullish sentiment/contrary opinion levels in our RJO Bullish
Sentiment Index
an
arguably complete and massive 5-wave Elliott sequence from Mar'20's 0.4605
low to Jun's 4.3260 high (as labeled in the weekly log active-continuation
chart below) and
the
5-wave impulsive sub-division of Jun-Sep's (suspected initial 1st-Wave) decline
The
recovery attempt from 26-Sep's 2.1877 low is arguably only a 3-wave (Wave-2)
corrective rebuttal to Jun-Sep's decline within a massive, multi-quarter
PEAK/reversal process. Now granted, due to the magnitude of 2020 -2022's
secular bull market, we discussed the prospect for this (2nd-Wave corrective)
recovery to be "extensive" in terms of both price and time. A
"more extensive" correction is typified by a retracement of 61.8% or
more and spanning weeks or even months following a 3-month decline. Per
such, the (suspected corrective) recovery from 26-Sep's 2.1877 low could easily
have further to go, with commensurately larger-degree weakness than that
exhibited this week (i.e., a failure below at least 2.4822) required
to consider the correction complete. Indeed, the daily log chart above
shows the market thus far respecting former 2.6185-area resistance from 10-Oct
as a new support candidate.
These
issues considered, very shorter-term traders have been advised to move to a neutral/sideline
position following overnight's momentum failure below 2.6328, with a recovery
above 2.8172 required to negate this call, reaffirm the recovery and re-expose
potentially significant gains thereafter. For intermediate- and
longer-term players, a bullish policy and exposure remain advised with a
failure below 2.4822 required to threaten this call enough to warrant
neutralizing exposure. We will be watchful for another bearish divergence
in momentum following a recovery attempt that falls short of Fri's 2.8172 high
that would be considered the next reinforcing factor to a count calling that
2.8172 high the prospective end to the month-and-a-half 2nd-Wave
correction. In lieu of such, a resumption of the current rally to
eventual new highs above 2.8172 should not surprise.
By: John Caruso, Senior Market StrategistPosted Feb 10, 2022 11:52AM CT
John Caruso talks about the latest news moving the markets including a metals market that appears to be on fire, learn what John makes of this movement and more. If you have any questions or would like to discuss the markets further, please feel free to contact me at 800-669-5354 or jcaruso@rjofutures.com.