New Special Report: Inflation, How Much is Too Much?
With so much money in the market, coupled with weakened supply chains and workforces due to the fallout of Covid-19, we are seeing a rampant run on inflation. Prices from everything to lumber, oil, and groceries are up. Learn why this is happening, how long it will go on for, and how to protect yourself with this Special Report!
4th of July: Freedom From Commissions
Receive free commissions when you open and fund an account in the month of July! This is one firecracker you don’t want to miss!
The Markets
Metals - Gold Needs to Embrace Inflation
Gold Needs to Embrace Inflation
By: Frank J. Cholly, Senior Market StrategistPosted Jul 23, 2021 8:52AM CT
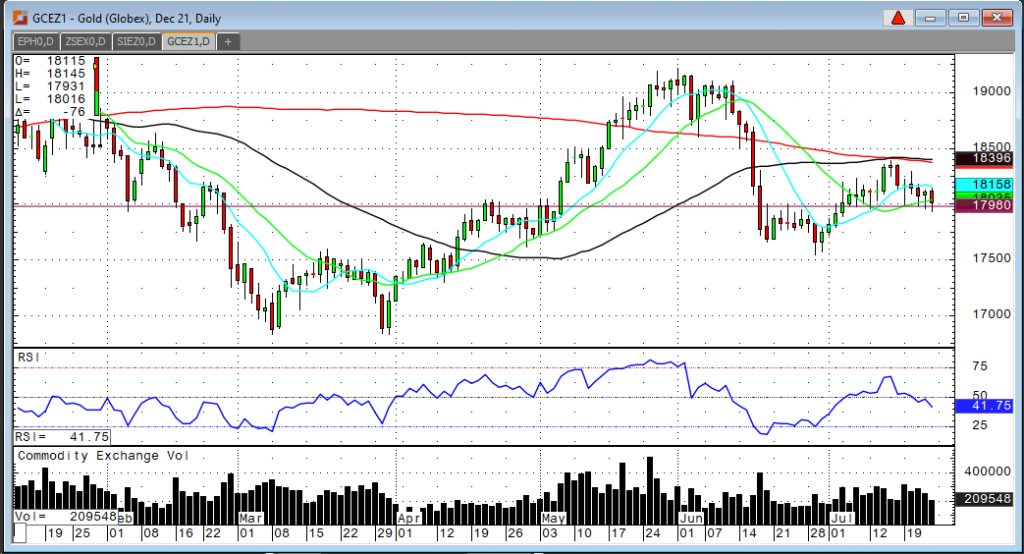
Gold is another example of how the Fed’s over extended easy money policy has created government dependency. Gold traders are still not willing to embrace inflation. As the price of just about every other raw commodity has rapidly increased in cost, gold has been a reluctant participant. The dollar strength hasn’t been supportive for sure but gold traders seem more fearful of a rate hike than anything else. In fact, gold couldn’t rally on a big risk off earlier in the week either. Late last week gold failed to break out above the $1,835-$1,840 range. So, to say that I’m disappointed in gold’s recent performance is an understatement. We will see if gold can find value in the range around $1,800. A dip closer to $1,885 is not out of the realm of possibility either. I remain long term bullish on the yellow metal. Remember the money supply is at all time record highs. In 2020 alone, we added 30%.
If you have any questions or would like to discuss the markets further, please feel free to contact me at 800-826-4124 or fcholly@rjofutures.com. Metals - Silver Not Closing Strong
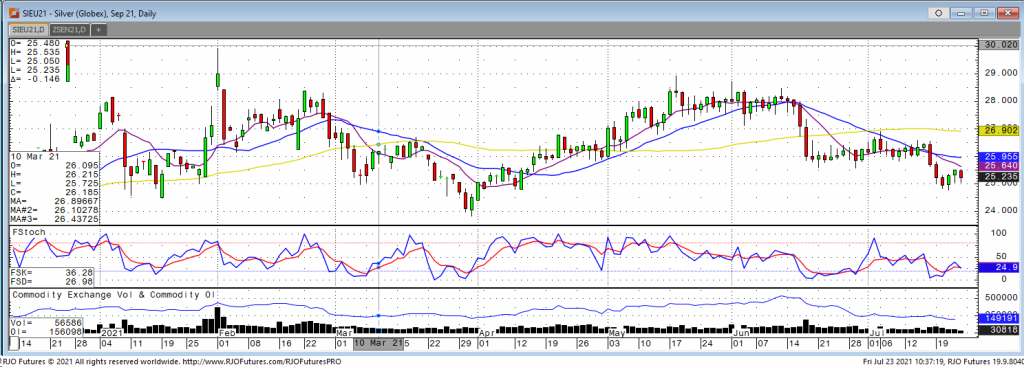
The September silver market started the week continuing the slide lower from last Friday’s drop. The market seemed to find some support around the $25 level but isn’t closing out the week strong with lower trade today after posting a mid-week high of $25.51. The bears definitely hold control both technically and fundamentally. US economic data weakening, showing signs of a slowing economy, and a push higher in the US dollar has deflationary talks increasing. Currently, the silver market is failing at finding anything to send it higher and traders are also losing interest. ETF holdings in both silver and gold have continued to decline in the past couple of weeks. Bulls will need to see the $25 level hold and a push back to and eventually above the sideways range from $26-$26.50. Failing to hold the $25 level would see a push back down to $24.
Silver Sep '21 Daily Chart If you have any questions or would like to discuss the markets further, please feel free to contact me at 800-826-2270 or therrmann@rjofutures.com. Energy - Oil Demand Set to Outpace Supply
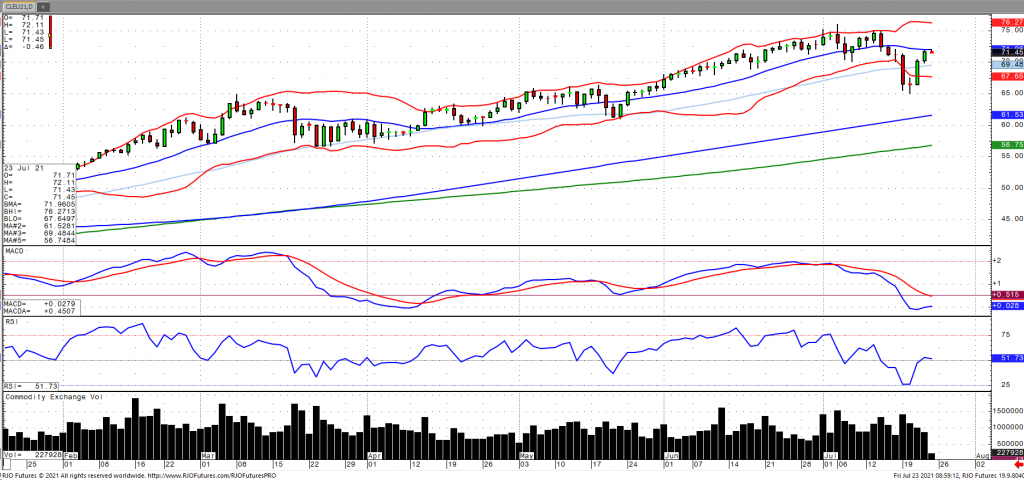
Oil prices are taking a breather after rebounding from their precipitous drop earlier in the week as supply is expected to remain tight as global demand growth continues to recover. This comes amid an agreement by OPEC+ to add 400k barrels per day from August through December. Crude stocks increased for the first time in eight weeks with a build of 2.1 million barrels coupled with a jump in crude imports from Mexico as well as a decline in the refinery rate (but still above five-year refinery average), according to the EIA. The market has largely discounted the impact of the delta variant as well as residual strength in the US Dollar as oil volatility (OVX) has come off trend resistance falling to the mid-30s. The market remains bullish trend with today’s range seen between 66.83 – 77.17.
Crude Oil Sep '21 Daily Chart If you have any questions or would like to discuss the markets further, please feel free to contact me at 800-438-4805 or aturro@rjofutures.com. Softs - Frost Damage Could be Significant for Coffee
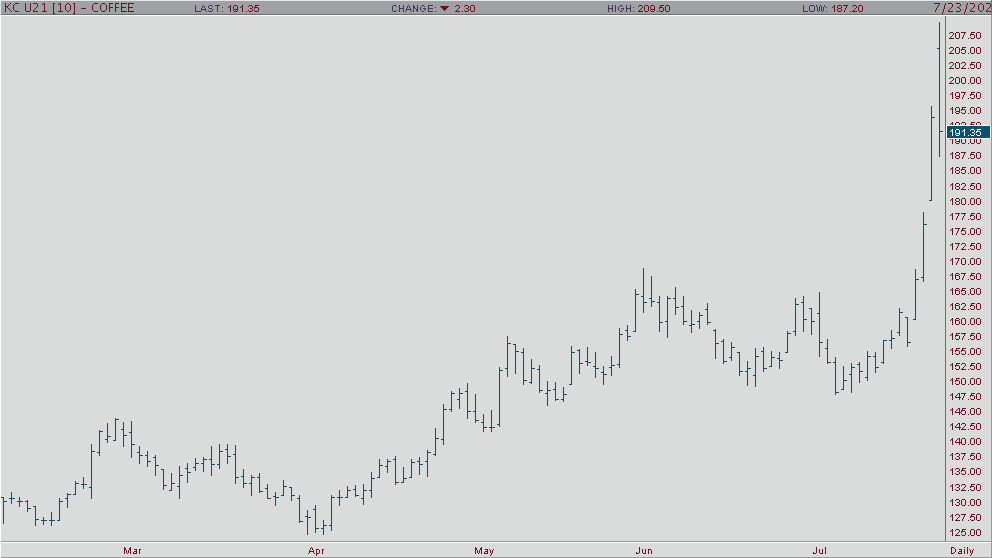
Fears of producer defaults on contracts for this year’s crop helped to push the coffee market 8% higher on the opening, as losses could be significant and tree recovery may take up to years to recover. Loss estimates are very speculative at this point. Coffee’s upsurge continues to gain momentum as prices have risen over 23% in value over the past 3 trading sessions. While the market appears to be heading for even higher price levels, coffee is already well into technically overbought levels and is vulnerable to profit taking. Indications that this week’s frost in Brazil regions led to significant damage to coffee trees has fueled coffees move higher this week. The gap up on the chart is a bullish indicator. First support hits at 185.90 and below there 175.15. Resistance comes in at 201.40 and then up at 206.00.
Coffee Sep '21 Daily Chart If you have any questions or would like to discuss the markets further, please feel free to contact me at 800-826-2270 or tcholly@rjofutures.com. Agricultural - Bullish Canola Count Intact Above Minimum 851.5
Bullish Canola Count Intact Above Minimum 851.5
By: RJO Market InsightsPosted 10/14/2022
Posted on Oct 14, 2022, 07:42 by Dave Toth
On
the heels of mid-Sep-to-early-Oct's steeper, accelerated, 3rd-wave-looking
recovery, the past week-and-a-half's boringly lateral chop is first considered
a corrective/consolidative event that warns of a continuation of the uptrend
that preceded it to new highs above 04-Oct's 891.0 high. This count
remains consistent with our broader base/correction/recovery count introduced
in 13-Sep's Technical Blog following that
day's bullish divergence in short-term momentum above 07-Sep's 809.5 minor
corrective high detailed in the hourly chart below.
The
important takeaway from this month's lateral, sleepy price action is the
definition of Wed's 851.5 low as
the end or lower boundary of a suspected 4th-Wave correction. A failure
below 851.5 will confirm a bearish divergence in daily momentum and defer or
threaten a bullish count enough to warrant non-bullish decisions like
long-covers. A failure below 851.5 will not
necessarily negate a broader bullish count, but it will threaten it enough to
warrant defensive measures as the next pertinent technical levels below 851.5 are
13-Sep's prospective minor 1st-Wave high at 813.8 and obviously 08-Sep's 766.0
low. And making non-bullish decisions "down there" is
sub-optimal to say the least. Per such, both short- and longer-term
commercial traders are advised to pare or neutralize bullish exposure on a
failure below 851.5, acknowledging and accepting whipsaw risk- back above 04-Oct's
891.0 high- in exchange for much deeper and sub-optimal nominal risk below
766.0.
On
a broader scale, the daily log scale chart above shows the developing potential
for a bearish divergence in daily momentum that will be considered confirmed
below 851.5. This chart also shows the past month's recovery thus far
stalling in the immediate neighborhood of the (888.0) Fibonacci
minimum 38.2% retrace of Apr-Sep's entire 1128 - 766 decline). COMBINED
with a failure below 851.5, traders
would then need to be concerned with at least a larger-degree correction pf the
past month's rally and possibly a resumption of Apr-Sep's major downtrend.
Until
and unless the market fails below 851.5 however, we would
remind longer-term players of the key elements on which our bullish count is
predicated:
a confirmed bullish divergence in WEEKLY momentum
(below)
amidst
an
historically low 11% reading in out RJO Bullish Sentiment Index and
a
textbook complete and major 5-wave Elliott sequence down from 29-Apr's
1128 high to 08-Sep's 766.0 low.
Thus
far, the market is only a month into correcting a 4-MONTH, 32% drawdown, so
further and possibly protracted gains remain well within the bounds of a major
(suspected 2nd-Wave) correction of Apr-Sep's decline within an even more
massive PEAK/reversal process from 17-May's 1219 high on an active continuation
basis below.
These
issues considered, a bullish policy and exposure remain advised with a failure
below 851.5 required to defer or threaten this call enough to warrant moving to
a neutral/sideline position. In lieu of such weakness, we anticipate a
continuation of the past month's rally to new highs and potentially significant
gains above 891.0.
Over
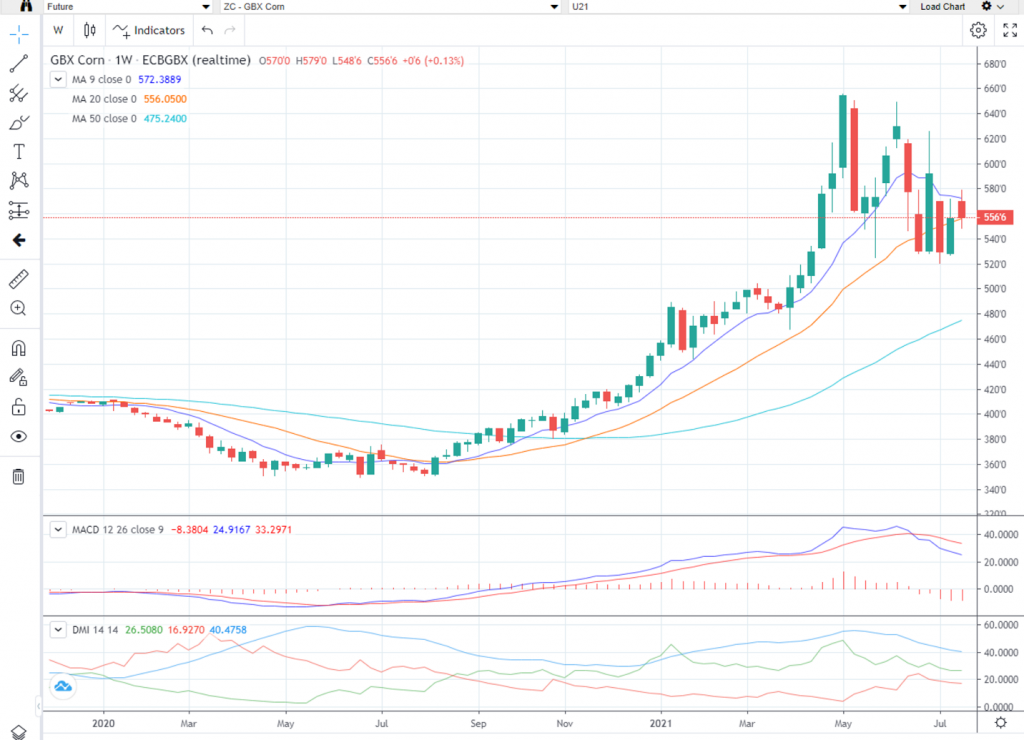
the last week, corn, KC wheat, and soybeans have continued to consolidate. September
corn did manage to make a higher high and a higher low on the weekly chart. At
the time of writing, Sept corn is trading within a .01 of last week’s closing
price and the majority of trading action this week has occurred between the 9-
and 20-week moving averages. I would suggest traders prepare to play a breakout.
The fundamentals haven’t changed much, the hot and dry mid-west weather has
continued to be front and center. The weekly range for September corn, .30 ¼
cents, is the smallest range we have seen in the last 4-months. Historically,
we usually see corn pull back around this time of year but so far that hasn’t
been the case. Watch for Monday’s Crop
Condition Report to see if the Good/Excellent rating for corn slips again which
I think is very possible. This should help
set the tone as the market looks for a fundamental catalyst.
I would suggest using an option strategy to manage your futures position risk or an outright option strategy. Implied option volatility is still relatively high compared to historical vol levels. You may want to incorporate some short options into your strategy in a calculated risk manner such as bull or bear option spreads. I have 25 years of grain market experience, please feel free to call me at 1-800-367-7290 for more details or to discuss in depth trading strategies. Also be sure to check out my past weekly grain market updates posted on our website.
Corn Sep '21 Weekly Chart If you have any questions or would like to discuss the markets further, please feel free to contact me at 800-367-7290 or msabo@rjofutures.com. Interest Rates - Delta Variant Impacting Interest Rates
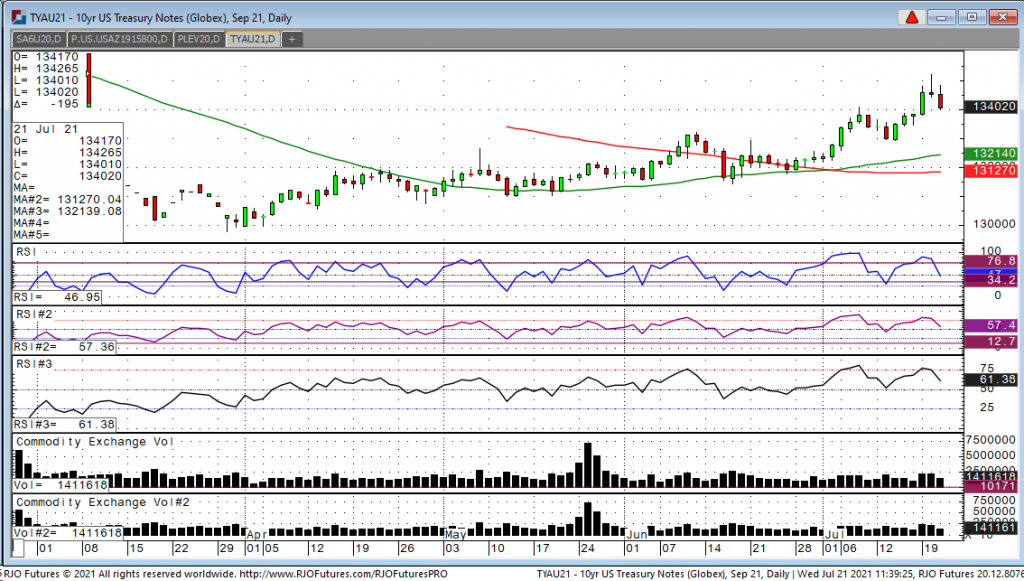
Looking at the September 10-year note, we have had a wild ride in the last week with a new high for the move coming yesterday at 135-07 and yields touching a new low for the move at 1.12. Currently, the note is trading down 25 ticks at 134-01 and yields rising to 1.29 as of this writing. The big move in volatility is due to the market thinking that the new delta variant is going to hurt the U.S. economy, but more importantly, slow down the world economy. We are not only seeing major upticks in Europe, but the U.S. as well. When the pandemic started in 2020, the U.S. was behind Europe in spreading of the virus by about 2-3 weeks. Now the key going forward, does the world economy go on another lock down or do we continue to re-open and have another mask mandate? My overall feeling is that the world economy will continue to re-open but will remain vigilant. Treasuries have been the major beneficiary of recent stock weakness but as we all saw yesterday, stocks roared back and are having another strong day to the upside. The last two days feel like we had a major short squeeze in notes and have come down in price very quickly. The market feels to me, that as bad as this variant might be along with its ease of transmission, I think it is just another temporary setback in another wise very explosive economy.
10-Year Note Sep '21 Daily Chart If you have any questions or would like to discuss the markets further, please feel free to contact me at 800-826-2270 or gperlin@rjofutures.com. Equity - New ATH in Nasdaq
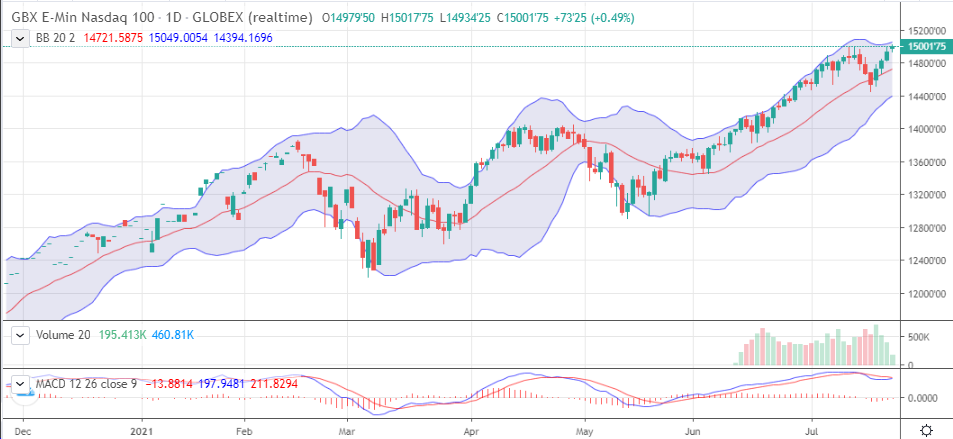
Monday’s selloff has quickly
been forgotten as the indices are pressing their highs. The concerning rate at which the Delta
variant has been spreading spooked markets, but fears of lockdowns are
subsiding as we learn more. The Dow and
S&P fell just ticks short of printing new all-time highs in the premarket,
while the Nasdaq managed to top it’s previous mark. Earnings season is once again upon us, and
the data has been strong. While it is
easy to be optimistic about the coming releases, investors have plenty to be
concerned about next week.
The two-day FOMC meeting will
be the star of the show. The committee
members have been getting more hawkish with each meeting. Traders will want to see if more members
continue to shift towards tapering sooner rather than later. Consideration of the Delta variant was cited
in yesterday’s ECB commitment to keeping rates lower for longer. Lagarde mentioned that the new variant is
likely to have a pretty dramatic impact on the recovery of industries like
travel and hospitality. Perhaps we hear
something similar from Powell on Wednesday.
Other releases of note will be Monday’s housing data, Quarter 2 GDP on Thursday, and Personal Income and PMI on Friday. Friday’s Personal Income release is when we’ll see the PCE data, which is the Fed’s favorite measure of inflation.
E-mini Nasdaq Daily Chart If you have any questions or would like to discuss the markets further, please feel free to contact me at 800-669-5354 or bdixon@rjofutures.com. Economy - S-T Mo Failure Insufficient to End RBOB Correction, But Beware
S-T Mo Failure Insufficient to End RBOB Correction, But Beware
By: RJO Market InsightsPosted 11/08/2022
Posted on Nov 08, 2022, 07:51 by Dave Toth
In Fri's Technical Webcast we identified a
minor corrective low at 2.6328 from Thur as a mini risk parameter the market
needed to sustain gains above to maintain a more immediate bullish count.
The 240-min chart below shows the market's failure overnight below this level,
confirming a bearish divergence in very short-term momentum. This mo
failure defines Fri's 2.8172 high as
one of developing importance and a parameter from which very short-term traders
can objectively base non-bullish decisions like long-covers.
Given
the magnitude of the past three weeks' broader recovery however, this
short-term momentum failure is of an insufficient scale to conclude anything
more than another correction within this broader recovery from 26-Sep's 2.1877
low. Indeed, overnights failure below 2.6328 only allows us to conclude
the end of the portion of the month-and-a-half rally from 31-Oct's 2.4822 next
larger-degree corrective low. 2.4822 is the
risk parameter this market still needs to fail below to break the uptrend from
18-Oct's 2.3526 low while this 2.3526 low
remains intact as the risk parameter this market needs to fail below to break
the month-and-a-half uptrend. From an
intermediate-to-longer-term perspective, this week's setback falls well within
the bounds of another correction ahead of further gains. This is another
excellent example of the importance of technical and trading SCALE and
understanding and matching directional risk exposure to one's personal risk
profile.
The
reason overnight's admittedly minor mo failure might have longer-term
importance is the 2.8172-area from which it stemmed. In
Fri's Technical Blog we also noted the market's engagement of the
2.8076-to-2.8159-area marked by the 61.8% retrace of Jun0-Sewp's 3.2758 -2.1877
decline and the 1.000 progression of Sep-Oct's initial 2.1877 - 2.6185
(suspected a-Wave) rally from 18-Oct's 2.3526 (suspected b-Wave) low. We
remind longer-term players that because of the unique and compelling confluence
of:
early-Aug's bearish divergence in WEEKLY momentum
amidst
historically
extreme bullish sentiment/contrary opinion levels in our RJO Bullish
Sentiment Index
an
arguably complete and massive 5-wave Elliott sequence from Mar'20's 0.4605
low to Jun's 4.3260 high (as labeled in the weekly log active-continuation
chart below) and
the
5-wave impulsive sub-division of Jun-Sep's (suspected initial 1st-Wave) decline
The
recovery attempt from 26-Sep's 2.1877 low is arguably only a 3-wave (Wave-2)
corrective rebuttal to Jun-Sep's decline within a massive, multi-quarter
PEAK/reversal process. Now granted, due to the magnitude of 2020 -2022's
secular bull market, we discussed the prospect for this (2nd-Wave corrective)
recovery to be "extensive" in terms of both price and time. A
"more extensive" correction is typified by a retracement of 61.8% or
more and spanning weeks or even months following a 3-month decline. Per
such, the (suspected corrective) recovery from 26-Sep's 2.1877 low could easily
have further to go, with commensurately larger-degree weakness than that
exhibited this week (i.e., a failure below at least 2.4822) required
to consider the correction complete. Indeed, the daily log chart above
shows the market thus far respecting former 2.6185-area resistance from 10-Oct
as a new support candidate.
These
issues considered, very shorter-term traders have been advised to move to a neutral/sideline
position following overnight's momentum failure below 2.6328, with a recovery
above 2.8172 required to negate this call, reaffirm the recovery and re-expose
potentially significant gains thereafter. For intermediate- and
longer-term players, a bullish policy and exposure remain advised with a
failure below 2.4822 required to threaten this call enough to warrant
neutralizing exposure. We will be watchful for another bearish divergence
in momentum following a recovery attempt that falls short of Fri's 2.8172 high
that would be considered the next reinforcing factor to a count calling that
2.8172 high the prospective end to the month-and-a-half 2nd-Wave
correction. In lieu of such, a resumption of the current rally to
eventual new highs above 2.8172 should not surprise.