New Special Report: Inflation, How Much is Too Much?
With so much money in the market, coupled with weakened supply chains and workforces due to the fallout of Covid-19, we are seeing a rampant run on inflation. Prices from everything to lumber, oil, and groceries are up. Learn why this is happening, how long it will go on for, and how to protect yourself with this Special Report!
4th of July: Freedom From Commissions
Receive free commissions when you open and fund an account through the month of August! This is one firecracker you don’t want to miss!
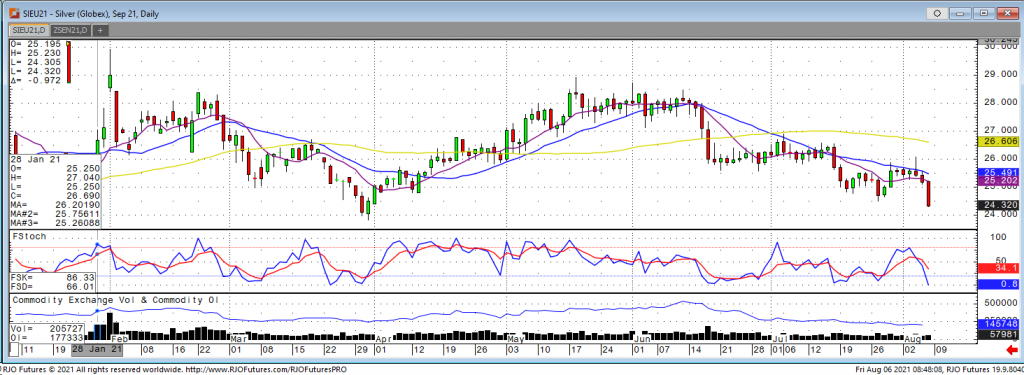
September silver starts the day lower today completely erasing the gain it made last Wednesday and Thursday. The silver market had been trading sideways, holding on to that $25 support level but once that was pushed through the market fell sharply to a low of 24.37. This morning the focus was on US economic data with nonfarm payrolls coming in well over the expected 870,000 at 943,000. This pushed stocks to new intraday highs and is weighing on the silver market. The US dollar also saw a move higher this week, reversing from last week’s lower trade which is pressuring the silver market lower as well. At the current time, the September silver market is hanging around 24.39, just off its recent lows. The next level of support is 24 but the bulls will be looking for a recovery to setup a push back above resistance at 25 next week. With the current talks of possible stagflation, fresh new all-time highs in stocks, and the flight to quality going to the US dollar the bears are in the drivers seat for the metals markets.
Silver Sep '21 Daily Chart If you have any questions or would like to discuss the markets further, please feel free to contact me at 800-826-2270 or therrmann@rjofutures.com. Energy - Oil Set for Weekly Loss Amid Renewed Demand Concerns
Oil Set for Weekly Loss Amid Renewed Demand Concerns
By: Alex Turro, Senior Market StrategistPosted Aug 6, 2021 10:05AM CT
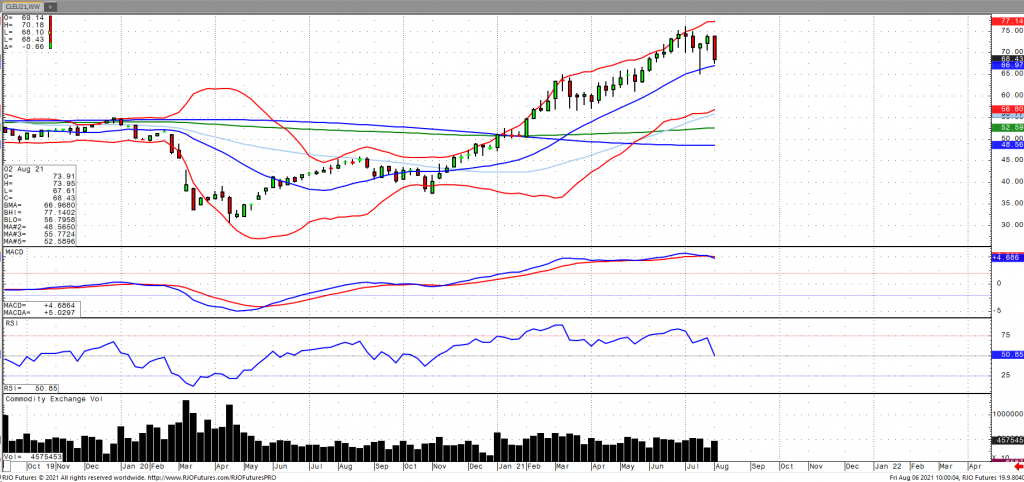
Oil prices are softer as of Friday morning and are poised for their largest weekly decline since March as demand concerns come back to the forefront amid the spread of the delta variant. This is coupled with reports that global floating storage came in at four-month highs as well weaker Asian oil imports despite an uptick in Indian demand. Crude stocks registered inventory builds in two of the last three readings with a build of 3.627 million barrels with gasoline stocks posting a larger than expected draw of -5.291 million barrels along with a strong implied gasoline reading of 9.77 million barrels per day. Most importantly, oil volatility (OVX) has broken down below 40 with yet another episodic spike in volatility into options expiration as the market remains bullish trend with today’s range seen between 67.56 – 75.24.
Crude Oil Sep '21 Weekly Chart If you have any questions or would like to discuss the markets further, please feel free to contact me at 800-438-4805 or aturro@rjofutures.com. Agricultural - Bullish Canola Count Intact Above Minimum 851.5
Bullish Canola Count Intact Above Minimum 851.5
By: RJO Market InsightsPosted 10/14/2022
Posted on Oct 14, 2022, 07:42 by Dave Toth
On
the heels of mid-Sep-to-early-Oct's steeper, accelerated, 3rd-wave-looking
recovery, the past week-and-a-half's boringly lateral chop is first considered
a corrective/consolidative event that warns of a continuation of the uptrend
that preceded it to new highs above 04-Oct's 891.0 high. This count
remains consistent with our broader base/correction/recovery count introduced
in 13-Sep's Technical Blog following that
day's bullish divergence in short-term momentum above 07-Sep's 809.5 minor
corrective high detailed in the hourly chart below.
The
important takeaway from this month's lateral, sleepy price action is the
definition of Wed's 851.5 low as
the end or lower boundary of a suspected 4th-Wave correction. A failure
below 851.5 will confirm a bearish divergence in daily momentum and defer or
threaten a bullish count enough to warrant non-bullish decisions like
long-covers. A failure below 851.5 will not
necessarily negate a broader bullish count, but it will threaten it enough to
warrant defensive measures as the next pertinent technical levels below 851.5 are
13-Sep's prospective minor 1st-Wave high at 813.8 and obviously 08-Sep's 766.0
low. And making non-bullish decisions "down there" is
sub-optimal to say the least. Per such, both short- and longer-term
commercial traders are advised to pare or neutralize bullish exposure on a
failure below 851.5, acknowledging and accepting whipsaw risk- back above 04-Oct's
891.0 high- in exchange for much deeper and sub-optimal nominal risk below
766.0.
On
a broader scale, the daily log scale chart above shows the developing potential
for a bearish divergence in daily momentum that will be considered confirmed
below 851.5. This chart also shows the past month's recovery thus far
stalling in the immediate neighborhood of the (888.0) Fibonacci
minimum 38.2% retrace of Apr-Sep's entire 1128 - 766 decline). COMBINED
with a failure below 851.5, traders
would then need to be concerned with at least a larger-degree correction pf the
past month's rally and possibly a resumption of Apr-Sep's major downtrend.
Until
and unless the market fails below 851.5 however, we would
remind longer-term players of the key elements on which our bullish count is
predicated:
a confirmed bullish divergence in WEEKLY momentum
(below)
amidst
an
historically low 11% reading in out RJO Bullish Sentiment Index and
a
textbook complete and major 5-wave Elliott sequence down from 29-Apr's
1128 high to 08-Sep's 766.0 low.
Thus
far, the market is only a month into correcting a 4-MONTH, 32% drawdown, so
further and possibly protracted gains remain well within the bounds of a major
(suspected 2nd-Wave) correction of Apr-Sep's decline within an even more
massive PEAK/reversal process from 17-May's 1219 high on an active continuation
basis below.
These
issues considered, a bullish policy and exposure remain advised with a failure
below 851.5 required to defer or threaten this call enough to warrant moving to
a neutral/sideline position. In lieu of such weakness, we anticipate a
continuation of the past month's rally to new highs and potentially significant
gains above 891.0.
By: Michael Sabo, Senior Market StrategistPosted Aug 6, 2021 11:00AM CT
I’m
going to sound like a broken record today as this update is very similar to
last week. More consolidation in the corn market and a lack of strong bullish
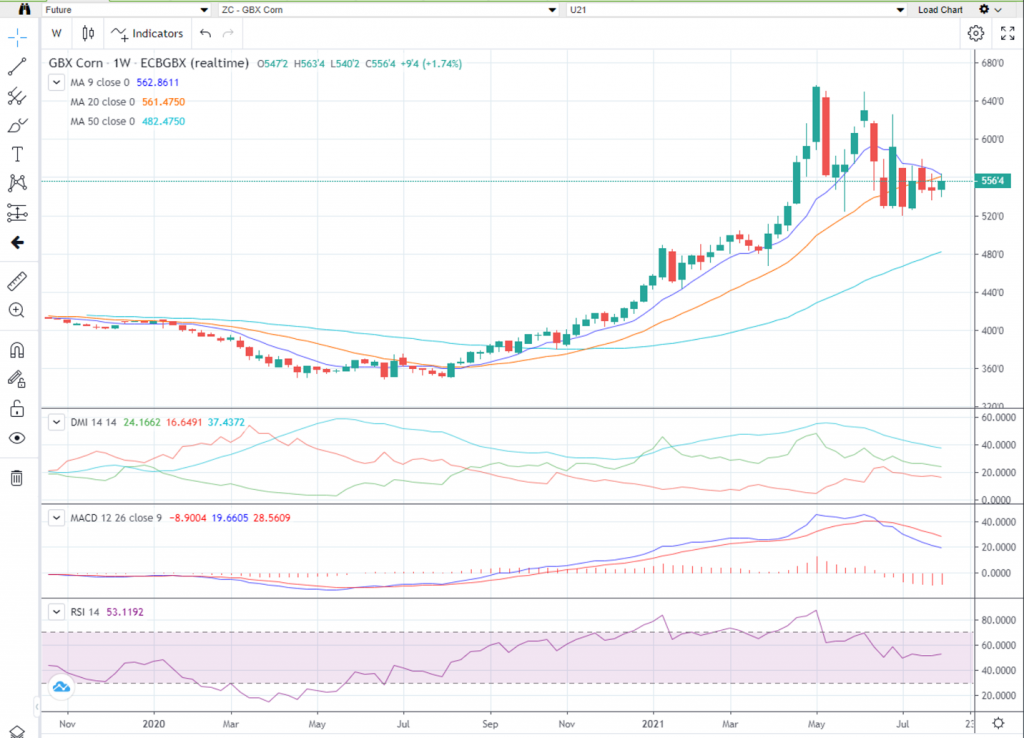
or bearish news to justify a breakout. September
corn is showing a strong consolidation pattern on the weekly chart (see below)
as it currently trades inside last week’s price range. In the last market
update, I advised traders to watch for changes in Monday’s Crop Condition Report.
Well that report showed a drop in the good to excellent category from 64 to 62,
most traders expected to see a drop to only 63, so this report was considered
favorable to the bulls. As I mentioned last week, historically we usually see
corn sell off around this time of year but so far that hasn’t been the case,
instead the market searches for clear direction. The longer the consolidation
lasts, the larger the move we expect to see, only time will tell. Watch for Monday’s Crop Condition Report to see
if the Good/Excellent rating for corn slips again. I think the “real” move will
come from the August 12th USDA Supply/Demand Report and Crop
Production. Watch for the USDA to possibly lower yields from the 179.5 number,
the big question remains, by how much?
Key
numbers to watch in my opinion are: $5.81 ½ on the upside and $5.19 ½ on the
downside.
I would suggest using an option strategy to manage your futures position risk or an outright option strategy. Implied option volatility is still relatively high compared to historical vol levels. You may want to incorporate some short options into your strategy in a calculated risk manner such as bull or bear option spreads. I have 25 years of grain market experience, please feel free to call me at 1-800-367-7290 for more details or to discuss in depth trading strategies. Also be sure to check out my past weekly grain market updates posted on our website.
Corn Sep '21 Weekly Chart If you have any questions or would like to discuss the markets further, please feel free to contact me at 800-367-7290 or msabo@rjofutures.com. Interest Rates - 10-Year Note Hits Contract High
Looking at the September 10-year note, we hit a contract
high early this morning at 135-14 and touched a yearly low in yield at 1.127.
We are currently trading at 124-25 and yield is 1.195. The reason for this
morning’s rally was the weaker than expected ADP payroll number and worries
that Friday’s employment number may also come in weaker than what the street is
forecasting. Things have since reversed due to the very hawkish speech that Fed
Vice-Chair Clarida gave late this morning. He believes the Fed should begin to
taper as early as July, meaning the Fed should stop buying bonds and keeping
interest rates artificially low. The Fed has hinted that they will give the
market a heads up when that thought process is to occur so we will have to see
when that does happen. My best hypothesis is that if we see a big employment
number on Friday morning, upwards of a million new jobs, the treasury market
will dictate exactly when the Fed will make the taper announcement. Looking at
technicals for the Sep note, we see resistance at today’s high of 135-14 and
support around 134-04. I will say, if the note does close lower in the day
after making a new high, that indicates an island reversal and we may not see
another high for quite some time.
If you have any questions or would like to discuss the markets further, please feel free to contact me at 800-826-2270 or gperlin@rjofutures.com. Equity - Jobs Data Beats Estimates
Jobs Data Beats Estimates
By: Bill Dixon, Senior Market StrategistPosted Aug 6, 2021 9:44AM CT
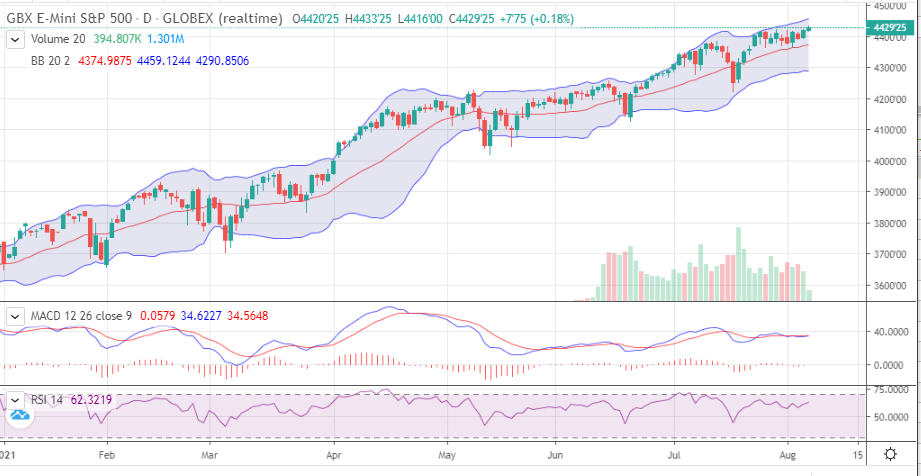
The economy added 943k jobs
last month, which is the largest gain since last August. The unemployment rate ticked down to 5.4% vs.
an expected 5.7%. Readings like these
will ignite the tapering conversations once again as it indicates a step closer
to Powell’s full employment wishes. We’re obviously not quite where he’d like
yet, but it is hard to suggest that things aren’t progressing.
As the delta variant
continues to make news, it will be interesting to see how things take shape. Mask
mandates (even for vaccinated individuals) seem to be coming back, many
corporations, businesses, etc. are mandating vaccinations, and lockdowns could
be back on the table. The workforce is
much better prepared for work from home than we were back in early 2020, so I
doubt such actions will have as dramatic an effect on the markets as they did
then. However, they could certainly call into question whether the “reopening”
remains “open.”
Stocks are mixed following the report. The S&P and Dow managed to print new all-time highs and are up on the day, while the Nasdaq fell a bit shy and is down about 1/3 of a percent. The Russell is trading in positive territory, but has a ways to go before printing new highs.
E-mini S&P 500 Daily Chart If you have any questions or would like to discuss the markets further, please feel free to contact me at 800-669-5354 or bdixon@rjofutures.com. Economy - S-T Mo Failure Insufficient to End RBOB Correction, But Beware
S-T Mo Failure Insufficient to End RBOB Correction, But Beware
By: RJO Market InsightsPosted 11/08/2022
Posted on Nov 08, 2022, 07:51 by Dave Toth
In Fri's Technical Webcast we identified a
minor corrective low at 2.6328 from Thur as a mini risk parameter the market
needed to sustain gains above to maintain a more immediate bullish count.
The 240-min chart below shows the market's failure overnight below this level,
confirming a bearish divergence in very short-term momentum. This mo
failure defines Fri's 2.8172 high as
one of developing importance and a parameter from which very short-term traders
can objectively base non-bullish decisions like long-covers.
Given
the magnitude of the past three weeks' broader recovery however, this
short-term momentum failure is of an insufficient scale to conclude anything
more than another correction within this broader recovery from 26-Sep's 2.1877
low. Indeed, overnights failure below 2.6328 only allows us to conclude
the end of the portion of the month-and-a-half rally from 31-Oct's 2.4822 next
larger-degree corrective low. 2.4822 is the
risk parameter this market still needs to fail below to break the uptrend from
18-Oct's 2.3526 low while this 2.3526 low
remains intact as the risk parameter this market needs to fail below to break
the month-and-a-half uptrend. From an
intermediate-to-longer-term perspective, this week's setback falls well within
the bounds of another correction ahead of further gains. This is another
excellent example of the importance of technical and trading SCALE and
understanding and matching directional risk exposure to one's personal risk
profile.
The
reason overnight's admittedly minor mo failure might have longer-term
importance is the 2.8172-area from which it stemmed. In
Fri's Technical Blog we also noted the market's engagement of the
2.8076-to-2.8159-area marked by the 61.8% retrace of Jun0-Sewp's 3.2758 -2.1877
decline and the 1.000 progression of Sep-Oct's initial 2.1877 - 2.6185
(suspected a-Wave) rally from 18-Oct's 2.3526 (suspected b-Wave) low. We
remind longer-term players that because of the unique and compelling confluence
of:
early-Aug's bearish divergence in WEEKLY momentum
amidst
historically
extreme bullish sentiment/contrary opinion levels in our RJO Bullish
Sentiment Index
an
arguably complete and massive 5-wave Elliott sequence from Mar'20's 0.4605
low to Jun's 4.3260 high (as labeled in the weekly log active-continuation
chart below) and
the
5-wave impulsive sub-division of Jun-Sep's (suspected initial 1st-Wave) decline
The
recovery attempt from 26-Sep's 2.1877 low is arguably only a 3-wave (Wave-2)
corrective rebuttal to Jun-Sep's decline within a massive, multi-quarter
PEAK/reversal process. Now granted, due to the magnitude of 2020 -2022's
secular bull market, we discussed the prospect for this (2nd-Wave corrective)
recovery to be "extensive" in terms of both price and time. A
"more extensive" correction is typified by a retracement of 61.8% or
more and spanning weeks or even months following a 3-month decline. Per
such, the (suspected corrective) recovery from 26-Sep's 2.1877 low could easily
have further to go, with commensurately larger-degree weakness than that
exhibited this week (i.e., a failure below at least 2.4822) required
to consider the correction complete. Indeed, the daily log chart above
shows the market thus far respecting former 2.6185-area resistance from 10-Oct
as a new support candidate.
These
issues considered, very shorter-term traders have been advised to move to a neutral/sideline
position following overnight's momentum failure below 2.6328, with a recovery
above 2.8172 required to negate this call, reaffirm the recovery and re-expose
potentially significant gains thereafter. For intermediate- and
longer-term players, a bullish policy and exposure remain advised with a
failure below 2.4822 required to threaten this call enough to warrant
neutralizing exposure. We will be watchful for another bearish divergence
in momentum following a recovery attempt that falls short of Fri's 2.8172 high
that would be considered the next reinforcing factor to a count calling that
2.8172 high the prospective end to the month-and-a-half 2nd-Wave
correction. In lieu of such, a resumption of the current rally to
eventual new highs above 2.8172 should not surprise.
Economy - Futures Market Outlook w/John Caruso - 08/04/2021
Futures Market Outlook w/John Caruso - 08/04/2021
By: John Caruso, Senior Market StrategistPosted Aug 4, 2021 2:41PM CT
John Caruso talks about latest news in the futures markets today including some hinting at tapering from Fed Vice-Chair Clarida's comments this morning. If you have any questions or would like to discuss the markets further, please feel free to contact me at 800-669-5354 or jcaruso@rjofutures.com.