New Special Report: Inflation, How Much is Too Much?
With so much money in the market, coupled with weakened supply chains and workforces due to the fallout of Covid-19, we are seeing a rampant run on inflation. Prices from everything to lumber, oil, and groceries are up. Learn why this is happening, how long it will go on for, and how to protect yourself with this Special Report!
The Markets
Metals - Gold Struggles to Rally
Gold Struggles to Rally
By: Frank J. Cholly, Senior Market StrategistPosted Sep 2, 2021 9:18AM CT
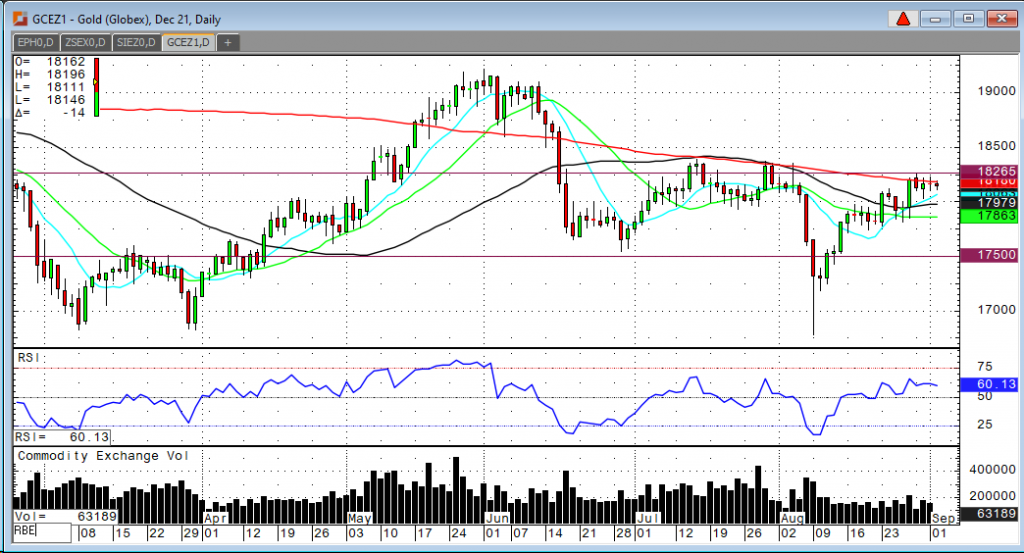
Unfortunately for the gold bulls we are going to have to see some weak economic data or “bad” news for gold prices to break out above the $1,825 to $1,830 range. The gold market has lost its luster after the initial euphoria of a “dovish” fed at the virtual Davos symposium. The gold traders are now starting to realize that we are probably closer to tapering than what they would like. Tapering does not equal rate hikes though, and the Fed is still at emergency levels of liquidity. The supply chain is still faltering, and people are still being paid more to stay home than to go to work. Surging Covid cases and mask mandates are keeping a lid on the economy and that’s the only reason that gold is still above $1,800 in my opinion. I remain long term bullish on gold, however, I still believe that the market may still need to move lower again first. Perhaps to $1,750 or even $1,720
Gold Dec '21 Daily Chart If you have any questions or would like to discuss the markets further, please feel free to contact me at 800-826-4124 or fcholly@rjofutures.com. Metals - Silver Waiting on Nonfarm Payrolls
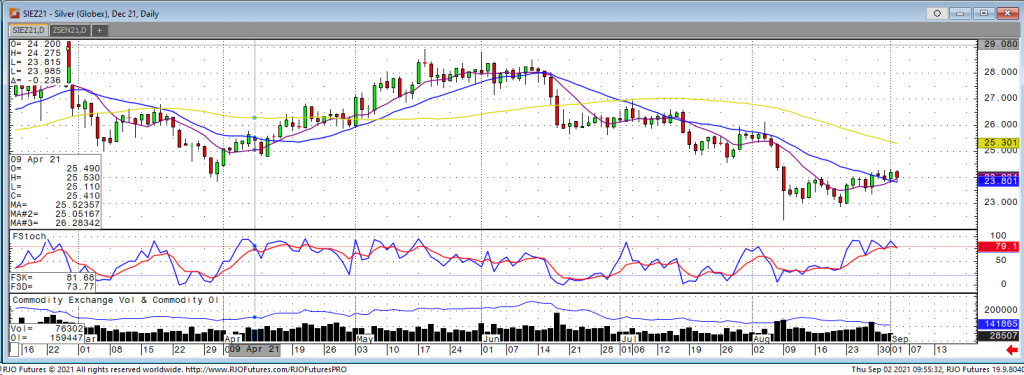
The December silver contract saw a recovery last week off the $23 support level but was unable to continue that this week. Although the market has held at resistance here, it has been unable to push through 24.30 and continue the trend higher. Weakness in the US dollar should be providing support as it did last week but the market seemed to care less about the dollar’s continued slide lower. The silver market is awaiting Friday’s nonfarm payrolls where a favorable number would bring tapering talks back in center focus for the Fed. The bears still look to be in control, and it looks like choppy trade will continue in the near term with last week’s rally not being significant enough to reverse the trend and push the market through the key $24 level. A break of Tuesday’s low of $23.83 would push the market back down to support around $23. However, if trade can push the market above $24.30 the market could see a move higher to $24.80 and then $25.00 as the next areas of resistance. Back and forth trad looks to continue until some fundamental news can give silver the push it needs to extend a move in one direction.
Silver Dec '21 Daily Chart If you have any questions or would like to discuss the markets further, please feel free to contact me at 800-826-2270 or therrmann@rjofutures.com. Energy - WTI Back Over $70 a Barrel
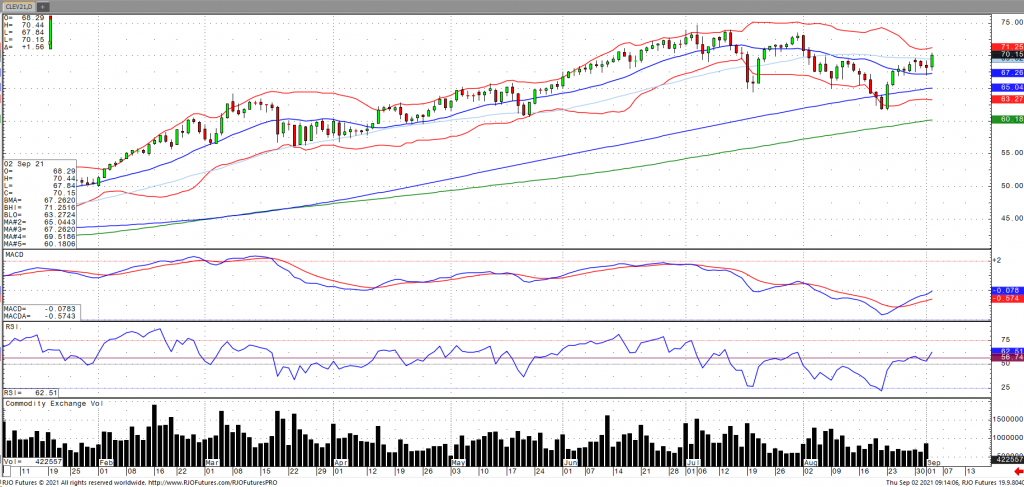
Oil prices are ramping higher as of Thursday morning powered by ongoing concerns regarding restricted oil production in the Gulf with reports of 80% of output still down coupled with a sharp decline in oil inventories. US inventories reported a draw of 7.169 million barrels and are now -73.006 million barrels below last year and -27.795 million barrels below the five-year average. OPEC+ agreed on Wednesday to continue phasing out production restraints by adding 400k barrels per day in October while simultaneously raising their demand forecast for 2022. Further lending support are reports that Russian oil output declined last month as well as continuation in weakness in the US Dollar. The US dollar is now carrying a strong inverse correlation of -0.90 on a 15-day duration. Oil volatility (OVX) has continued to fall into the low to mid 30s with the market remaining bullish trend with today’s range seen between 63.15 – 71.67.
Crude Oil Oct '21 Daily Chart If you have any questions or would like to discuss the markets further, please feel free to contact me at 800-438-4805 or aturro@rjofutures.com. Softs - Slow Grind Higher in Coffee, With Focus on a Tighter 2022
Slow Grind Higher in Coffee, With Focus on a Tighter 2022
Bullish developments in several areas should continue to
provide underlying support, so coffee is unlikely to fall sharply from its
current price levels in front of the holiday weekend. A weaker Brazilian currency
played a key role in coffee finishing the day in negative territory as that may
encourage brazils farmers to market their remaining near-term supply to foreign
customers.
The international coffee organization said that this seasons
global Arabica exports through the end of July came in at 82.63 million bags
which compares with 78.89 million at the same point last year. Brazil’s green
coffee exports last month came in at 172,242 tonnes which compares with 191,124
tonnes during August of 2020.
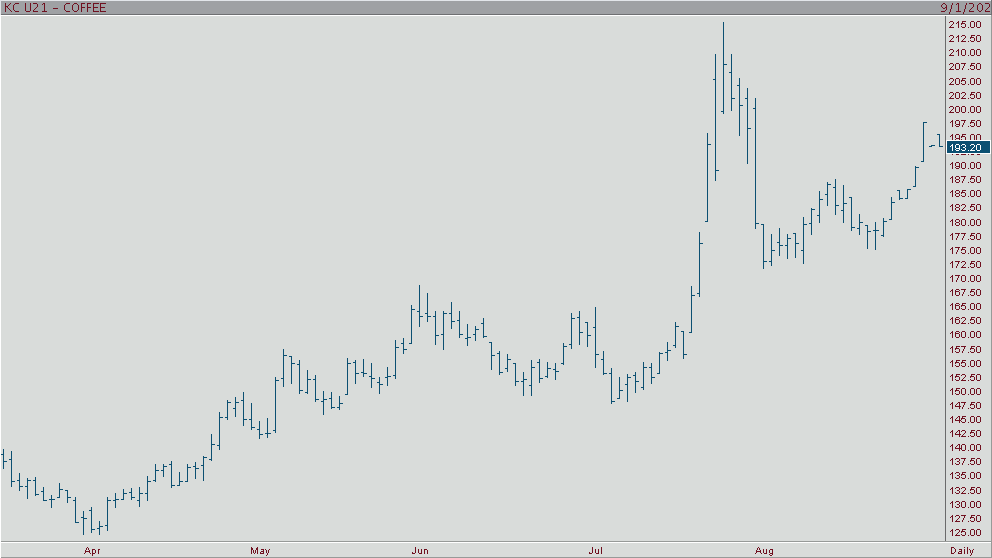
Rising stochastics at overbought levels warrant some caution for bulls. A positive signal for trend short term was given on a close over the 9 -ay moving average. Near term upside objective is 20120. The next level of resistance is around 19810 and 20120, while the first support comes in at 19310 and 19110.
Coffee Sep '21 Daily Chart If you have any questions or would like to discuss the markets further, please feel free to contact me at 800-826-2270 or tcholly@rjofutures.com. Agricultural - Bullish Canola Count Intact Above Minimum 851.5
Bullish Canola Count Intact Above Minimum 851.5
By: RJO Market InsightsPosted 10/14/2022
Posted on Oct 14, 2022, 07:42 by Dave Toth
On
the heels of mid-Sep-to-early-Oct's steeper, accelerated, 3rd-wave-looking
recovery, the past week-and-a-half's boringly lateral chop is first considered
a corrective/consolidative event that warns of a continuation of the uptrend
that preceded it to new highs above 04-Oct's 891.0 high. This count
remains consistent with our broader base/correction/recovery count introduced
in 13-Sep's Technical Blog following that
day's bullish divergence in short-term momentum above 07-Sep's 809.5 minor
corrective high detailed in the hourly chart below.
The
important takeaway from this month's lateral, sleepy price action is the
definition of Wed's 851.5 low as
the end or lower boundary of a suspected 4th-Wave correction. A failure
below 851.5 will confirm a bearish divergence in daily momentum and defer or
threaten a bullish count enough to warrant non-bullish decisions like
long-covers. A failure below 851.5 will not
necessarily negate a broader bullish count, but it will threaten it enough to
warrant defensive measures as the next pertinent technical levels below 851.5 are
13-Sep's prospective minor 1st-Wave high at 813.8 and obviously 08-Sep's 766.0
low. And making non-bullish decisions "down there" is
sub-optimal to say the least. Per such, both short- and longer-term
commercial traders are advised to pare or neutralize bullish exposure on a
failure below 851.5, acknowledging and accepting whipsaw risk- back above 04-Oct's
891.0 high- in exchange for much deeper and sub-optimal nominal risk below
766.0.
On
a broader scale, the daily log scale chart above shows the developing potential
for a bearish divergence in daily momentum that will be considered confirmed
below 851.5. This chart also shows the past month's recovery thus far
stalling in the immediate neighborhood of the (888.0) Fibonacci
minimum 38.2% retrace of Apr-Sep's entire 1128 - 766 decline). COMBINED
with a failure below 851.5, traders
would then need to be concerned with at least a larger-degree correction pf the
past month's rally and possibly a resumption of Apr-Sep's major downtrend.
Until
and unless the market fails below 851.5 however, we would
remind longer-term players of the key elements on which our bullish count is
predicated:
a confirmed bullish divergence in WEEKLY momentum
(below)
amidst
an
historically low 11% reading in out RJO Bullish Sentiment Index and
a
textbook complete and major 5-wave Elliott sequence down from 29-Apr's
1128 high to 08-Sep's 766.0 low.
Thus
far, the market is only a month into correcting a 4-MONTH, 32% drawdown, so
further and possibly protracted gains remain well within the bounds of a major
(suspected 2nd-Wave) correction of Apr-Sep's decline within an even more
massive PEAK/reversal process from 17-May's 1219 high on an active continuation
basis below.
These
issues considered, a bullish policy and exposure remain advised with a failure
below 851.5 required to defer or threaten this call enough to warrant moving to
a neutral/sideline position. In lieu of such weakness, we anticipate a
continuation of the past month's rally to new highs and potentially significant
gains above 891.0.
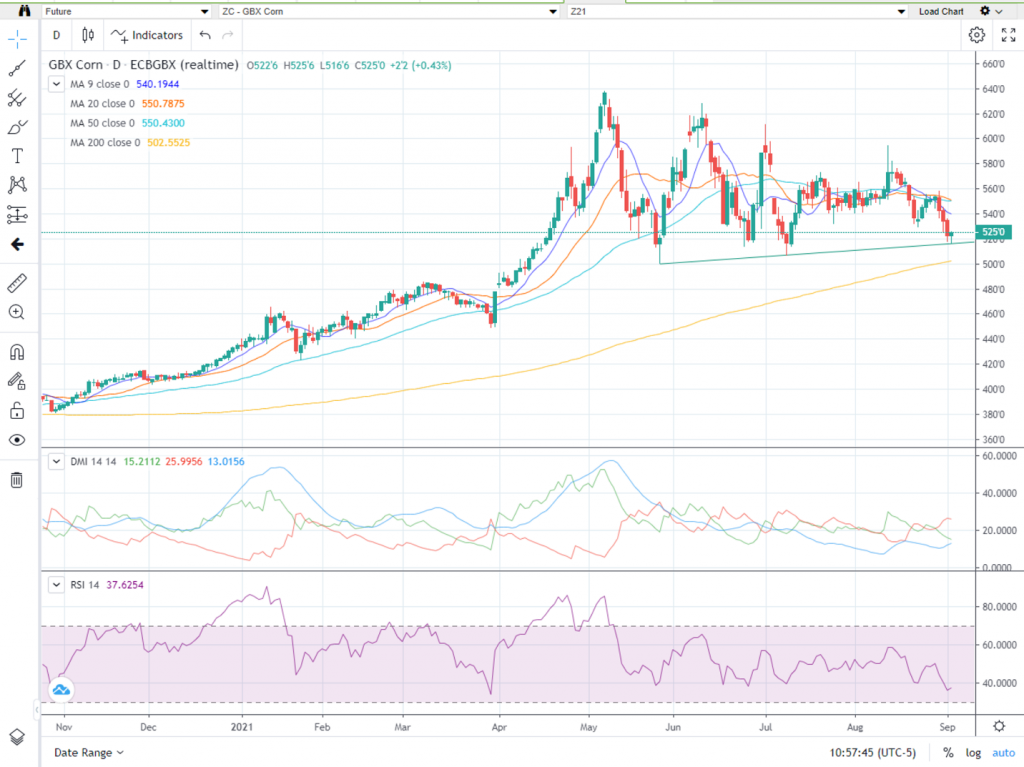
After
a solid finish last week December corn has pulled back slightly this week to a
support area. Dec corn continues to trade inside the bigger range. It’s
important to note that we are finally seeing a carry come back into the market
as the September-December corn spread is trading around -8 cents, the best we
have seen it since all year! The Crop progress Report that was released on
Monday showed no change in the good to excellent category and stood at 60%. In
last week’s article I mentioned “This came to fruition so far this week with
corn gaining about 15 cents from last weeks close and I believe there is more
to come next week.” So far, we have not seen any additional upside but we
also have not seen a major failure.
In
previous articles I advised the key numbers to watch were $5.81 ½ on the upside
and $5.19 ½ on the downside but that was based on September corn. The key
numbers, I believe to watch, for December corn are $4.99 on the downside and
$6.39 ½ on the upside – basically a breakout on the monthly chart. Those
numbers are based off December corn month of May high and low. Every month
since then has been inside May’s trading range. There are several, what I
consider, minor areas of support and resistance inside that range that can help
with short term market direction if violated. Call me at 1-800-367-7290 for
more in-depth discussion on these numbers.
I would suggest using an option strategy to manage your futures position risk or an outright option strategy. Implied option volatility recently came down but is still relatively high compared to historical vol levels. You may want to incorporate some short options into your strategy in a calculated risk manner such as bull or bear option spreads. I have 25 years of grain market experience, please feel free to call me at 1-800-367-7290 for more details or to discuss in depth trading strategies. Also be sure to check out my past weekly grain market updates posted on our website.
Corn Dec '21 Daily Chart If you have any questions or would like to discuss the markets further, please feel free to contact me at 800-367-7290 or msabo@rjofutures.com. Interest Rates - Interest Rates Trading in a Range
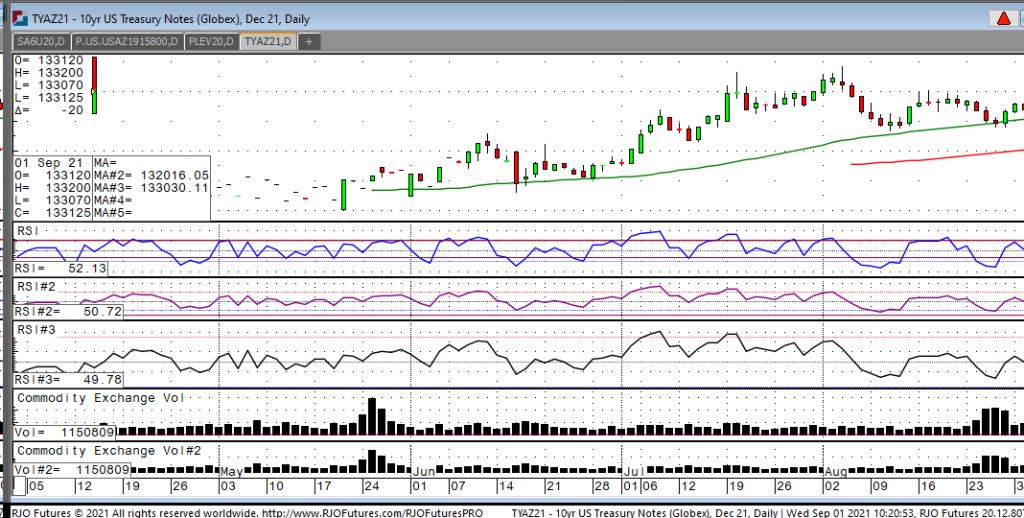
Looking at the December note, we have a very narrow range today with a high of 133-20 and a low of 123-07 and are currently trading at 133-13. The market is setting to digest some key economic numbers that began today. We had ADP employment and ISM manufacturing early this morning with the reading at 374K which was a big miss as the street was looking for 613K, on the upside, the ISM came out a tad better than expected at 59.9 vs 58.6. There is no doubt the numbers we have seen in the past few weeks are due to the presence of the Delta variant. It’s too early to know for sure if this is the start of a weakening economy or just a pause of the powerful and strong numbers that we have seen since early summer. Last week, many fed governors were on tape stating they would like to see the fed start to taper, which is the fed buying bonds to keep rates artificially low. As the economy has shown overall to be very resilient many wish the fed would stop. The problem with their view is that the Fed stated that they still see risks in the economy and indicated that a taper was not imminent. So, we have dissent from many fed governors and Chairman Powell which is not allowing traders to get a firm handle on the next move in treasuries. Friday is the monthly employment report and if it comes in stronger than expected, one should anticipate a sharp rise in yields and lower prices.
10-Year Note Dec '21 Daily Chart If you have any questions or would like to discuss the markets further, please feel free to contact me at 800-826-2270 or gperlin@rjofutures.com. Equity - Stocks Higher Ahead of Jobs Data
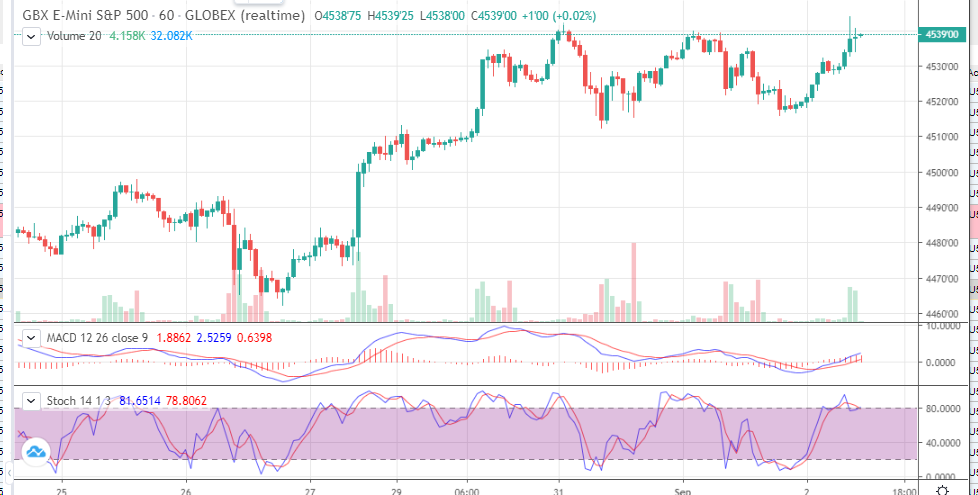
Chances are you’ve already
heard that we’ll see the non-farm payroll data for August tomorrow. Market participants are anxiously awaiting
the data as it is the most important release between now and the FOMC meeting
that takes place 9/21 & 9/22. Fed
Chair Powell continues to insist upon seeing better employment figures before
he’d consider tapering. Tomorrow’s
figures will help traders determine whether or not the Fed is likely to
announce tapering later this month or if they’ll hold off until the November
meeting. Today’s jobless claims data was
encouraging, coming in at the low end of expecations (340K). That figure is the lowest since the pandemic
began about a year and a half ago.
Estimates are calling for about 740k jobs added tomorrow and an unemployment rate of 5.2%. While the headline figure would be down from July (943k), that would be another solid reading. Many market participants seem to be hoping for a more tepid reading in hopes it will force Powell to hold off until the November meeting. With uncertainties still abound concerning the delta variant and unemployment benefits ending in a matter of days, I think that crowd may get their way regardless. A blowout number (amongst other factors) may force his hand, but I wouldn’t be surprised to hear him cite these issues as reasons to hold off until November either.
E-mini S&P 500 60 Min Chart If you have any questions or would like to discuss the markets further, please feel free to contact me at 800-669-5354 or bdixon@rjofutures.com. Economy - S-T Mo Failure Insufficient to End RBOB Correction, But Beware
S-T Mo Failure Insufficient to End RBOB Correction, But Beware
By: RJO Market InsightsPosted 11/08/2022
Posted on Nov 08, 2022, 07:51 by Dave Toth
In Fri's Technical Webcast we identified a
minor corrective low at 2.6328 from Thur as a mini risk parameter the market
needed to sustain gains above to maintain a more immediate bullish count.
The 240-min chart below shows the market's failure overnight below this level,
confirming a bearish divergence in very short-term momentum. This mo
failure defines Fri's 2.8172 high as
one of developing importance and a parameter from which very short-term traders
can objectively base non-bullish decisions like long-covers.
Given
the magnitude of the past three weeks' broader recovery however, this
short-term momentum failure is of an insufficient scale to conclude anything
more than another correction within this broader recovery from 26-Sep's 2.1877
low. Indeed, overnights failure below 2.6328 only allows us to conclude
the end of the portion of the month-and-a-half rally from 31-Oct's 2.4822 next
larger-degree corrective low. 2.4822 is the
risk parameter this market still needs to fail below to break the uptrend from
18-Oct's 2.3526 low while this 2.3526 low
remains intact as the risk parameter this market needs to fail below to break
the month-and-a-half uptrend. From an
intermediate-to-longer-term perspective, this week's setback falls well within
the bounds of another correction ahead of further gains. This is another
excellent example of the importance of technical and trading SCALE and
understanding and matching directional risk exposure to one's personal risk
profile.
The
reason overnight's admittedly minor mo failure might have longer-term
importance is the 2.8172-area from which it stemmed. In
Fri's Technical Blog we also noted the market's engagement of the
2.8076-to-2.8159-area marked by the 61.8% retrace of Jun0-Sewp's 3.2758 -2.1877
decline and the 1.000 progression of Sep-Oct's initial 2.1877 - 2.6185
(suspected a-Wave) rally from 18-Oct's 2.3526 (suspected b-Wave) low. We
remind longer-term players that because of the unique and compelling confluence
of:
early-Aug's bearish divergence in WEEKLY momentum
amidst
historically
extreme bullish sentiment/contrary opinion levels in our RJO Bullish
Sentiment Index
an
arguably complete and massive 5-wave Elliott sequence from Mar'20's 0.4605
low to Jun's 4.3260 high (as labeled in the weekly log active-continuation
chart below) and
the
5-wave impulsive sub-division of Jun-Sep's (suspected initial 1st-Wave) decline
The
recovery attempt from 26-Sep's 2.1877 low is arguably only a 3-wave (Wave-2)
corrective rebuttal to Jun-Sep's decline within a massive, multi-quarter
PEAK/reversal process. Now granted, due to the magnitude of 2020 -2022's
secular bull market, we discussed the prospect for this (2nd-Wave corrective)
recovery to be "extensive" in terms of both price and time. A
"more extensive" correction is typified by a retracement of 61.8% or
more and spanning weeks or even months following a 3-month decline. Per
such, the (suspected corrective) recovery from 26-Sep's 2.1877 low could easily
have further to go, with commensurately larger-degree weakness than that
exhibited this week (i.e., a failure below at least 2.4822) required
to consider the correction complete. Indeed, the daily log chart above
shows the market thus far respecting former 2.6185-area resistance from 10-Oct
as a new support candidate.
These
issues considered, very shorter-term traders have been advised to move to a neutral/sideline
position following overnight's momentum failure below 2.6328, with a recovery
above 2.8172 required to negate this call, reaffirm the recovery and re-expose
potentially significant gains thereafter. For intermediate- and
longer-term players, a bullish policy and exposure remain advised with a
failure below 2.4822 required to threaten this call enough to warrant
neutralizing exposure. We will be watchful for another bearish divergence
in momentum following a recovery attempt that falls short of Fri's 2.8172 high
that would be considered the next reinforcing factor to a count calling that
2.8172 high the prospective end to the month-and-a-half 2nd-Wave
correction. In lieu of such, a resumption of the current rally to
eventual new highs above 2.8172 should not surprise.