Looking to diversify your investment portfolio with futures trading, but lack the expertise on your own? Trading Systems and their programs are now listed on our website complete with track records, products traded and minimum account requirements and fees. If you need help navigating the site and viewing the results, give us a call.
New: Micro Bitcoin Investor Kit
Bitcoin is on an unprecedented run and is at the forefront of the trend in cryptocurrency and as a response, the CME has released a micro Bitcoin futures contract that is 1/10th the size of a regular Bitcoin futures contract. Learn everything you need to trade the micro Bitcoin futures contract with this Investor Kit!
The Markets
Metals - Can Gold Finally Breakout to the Upside
Can Gold Finally Breakout to the Upside
By: Frank J. Cholly, Senior Market StrategistPosted Oct 22, 2021 8:56AM CT
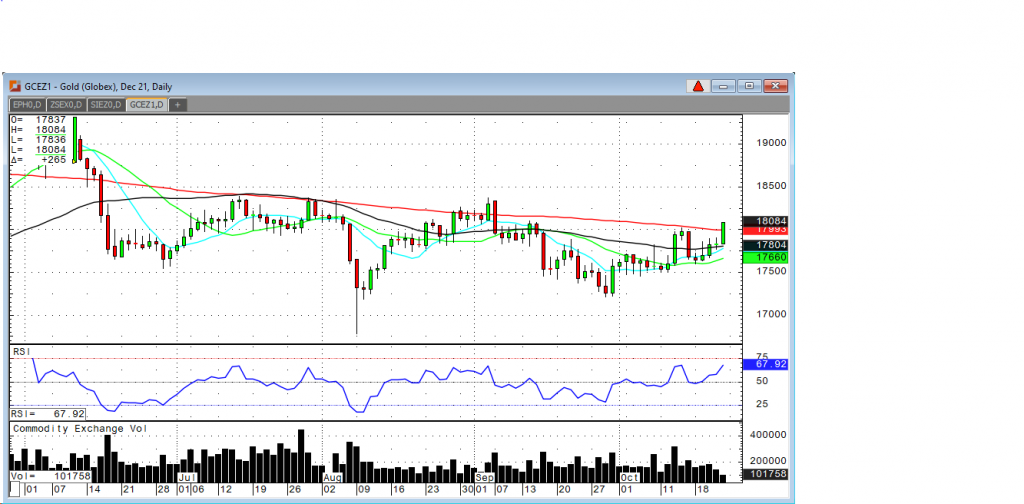
It is still too early to say for sure, but gold does look like it’s about to breakout above the 200-day moving average. A close above $1,800 would be very positive for the gold bulls and considered a technical breakout. Of course, we will need to see a confirmation with another day or two of follow thru to the upside. It’s important to note that the treasury yields have been trending higher as inflation becomes undeniable and longer lasting. So, one could conclude that gold’s rally is a sign of inflation fears. Gold is the “inflationary hedge” and it is just a matter of time before gold moves higher due to inflation really heating up. I’m surprised that it has taken so long. But, again, I must stress the importance of a confirmation that the breakout is real. At the time of this writing (Friday morning) December gold is trading at $1,808. It’s early and I need to see a close up here. Followed by another close above $1,800. It will be inflationary fears that drive the next big bull market in gold.
Gold Dec '21 Daily Chart If you have any questions or would like to discuss the markets further, please feel free to contact me at 800-826-4124 or fcholly@rjofutures.com. Metals - By: Eli Tesfaye, Senior Market StrategistPosted Oct 22, 2021 11:28AM CT
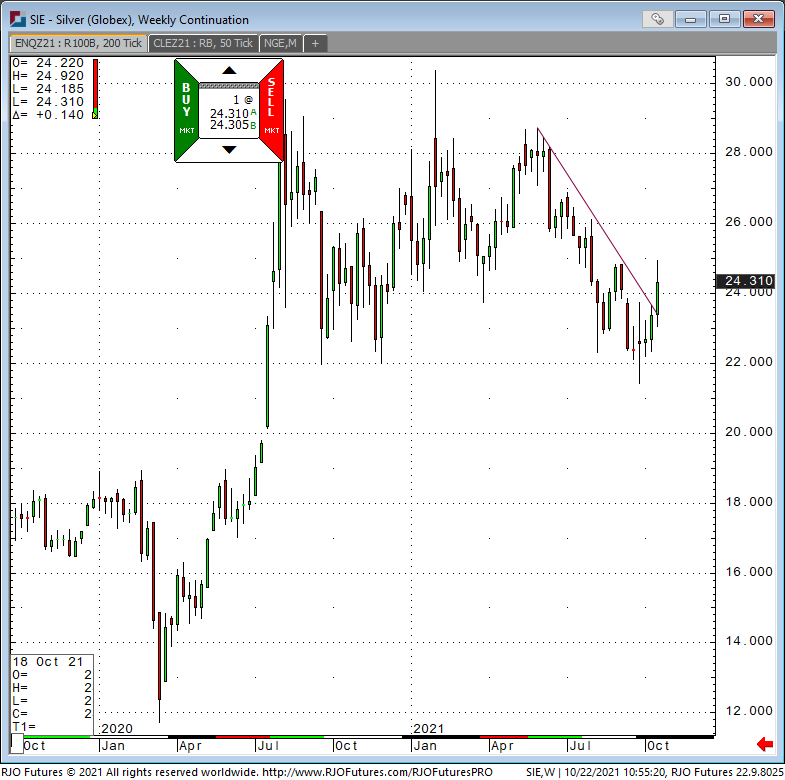
December contract silver futures are up 15-cents, trading around $24.30. The trade is turning up as per the weekly chart below. From my analysis, pulling back from these levels would be seen as buying rather than selling. The Hightower report this morning mentioned those Fed members are expressing concerns over inflation. If you have been to grocery stores recently, you could sense that things are a touch more expensive than they used to be, even from six months ago. More on this another time. From the technical perspective, markets are turning up. Give me a call or email me. I have recommendations in March silver that I would be happy to discuss over the phone. Have a great weekend!
Silver Weekly Chart If you have any questions or would like to discuss the markets further, please feel free to contact me at 800-367-7290 or etesfaye@rjofutures.com. Energy - Oil Set for 7th Consecutive Weekly Gain
Oil Set for 7th Consecutive Weekly Gain
By: RJOF Editorial TeamPosted 10/22/2021
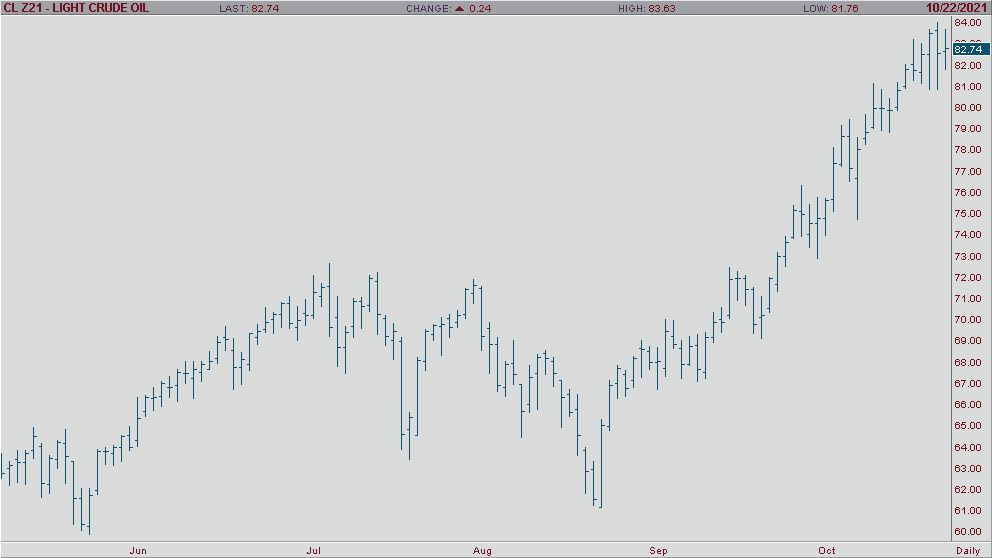
The price of crude oil has risen above $85 a barrel and the commodity is set to make its 7th consecutive weekly gain. Crude oil hit a 3-year high on Thursday and continued to ride the escalator up making a 92-cent gain early Friday morning before settling around $82.78 for the December contract at the time of this writing. The gas shortage in Europe is a huge influencer on this current run, and with winter coming, it doesn’t appear it will end anytime soon. Investors seem to agree that as global energy demand is high, there is little reason to be short on crude oil. Crude is seemingly on a one way trip to the top and there doesn’t appear to be signs of it slowing down. Stay tuned for further updates.
Crude Oil Dec '21 Daily ChartSofts - Cocoa Demand and Production Outlook
Cocoa Demand and Production Outlook
By: Peter MoosesPosted 10/22/2021
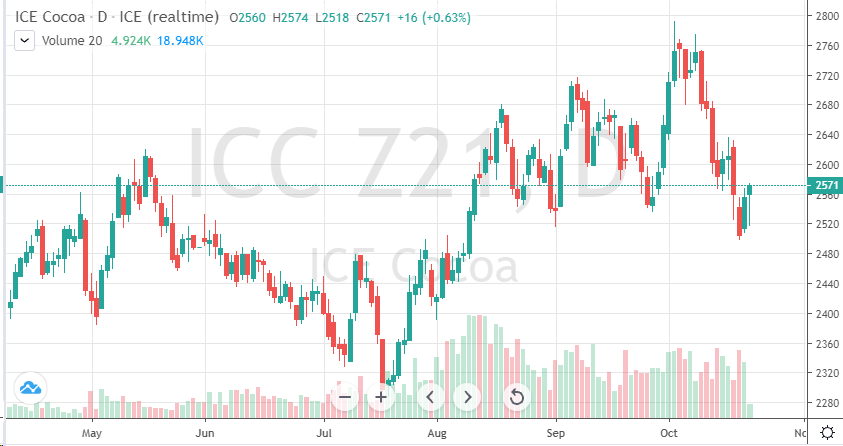
Cocoa
prices in the December futures have pulled back, dropping below 2500 recently.
Longer-term demand is strengthening is most areas of the world. Asian grinding
data came in weaker than expected -bringing prices down to support levels but
prices should recover in Q4. Weather is a big question for Ivory Coast. Will
too much rain hurt production? Will there be enough cocoa to support the
increase in demand for 2022? These factors all come into play while positioning
the longer-term trade.
For the short-term, look at 2580 for near-term resistance. A pop above this should send prices back to 2650 on bullish news. For now, traders should continue to watching demand for key regions of the world – North America, Europe and Asia. Weather patterns in West Africa will also affect the trade. Trader’s should take a cautious approach for now as prices in Q4 for cocoa has been anyone’s guess the past few years as demand has been unpredictable.
On
the heels of mid-Sep-to-early-Oct's steeper, accelerated, 3rd-wave-looking
recovery, the past week-and-a-half's boringly lateral chop is first considered
a corrective/consolidative event that warns of a continuation of the uptrend
that preceded it to new highs above 04-Oct's 891.0 high. This count
remains consistent with our broader base/correction/recovery count introduced
in 13-Sep's Technical Blog following that
day's bullish divergence in short-term momentum above 07-Sep's 809.5 minor
corrective high detailed in the hourly chart below.
The
important takeaway from this month's lateral, sleepy price action is the
definition of Wed's 851.5 low as
the end or lower boundary of a suspected 4th-Wave correction. A failure
below 851.5 will confirm a bearish divergence in daily momentum and defer or
threaten a bullish count enough to warrant non-bullish decisions like
long-covers. A failure below 851.5 will not
necessarily negate a broader bullish count, but it will threaten it enough to
warrant defensive measures as the next pertinent technical levels below 851.5 are
13-Sep's prospective minor 1st-Wave high at 813.8 and obviously 08-Sep's 766.0
low. And making non-bullish decisions "down there" is
sub-optimal to say the least. Per such, both short- and longer-term
commercial traders are advised to pare or neutralize bullish exposure on a
failure below 851.5, acknowledging and accepting whipsaw risk- back above 04-Oct's
891.0 high- in exchange for much deeper and sub-optimal nominal risk below
766.0.
On
a broader scale, the daily log scale chart above shows the developing potential
for a bearish divergence in daily momentum that will be considered confirmed
below 851.5. This chart also shows the past month's recovery thus far
stalling in the immediate neighborhood of the (888.0) Fibonacci
minimum 38.2% retrace of Apr-Sep's entire 1128 - 766 decline). COMBINED
with a failure below 851.5, traders
would then need to be concerned with at least a larger-degree correction pf the
past month's rally and possibly a resumption of Apr-Sep's major downtrend.
Until
and unless the market fails below 851.5 however, we would
remind longer-term players of the key elements on which our bullish count is
predicated:
a confirmed bullish divergence in WEEKLY momentum
(below)
amidst
an
historically low 11% reading in out RJO Bullish Sentiment Index and
a
textbook complete and major 5-wave Elliott sequence down from 29-Apr's
1128 high to 08-Sep's 766.0 low.
Thus
far, the market is only a month into correcting a 4-MONTH, 32% drawdown, so
further and possibly protracted gains remain well within the bounds of a major
(suspected 2nd-Wave) correction of Apr-Sep's decline within an even more
massive PEAK/reversal process from 17-May's 1219 high on an active continuation
basis below.
These
issues considered, a bullish policy and exposure remain advised with a failure
below 851.5 required to defer or threaten this call enough to warrant moving to
a neutral/sideline position. In lieu of such weakness, we anticipate a
continuation of the past month's rally to new highs and potentially significant
gains above 891.0.
Agricultural - Grains - Corn Watch for Another Breakout
Grains - Corn Watch for Another Breakout
By: Michael Sabo, Senior Market StrategistPosted Oct 22, 2021 11:15AM CT
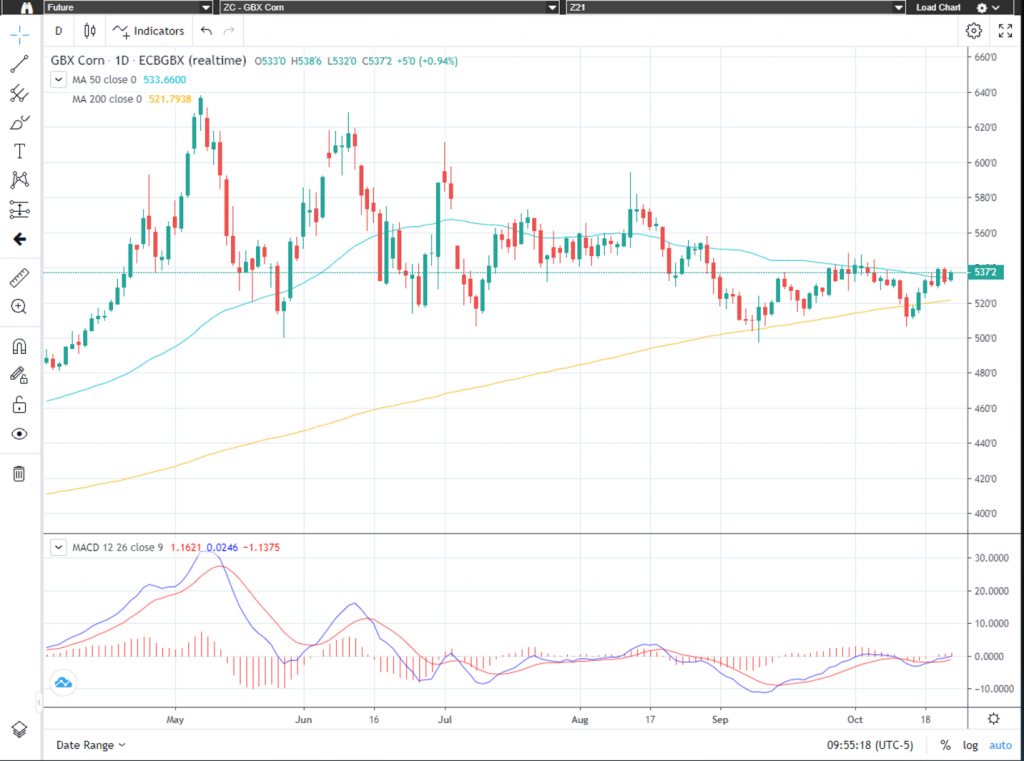
Last week I advised traders on
the following “If we see corn close in the upper 1/3 of the daily trading
range we may see some follow through to the upside early next week.” We
started out the week on a positive note before hitting a weekly high of $5.40
on both Wednesday and Thursday. The last 2-days the market has been
consolidating. Traders should watch for a breakout above $5.41 or a break below
$5.27 for short term market direction.
The “big picture” numbers remain the
same and probably will for some time. I firmly believe a break below $4.96 could
give the bears control of the market and a break above $6.39 ½ on the upside may
have enough bulls behind it to propel corn to all-time highs. There are several
minor areas of support and resistance inside this range that can help with
short term market direction if violated. Call me directly at 1-800-367-7290 for
more in-depth discussion on these numbers and to discuss trading strategies
specific to your situation.
I would suggest using an option
strategy to manage your futures position risk or an outright option strategy.
Implied option volatility has come down quite a bit from its most recent highs
mainly due to the consolidation and tighter trading ranges. I have 25 years of grain
market experience, feel free to call or email with any questions you may have. Be sure to check out my archived weekly grain
market insight articles posted on our website.
**** Reserve
your FREE 2022 Commodity Trading Guide Today! ****
This 55-page guide is packed with indispensable market information. It has a complete commodity calendar that lists the dates and times of Market Reports, option expiration dates, futures first notice dates, futures last trade dates, etc. It readily serves as your commodity market encyclopedia giving you an in depth look at each commodity, there is market almanac for all actively traded commodities and much more! To reserve your complimentary Commodity Trading Guide, send me an email at msabo@rjofutures.com with the following information: your full name, mailing address and a preferred phone number so we can confirm your request. Once confirmed, I will reserve your trading guide, and have it sent out as soon as we receive them.
Corn Dec '21 Daily Chart If you have any questions or would like to discuss the markets further, please feel free to contact me at 800-367-7290 or msabo@rjofutures.com. Agricultural - Slow Go in Cattle
Slow Go in Cattle
By: Peter McGinnPosted 10/22/2021
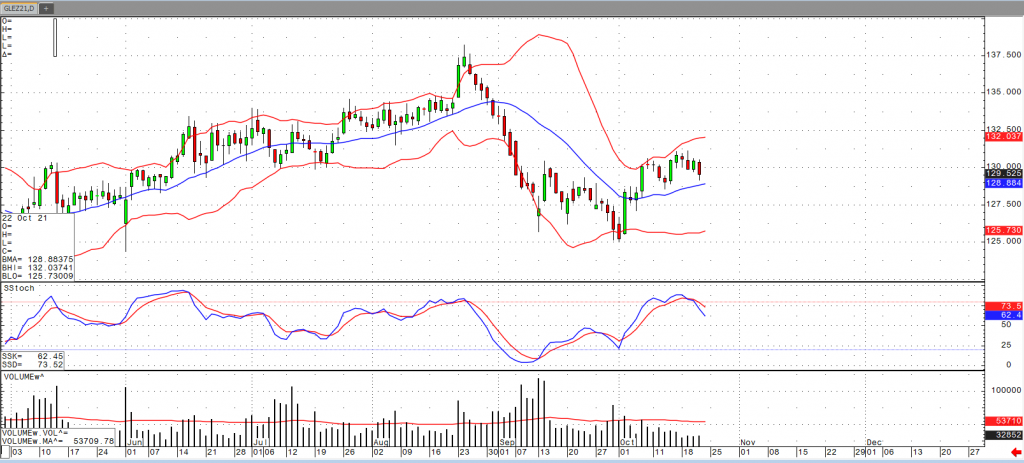
Cash cattle seems to be a slow-go recently with the futures market still holding a large premium over the cash. One of the main reasons has been disappointing export sales the past couple weeks. For the USDA Cattle on Feed report today, traders see placements for the month of September near 101.4% of last year in the 97.5-104 range. Marketing's are expected near 97.5% of last year, 97-98.9 range. Total Cattle-on-Feed for October 1 is expected near 99.4%, 98.6-100 range. US beef export sales for the week ending October 14 came in at 7,809 tonnes for 2021 delivery and net cancellations of 196 tonnes for 2022 for an overall net of 7,613. This was down from 15,449 the previous week and lowest since last November. The average of the previous four weeks is 16,492. Cumulative sales for 2021 have reached 920,100 tonnes, up from 797,500 a year ago and the largest on record. The five-year average is 735,500. The USDA boxed beef cutout was up 44- cents at mid-session yesterday and closed 63 cents higher at $280.66. This was up from $280.32 the previous week. Cash live cattle prices appear to be holding about a 50-cent premium over last week. There was some light trade on Thursday at or inside the ranges from Wednesday's heavy-volume day. As of Thursday afternoon, the 5-day, 5-area weighted average price was 124.27, up from 123.82 a week ago. Fourth quarter production is expected to decline from last year's fourth quarter, but the decline is less than 1%. The USDA estimated cattle slaughter came in at 120,000 head yesterday. This brings the total for the week so far to 482,000 head, up from 480,000 last week and 479,000 a year ago.
Live Cattle Dec '21 Daily ChartEquity - Stocks Mixed After Record Close
Stocks Mixed After Record Close
By: Jeff Yasak, Senior Market StrategistPosted Oct 22, 2021 9:45AM CT
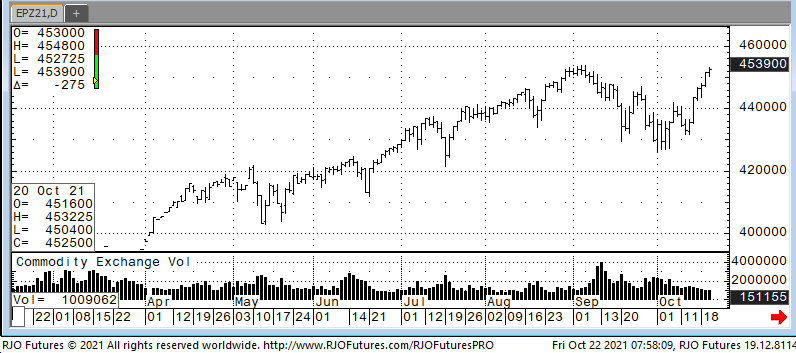
U.S. stock futures are mixed this morning after the S&P 500 recorded a record close on Thursday. That index fell 0.2% on the open while the tech heavy Nasdaq Composite dropped 0.4% and the blue-chip Dow Jones Average was up slightly. Even with the concerns about inflation and supply-chain problems that are threatening the post-pandemic recovery, stocks have a way to keep rising on strong earning reports. Nine out of 10 U.S. companies had reported earnings that beat Wall Street expectations. Leading the way was American Express at 3.5%. Thursday also showed that jobless claims numbers improved to their lowest levels since March 2020, falling more than expected as layoffs, firings and work separations slowed in the labor market.
Support today is 452000 and 446650 with resistance showing 455000 and 456500.
E-mini S&P 500 Dec '21 Daily Chart If you have any questions or would like to discuss the markets further, please feel free to contact me at 888-861-1656 or jyasak@rjofutures.com. Economy - S-T Mo Failure Insufficient to End RBOB Correction, But Beware
S-T Mo Failure Insufficient to End RBOB Correction, But Beware
By: RJO Market InsightsPosted 11/08/2022
Posted on Nov 08, 2022, 07:51 by Dave Toth
In Fri's Technical Webcast we identified a
minor corrective low at 2.6328 from Thur as a mini risk parameter the market
needed to sustain gains above to maintain a more immediate bullish count.
The 240-min chart below shows the market's failure overnight below this level,
confirming a bearish divergence in very short-term momentum. This mo
failure defines Fri's 2.8172 high as
one of developing importance and a parameter from which very short-term traders
can objectively base non-bullish decisions like long-covers.
Given
the magnitude of the past three weeks' broader recovery however, this
short-term momentum failure is of an insufficient scale to conclude anything
more than another correction within this broader recovery from 26-Sep's 2.1877
low. Indeed, overnights failure below 2.6328 only allows us to conclude
the end of the portion of the month-and-a-half rally from 31-Oct's 2.4822 next
larger-degree corrective low. 2.4822 is the
risk parameter this market still needs to fail below to break the uptrend from
18-Oct's 2.3526 low while this 2.3526 low
remains intact as the risk parameter this market needs to fail below to break
the month-and-a-half uptrend. From an
intermediate-to-longer-term perspective, this week's setback falls well within
the bounds of another correction ahead of further gains. This is another
excellent example of the importance of technical and trading SCALE and
understanding and matching directional risk exposure to one's personal risk
profile.
The
reason overnight's admittedly minor mo failure might have longer-term
importance is the 2.8172-area from which it stemmed. In
Fri's Technical Blog we also noted the market's engagement of the
2.8076-to-2.8159-area marked by the 61.8% retrace of Jun0-Sewp's 3.2758 -2.1877
decline and the 1.000 progression of Sep-Oct's initial 2.1877 - 2.6185
(suspected a-Wave) rally from 18-Oct's 2.3526 (suspected b-Wave) low. We
remind longer-term players that because of the unique and compelling confluence
of:
early-Aug's bearish divergence in WEEKLY momentum
amidst
historically
extreme bullish sentiment/contrary opinion levels in our RJO Bullish
Sentiment Index
an
arguably complete and massive 5-wave Elliott sequence from Mar'20's 0.4605
low to Jun's 4.3260 high (as labeled in the weekly log active-continuation
chart below) and
the
5-wave impulsive sub-division of Jun-Sep's (suspected initial 1st-Wave) decline
The
recovery attempt from 26-Sep's 2.1877 low is arguably only a 3-wave (Wave-2)
corrective rebuttal to Jun-Sep's decline within a massive, multi-quarter
PEAK/reversal process. Now granted, due to the magnitude of 2020 -2022's
secular bull market, we discussed the prospect for this (2nd-Wave corrective)
recovery to be "extensive" in terms of both price and time. A
"more extensive" correction is typified by a retracement of 61.8% or
more and spanning weeks or even months following a 3-month decline. Per
such, the (suspected corrective) recovery from 26-Sep's 2.1877 low could easily
have further to go, with commensurately larger-degree weakness than that
exhibited this week (i.e., a failure below at least 2.4822) required
to consider the correction complete. Indeed, the daily log chart above
shows the market thus far respecting former 2.6185-area resistance from 10-Oct
as a new support candidate.
These
issues considered, very shorter-term traders have been advised to move to a neutral/sideline
position following overnight's momentum failure below 2.6328, with a recovery
above 2.8172 required to negate this call, reaffirm the recovery and re-expose
potentially significant gains thereafter. For intermediate- and
longer-term players, a bullish policy and exposure remain advised with a
failure below 2.4822 required to threaten this call enough to warrant
neutralizing exposure. We will be watchful for another bearish divergence
in momentum following a recovery attempt that falls short of Fri's 2.8172 high
that would be considered the next reinforcing factor to a count calling that
2.8172 high the prospective end to the month-and-a-half 2nd-Wave
correction. In lieu of such, a resumption of the current rally to
eventual new highs above 2.8172 should not surprise.
Economy - Futures Market Outlook w/John Caruso - 10/21/2021
Futures Market Outlook w/John Caruso - 10/21/2021
By: John Caruso, Senior Market StrategistPosted Oct 21, 2021 2:08PM CT
John Caruso discusses the action moving today's market as we've seen a rather slow day in the equities and a decent sized sell-off in the oil market. If you have any questions or would like to discuss the markets further, please feel free to contact me at 800-669-5354 or jcaruso@rjofutures.com.