RJO FuturesCast

October 29, 2021 | Volume 15, Issue 43

The Markets

Metals - Silver Pulling Back This Week

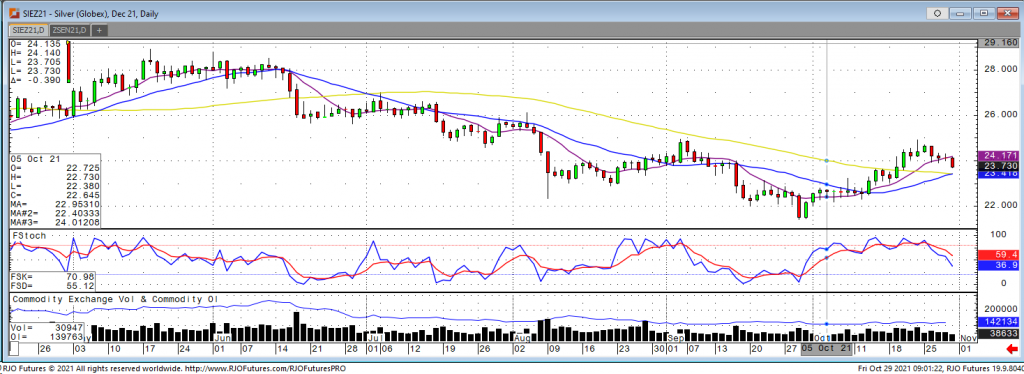
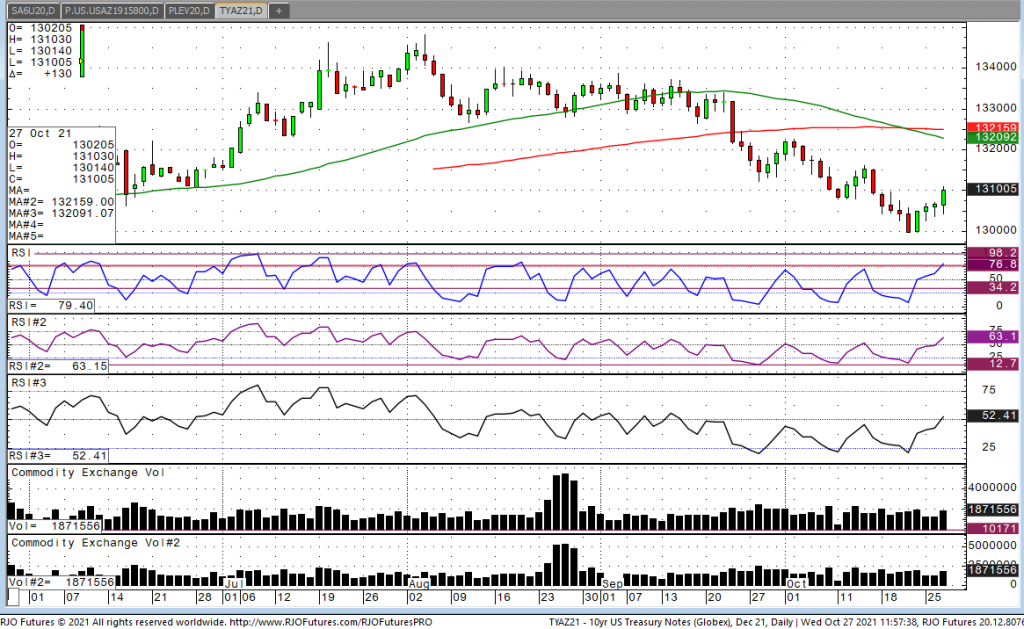
The silver market pulled back this week after failing to push over last Friday’s high of 24.92 during Monday’s trade. December silver corrected back to support at 24 and has pushed lower to 23.77 to start Friday’s trading session. A decline in the US dollar on Thursday failed to give the silver market much of any strength although today’s recovery has pressured the silver market lower today. Fundamentally the silver market is torn with the metals markets unable to extend gains with fears that a slowing economy will provide pressure to the downside. On the other side, we saw the lowest initial jobless claim since March which would signal the economy is still recovering. Then we have inflation talks with some calling for new all-time highs for the metal markets in 2022. In stocks this week we saw mixed trade with big misses in earnings from both Apple and Amazon have some thinking the stock market could be due for a correction which could cause some more interest in the metals market. The silver bulls need to see December silver close back above the 24 level or at a minimum find a support level and trade sideways for another push higher. The Bear camp wants to see a close under the 24 level with follow through lower next week to extend this move lower. Support comes in below the market with 23.20 and 22.50 being the next levels the market could find support. Resistance comes in at 24 and then last Friday’s high of 24.92. The market isn’t showing a direction it wants to go with any conviction right now but it looks like whichever side of 24 it can hold is going to determine the markets short term trend.

Silver Dec '21 Daily Chart
If you have any questions or would like to discuss the markets further, please feel free to contact me at 800-826-2270 or therrmann@rjofutures.com.
Energy - Oil Headed for First Weekly Loss in Two Months

Oil prices are ticking lower early Friday after falling around 1% to their lowest in two weeks on Thursday. This comes as Iran’s top nuclear negotiator stated that talks regarding the 2015 nuclear deal will resume in November with a deal potentially eases sanctions on oil exports. In addition, US crude stocks rose 4.268 million barrels but remain -61.61mb below last year -28.14mb below the five-year average. The large build was due to a jump in imports with refinery rates remaining low. Gasoline stocks drew -5.36mb to their lowest in almost four years. OPEC+ is scheduled to meet next week as 400k barrels per day are set to return.  The market continues to remain bullish trend with today’s range crudeseen between 81.07 – 84.78.

Crude Oil Dec '21 Daily Chart
If you have any questions or would like to discuss the markets further, please feel free to contact me at 800-438-4805 or aturro@rjofutures.com.
Softs - Coffee In a Position for More Upside as Supply Tightens

While the market continues to have trouble keeping upside momentum, it has found support well above its October lows and continues to be strengthened by bullish supply developments, along with improving global demand. The Brazilian currency sold off over 1%, which weighed on the coffee market as this extended period of currency weakness could make famers in Brazil more aggressive with marketing their remaining 21/22 coffee supplies. Good rains over Brazilian growing areas was another source of pressure on the market, as that may improve outlooks on their upcoming production. Technical indicators trending lower at midrange will tend to reinforce a move lower, especially if support levels are broken. A close below the 9-day moving average confirms the short-term trend is negative. Support comes in today at 19760 and 19580 while resistance is at 20220 and 20500.

Coffee Dec '21 Daily Chart
If you have any questions or would like to discuss the markets further, please feel free to contact me at 800-826-2270 or tcholly@rjofutures.com.
Agricultural - Bullish Canola Count Intact Above Minimum 851.5

Posted on Oct 14, 2022, 07:42 by Dave Toth

On the heels of mid-Sep-to-early-Oct's steeper, accelerated, 3rd-wave-looking recovery, the past week-and-a-half's boringly lateral chop is first considered a corrective/consolidative event that warns of a continuation of the uptrend that preceded it to new highs above 04-Oct's 891.0 high.  This count remains consistent with our broader base/correction/recovery count introduced in 13-Sep's Technical Blog following that day's bullish divergence in short-term momentum above 07-Sep's 809.5 minor corrective high detailed in the hourly chart below.

The important takeaway from this month's lateral, sleepy price action is the definition of Wed's 851.5 low as the end or lower boundary of a suspected 4th-Wave correction.  A failure below 851.5 will confirm a bearish divergence in daily momentum and defer or threaten a bullish count enough to warrant non-bullish decisions like long-covers.  A failure below 851.5 will not necessarily negate a broader bullish count, but it will threaten it enough to warrant defensive measures as the next pertinent technical levels below 851.5 are 13-Sep's prospective minor 1st-Wave high at 813.8 and obviously 08-Sep's 766.0 low.  And making non-bullish decisions "down there" is sub-optimal to say the least.  Per such, both short- and longer-term commercial traders are advised to pare or neutralize bullish exposure on a failure below 851.5, acknowledging and accepting whipsaw risk- back above 04-Oct's 891.0 high- in exchange for much deeper and sub-optimal nominal risk below 766.0.

On a broader scale, the daily log scale chart above shows the developing potential for a bearish divergence in daily momentum that will be considered confirmed below 851.5.  This chart also shows the past month's recovery thus far stalling in the immediate neighborhood of the (888.0) Fibonacci minimum 38.2% retrace of Apr-Sep's entire 1128 - 766 decline).  COMBINED with a failure below 851.5, traders would then need to be concerned with at least a larger-degree correction pf the past month's rally and possibly a resumption of Apr-Sep's major downtrend.

Until and unless the market fails below 851.5 however, we would remind longer-term players of the key elements on which our bullish count is predicated:

  • a confirmed bullish divergence in WEEKLY momentum (below) amidst
  • an historically low 11% reading in out RJO Bullish Sentiment Index and
  • a textbook complete and major 5-wave Elliott sequence down from 29-Apr's 1128 high to 08-Sep's 766.0 low.

Thus far, the market is only a month into correcting a 4-MONTH, 32% drawdown, so further and possibly protracted gains remain well within the bounds of a major (suspected 2nd-Wave) correction of Apr-Sep's decline within an even more massive PEAK/reversal process from 17-May's 1219 high on an active continuation basis below.

These issues considered, a bullish policy and exposure remain advised with a failure below 851.5 required to defer or threaten this call enough to warrant moving to a neutral/sideline position.  In lieu of such weakness, we anticipate a continuation of the past month's rally to new highs and potentially significant gains above 891.0.

Agricultural - Grains - Corn Breakout This Week

Last week I advised traders on the following “The last 2 days the market has been consolidating. Traders should watch for a breakout above $5.41 or a break below $5.27 for short term market direction.” Refer to neon green line on the daily December corn chart below (that line is $5.41 on the chart). On Monday, Dec corn started to breakout as it traded to a high of $5.42 which triggered the buy signal I spoke about in last week’s write-up and we continued to get follow through to the upside all week. At the time of this writing December corn is trading at $5.67. While I do think the market may hit some resistance at this level, I believe the current fundamentals and technicals still favor the bulls. The market appears to be on track to head towards the upper major trendline (red line on chart). So far today, the market is forming yet another inside day, if this continues and actually forms today, watch for (you guessed it) another breakout!

The “big picture” numbers still remain the same and probably will for some time. I firmly believe a break below $4.96 could give the bears control of the market and a break above $6.39 ½ on the upside may have enough bulls behind it to propel corn to all-time highs. There are several minor areas of support and resistance inside this range that can help with short term market direction if violated. Call me directly at 1-800-367-7290 for more in-depth discussion on these numbers and to discuss trading strategies specific to your situation.

I would suggest using an option strategy to manage your futures position risk or an outright option strategy.  Implied option volatility has come down quite a bit from its most recent highs mainly due to the consolidation and tighter trading ranges. I have 25 years of grain market experience, feel free to call or email with any questions you may have.  Be sure to check out my archived weekly grain market insight articles posted on our website.

**** Reserve your FREE 2022 Commodity Trading Guide Today! ****

This 55-page guide is packed with indispensable market information.  It has a complete commodity calendar that lists the dates and times of Market Reports, option expiration dates, futures first notice dates, futures last trade dates, etc.  It readily serves as your commodity market encyclopedia giving you an in depth look at each commodity, there is market almanac for all actively traded commodities and much more!  To reserve your complimentary Commodity Trading Guide, send me an email at msabo@rjofutures.com with the following information: your full name, mailing address and a preferred phone number so we can confirm your request.  Once confirmed, I will reserve your trading guide, and have it sent out as soon as we receive them.

Corn Dec '21 Daily Chart
If you have any questions or would like to discuss the markets further, please feel free to contact me at 800-367-7290 or msabo@rjofutures.com.
Interest Rates - Impressive Action in Interest Rates

Looking at the December 10- year note, we have a high of 131-01, a low of 130-140, and are currently trading at 131-00. Watching today’s price action is somewhat impressive driven by a softer than expected durable goods number. What we have seen in the last several weeks is continued strength in the economy and better than expected government reports. I don’t believe one weak number changes much for the Fed, who have relayed clearly to the market that they do indeed intend on beginning to taper in November. The market has priced that in already as we’re seeing a weak durable goods number. In my opinion, we caught some shorts and that has exacerbated the move to the upside today.   There are rumors the Bank of England is looking to lift interest rates at their next meeting. Investors are keeping a close eye on the continued supply chain disruptions that are forcing prices in many of the commodities substantially higher thus producing inflation which might make the Fed raise rates earlier than most anticipated. Looking at some key levels in the Dec contract, some resistance lies at 131-06 and support coming in at 130-04-02.  Traders should continue to monitor any verbiage from fed governors as to clues about the feds thinking.

If you have any questions or would like to discuss the markets further, please feel free to contact me at 800-826-2270 or gperlin@rjofutures.com.
Equity - Stocks Mixed to End the Month

Stocks are taking a bit of a breather after printing new all-time highs earlier this week.  Earnings have been impressive, but supply chain issues are taking their toll as evidenced by highly anticipated earnings of both Apple and Amazon yesterday afternoon.  When one also factors in the massive labor shortage we’re facing, it’s easy to see why investors may be wary about piling in at these levels.  Both companies (and many others) have expressed concern over how these issues will affect their ability to operate in Q4 and beyond.  

Consumer sentiment came in at 0.6%, which is down from last month’s 1.0% reading.  We also saw a drop in personal incomes, which is largely attributed to ending of the enhanced unemployment aid.  It’s likely safe to assume that higher costs, decreased income, and lack of supply were behind the decline.  Speaking of higher costs, PCE came in at 4.4% Y/Y.  While that is a staggering number, the headline PCE inflation has decelerated for several months in a row. 

E-mini S&P 500 Dec '21 Daily Chart
If you have any questions or would like to discuss the markets further, please feel free to contact me at 800-669-5354 or bdixon@rjofutures.com.
Economy - S-T Mo Failure Insufficient to End RBOB Correction, But Beware

Posted on Nov 08, 2022, 07:51 by Dave Toth

In Fri's Technical Webcast we identified a minor corrective low at 2.6328 from Thur as a mini risk parameter the market needed to sustain gains above to maintain a more immediate bullish count.  The 240-min chart below shows the market's failure overnight below this level, confirming a bearish divergence in very short-term momentum.  This mo failure defines Fri's 2.8172 high as one of developing importance and a parameter from which very short-term traders can objectively base non-bullish decisions like long-covers.

Given the magnitude of the past three weeks' broader recovery however, this short-term momentum failure is of an insufficient scale to conclude anything more than another correction within this broader recovery from 26-Sep's 2.1877 low.  Indeed, overnights failure below 2.6328 only allows us to conclude the end of the portion of the month-and-a-half rally from 31-Oct's 2.4822 next larger-degree corrective low.  2.4822 is the risk parameter this market still needs to fail below to break the uptrend from 18-Oct's 2.3526 low while this 2.3526 low remains intact as the risk parameter this market needs to fail below to break the month-and-a-half uptrend.  From an intermediate-to-longer-term perspective, this week's setback falls well within the bounds of another correction ahead of further gains.  This is another excellent example of the importance of technical and trading SCALE and understanding and matching directional risk exposure to one's personal risk profile.

The reason overnight's admittedly minor mo failure might have longer-term importance is the 2.8172-area from which it stemmed.  In Fri's Technical Blog we also noted the market's engagement of the 2.8076-to-2.8159-area marked by the 61.8% retrace of Jun0-Sewp's 3.2758 -2.1877 decline and the 1.000 progression of Sep-Oct's initial 2.1877 - 2.6185 (suspected a-Wave) rally from 18-Oct's 2.3526 (suspected b-Wave) low.  We remind longer-term players that because of the unique and compelling confluence of:

  • early-Aug's bearish divergence in WEEKLY momentum amidst
  • historically extreme bullish sentiment/contrary opinion levels in our RJO Bullish Sentiment Index
  • an arguably complete and massive 5-wave Elliott sequence from Mar'20's 0.4605 low to Jun's 4.3260 high (as labeled in the weekly log active-continuation chart below) and
  • the 5-wave impulsive sub-division of Jun-Sep's (suspected initial 1st-Wave) decline

The recovery attempt from 26-Sep's 2.1877 low is arguably only a 3-wave (Wave-2) corrective rebuttal to Jun-Sep's decline within a massive, multi-quarter PEAK/reversal process.  Now granted, due to the magnitude of 2020 -2022's secular bull market, we discussed the prospect for this (2nd-Wave corrective) recovery to be "extensive" in terms of both price and time.  A "more extensive" correction is typified by a retracement of 61.8% or more and spanning weeks or even months following a 3-month decline.  Per such, the (suspected corrective) recovery from 26-Sep's 2.1877 low could easily have further to go, with commensurately larger-degree weakness than that exhibited this week (i.e., a failure below at least 2.4822) required to consider the correction complete.  Indeed, the daily log chart above shows the market thus far respecting former 2.6185-area resistance from 10-Oct as a new support candidate.

These issues considered, very shorter-term traders have been advised to move to a neutral/sideline position following overnight's momentum failure below 2.6328, with a recovery above 2.8172 required to negate this call, reaffirm the recovery and re-expose potentially significant gains thereafter.  For intermediate- and longer-term players, a bullish policy and exposure remain advised with a failure below 2.4822 required to threaten this call enough to warrant neutralizing exposure.  We will be watchful for another bearish divergence in momentum following a recovery attempt that falls short of Fri's 2.8172 high that would be considered the next reinforcing factor to a count calling that 2.8172 high the prospective end to the month-and-a-half 2nd-Wave correction.  In lieu of such, a resumption of the current rally to eventual new highs above 2.8172 should not surprise.

Economy - Futures Market Outlook w/John Caruso - 10/28/2021
John Caruso talks about the latest news moving the markets today as we are seeing a slight uptick in the S&P 500 and another all-time high in the Nasdaq.
If you have any questions or would like to discuss the markets further, please feel free to contact me at 800-669-5354 or jcaruso@rjofutures.com.

Coming Up Next Week...

View Futures Calendar