RJO FuturesCast

November 12, 2021 | Volume 15, Issue 45

The Markets

Metals - Gold on a Run Higher

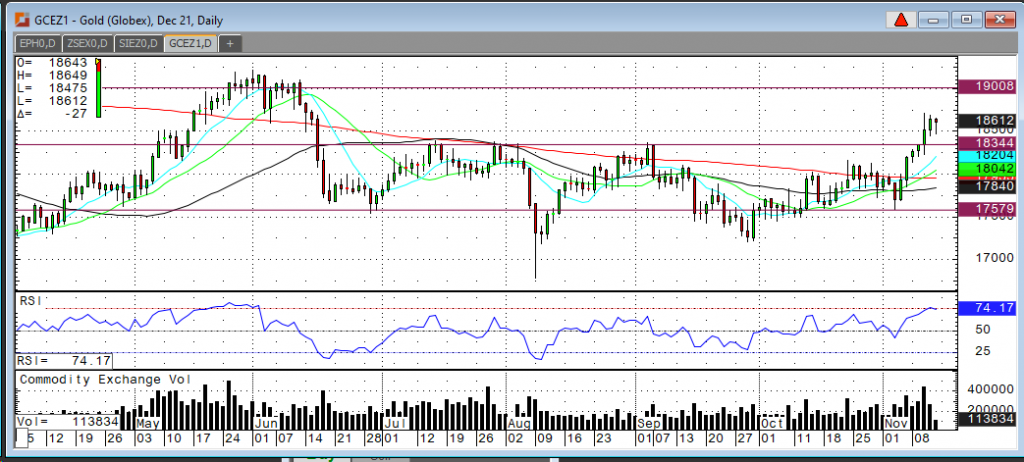
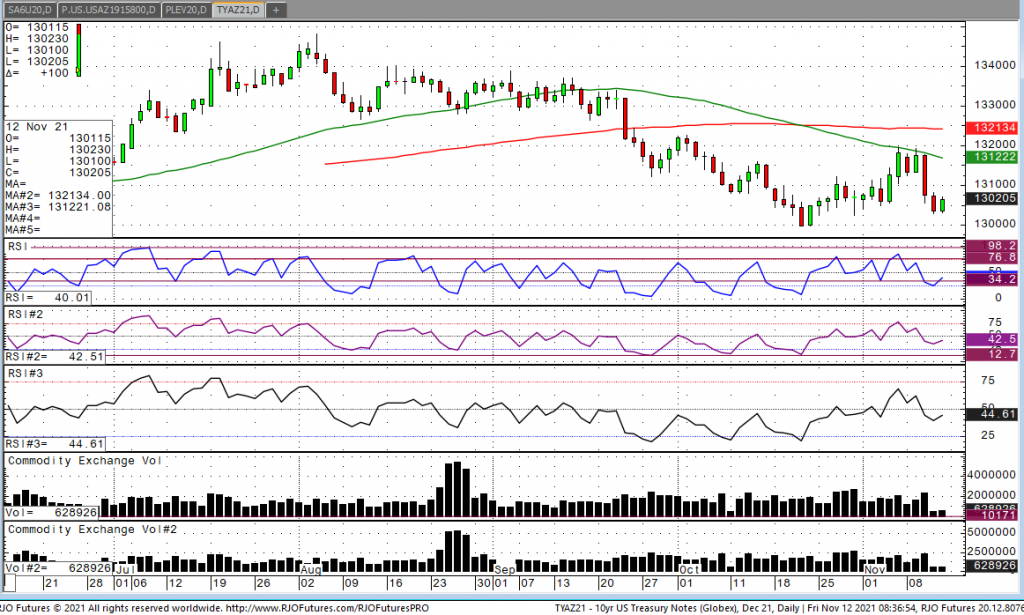
It’s about time, isn’t it? Explosive upside breakout in gold has finally happened. It’s never been a question of if, just a question of when. Of course, it is about gold traders looking for an inflationary hedge, but it is equally due to the technical buying that was triggered by a close at $1,834 this past Tuesday. Some talking heads out there are going to tell you it’s about a “dovish” Fed. I say it’s about heated inflation data. It’s about the idea that rates will move higher before the Fed starts real tightening and not just tapering. The market will do its job! Look at how ten-year note yields have moved this week also. There’s a direct correlation. Now that gold has begun to move higher, dips are likely to be shallow and good opportunities to add to long positions. I would like to see that gold can hold levels above $1,835. A close under $1,825 would be a game changer and considered a reversal. A pop over $1,875 and we will be at $1,900 in short order. Gold trade may take a little breather and chop between $1,835 and $1,875 for a short time before moving higher again. This was a big move and happened fast. That’s how technical buying works.

Inflation is impacting everything, everywhere! Gold should continue to be attractive under $2,000. Once it reaches above $2,000

The strength in the US dollar comes from the prospect of rate hikes and dollar strength can put pressure on all commodities. Those dips in commodities are more temporary in nature. Commodities are in a super cycle bull market and now that gold traders can see that inflation is here to stay, gold will continue to move higher in my opinion.

Gold Dec '21 Daily Chart
If you have any questions or would like to discuss the markets further, please feel free to contact me at 800-826-4124 or fcholly@rjofutures.com.
Metals - Silver Continuing Its Run

This week we saw the December silver market continue its move higher, adding to gains from last week after trading down to 23.045 on Wednesday Nov 3rd. Silver posted a new weekly high of 25.39 before trading lower to start today’s session. Silver managed to move higher despite a rally in the US dollar to 95.270 and a pullback in stocks on Tuesday and Wednesday. The metals market’s move higher this week, even with everything that should have added pressure, is showing that the inflation trade is really starting to develop and looks to be here to stay. The US CPI report showed inflation at a 30-year high on Wednesday which increases the chances that the Fed will be forced to raise US rates much sooner than originally expected. The bulls have the advantage here but need to see continued buying to push above the next resistance level of 26. Bears need to see a close below 24.89 which would reverse the short-term trend and leave 24 as the next downside objective. As of now the bulls are in the driver’s seat and a rally through the 26 level would leave 28 as the next upside target.

Silver Dec '21 Daily Chart
If you have any questions or would like to discuss the markets further, please feel free to contact me at 800-826-2270 or therrmann@rjofutures.com.
Energy - Oil Poised for Third Consecutive Week of Losses

Oil prices have fallen early Friday amid a firmer US Dollar as well as speculation of the potential release of US strategic reserves. OPEC+ noted that it projected its October production to have increased by 217k barrels per day while simultaneously reiterating their objective of returning 400k barrels per day until output is restored. In addition, OPEC+ cut their demand forecast for the fourth quarter by 330k barrels per day from last months forecast. US crude stocks rose 1.002 million barrels for the third consecutive week with stocks now -53.60 million barrels below last year and -30.705 below the five-year average, according to the EIA. Gasoline stocks, however, fell -1.555 million barrels for the fifth week with stocks coming in at the lowest since November 2017. The market remains bullish trend with today’s range seen between 78.37 – 85.81.

Crude Oil Dec '21 Daily Chart
If you have any questions or would like to discuss the markets further, please feel free to contact me at 800-438-4805 or aturro@rjofutures.com.
Softs - Coffee in a Position to Resume Trend Higher

With bullish developments from the supply and demand side of the market, coffee should be able to maintain upside momentum. A more than 1.5% rally in the Brazilian Real provided coffee with carryover support as that will ease pressure on Brazil’s farmers to market their remaining near-term supply. In addition, analysts at the University of Sao Paolo indicate those farmers are holding onto their coffee in anticipation of tight supply next season. Guatemala’s October coffee exports were over 67% higher than last years total, which shows that the flow of the Central American coffee supply continues to recover from last years sever storm damage. The daily technical indicators have crossed over up which is a bullish indication. Positive momentum studies in the neutral zone will tend to reinforce higher price action. Resistance comes in at 21680 and 21940 with support coming in at 20975 and 20535.

Coffee Dec '21 Daily Chart
If you have any questions or would like to discuss the markets further, please feel free to contact me at 800-826-2270 or tcholly@rjofutures.com.
Agricultural - Bullish Canola Count Intact Above Minimum 851.5

Posted on Oct 14, 2022, 07:42 by Dave Toth

On the heels of mid-Sep-to-early-Oct's steeper, accelerated, 3rd-wave-looking recovery, the past week-and-a-half's boringly lateral chop is first considered a corrective/consolidative event that warns of a continuation of the uptrend that preceded it to new highs above 04-Oct's 891.0 high.  This count remains consistent with our broader base/correction/recovery count introduced in 13-Sep's Technical Blog following that day's bullish divergence in short-term momentum above 07-Sep's 809.5 minor corrective high detailed in the hourly chart below.

The important takeaway from this month's lateral, sleepy price action is the definition of Wed's 851.5 low as the end or lower boundary of a suspected 4th-Wave correction.  A failure below 851.5 will confirm a bearish divergence in daily momentum and defer or threaten a bullish count enough to warrant non-bullish decisions like long-covers.  A failure below 851.5 will not necessarily negate a broader bullish count, but it will threaten it enough to warrant defensive measures as the next pertinent technical levels below 851.5 are 13-Sep's prospective minor 1st-Wave high at 813.8 and obviously 08-Sep's 766.0 low.  And making non-bullish decisions "down there" is sub-optimal to say the least.  Per such, both short- and longer-term commercial traders are advised to pare or neutralize bullish exposure on a failure below 851.5, acknowledging and accepting whipsaw risk- back above 04-Oct's 891.0 high- in exchange for much deeper and sub-optimal nominal risk below 766.0.

On a broader scale, the daily log scale chart above shows the developing potential for a bearish divergence in daily momentum that will be considered confirmed below 851.5.  This chart also shows the past month's recovery thus far stalling in the immediate neighborhood of the (888.0) Fibonacci minimum 38.2% retrace of Apr-Sep's entire 1128 - 766 decline).  COMBINED with a failure below 851.5, traders would then need to be concerned with at least a larger-degree correction pf the past month's rally and possibly a resumption of Apr-Sep's major downtrend.

Until and unless the market fails below 851.5 however, we would remind longer-term players of the key elements on which our bullish count is predicated:

  • a confirmed bullish divergence in WEEKLY momentum (below) amidst
  • an historically low 11% reading in out RJO Bullish Sentiment Index and
  • a textbook complete and major 5-wave Elliott sequence down from 29-Apr's 1128 high to 08-Sep's 766.0 low.

Thus far, the market is only a month into correcting a 4-MONTH, 32% drawdown, so further and possibly protracted gains remain well within the bounds of a major (suspected 2nd-Wave) correction of Apr-Sep's decline within an even more massive PEAK/reversal process from 17-May's 1219 high on an active continuation basis below.

These issues considered, a bullish policy and exposure remain advised with a failure below 851.5 required to defer or threaten this call enough to warrant moving to a neutral/sideline position.  In lieu of such weakness, we anticipate a continuation of the past month's rally to new highs and potentially significant gains above 891.0.

Agricultural - Grains - Corn in Consolidation Mode Today

Two weeks ago, on October 29, I advised traders on the following “At the time of this writing December Corn is trading at $5.67.  While I do think the market may hit some resistance at this level, I believe the current fundamentals and technicals still favor the bulls.  The market appears to be on track to head towards the upper major trendline (red line on chart).” Last week we saw exactly that, December corn made the move higher and hit resistance at the major trend line (see red line on chart below on November 2).  Corn then sold off until the USDA Report that came out on Tuesday November 9th. A classic case of sell the rumor, buy the fact. In other words, the trade “baked in” most of the bearish news and the USDA numbers came in within the range. Without extremely bearish news outside the expectations, it made sense the market has been moving higher. At the time of this writing corn is forming an inside day, if this continues and forms today, watch for a breakout next week.  Upside number $5.80 and downside number $5.64 ½.

The “big picture” numbers remain the same and probably will for some time. I firmly believe a break below $4.96 could give the bears control of the market and a break above $6.39 ½ on the upside may have enough bulls behind it to propel corn to all-time highs. There are several minor areas of support and resistance inside this range that can help with short-term market direction if violated. Call me directly at 1-800-367-7290 for more in-depth discussion on these numbers and to discuss trading strategies specific to your situation.

I would suggest using an option strategy to manage your futures position risk or an outright option strategy.  Implied option volatility has come down quite a bit from its most recent highs mainly due to the consolidation and tighter trading ranges. I have 25 years of grain market experience, feel free to call or email with any questions you may have.  Be sure to check out my archived weekly grain market insight articles posted on our website.

**** Reserve your FREE 2022 Commodity Trading Guide Today! ****

 This 55-page guide is packed with indispensable market information.  It has a complete commodity calendar that lists the dates and times of Market Reports, option expiration dates, futures first notice dates, futures last trade dates, etc. It readily serves as your commodity market encyclopedia giving you an in depth look at each commodity, there is market almanac for all actively traded commodities and much more!  To reserve your complimentary Commodity Trading Guide, send me an email at msabo@rjofutures.com with the following information: your full name, mailing address and a preferred phone number so we can confirm your request.  Once confirmed, I will reserve your trading guide, and have it sent out as soon as we receive them.

Corn Dec '21 Daily Chart
If you have any questions or would like to discuss the markets further, please feel free to contact me at 800-367-7290 or msabo@rjofutures.com.
Interest Rates - Interest Rates Still Digesting Record CPI

Looking at the December 10-year note, we have a high of 130-23, a low of 130-10, and currently sit on the highs at 130-23. The market feels like it’s digesting the big news that we saw on Wednesday where CPI came in much higher than forecast and subsequently pushed the yield on the note sharply higher and prices lower. Let’s face it, numbers don’t lie. Whether one goes to the grocery store, gets into a car and drives, or travels by plane, one is getting pinched by higher prices across the board. As the Fed continues to say that this up move in inflation is transitory, many are getting hurt and need to see prices lower for the consumer to resume spending. The problem that many are facing is that this model the fed created doesn’t work. As wages are stagnate, meaning they aren’t increasing as prices go up, the middle to lower class is getting destroyed by this move up in consumer prices. They don’t care if it is being caused by bottle necks in the economy or the fed asking OPEC to increase production, people need relief now and not later. The fed caused this and are to blame. The continued printing of money and talk of a gigantic infrastructure bill, has led to a to the sharp increase in prices that consumers are eventually paying for. With unemployment near pandemic lows, and rates near zero there is no reason at all for the fed to continue the process of printing money to keep rates artificially low any longer.

10-Year Note Dec '21 Daily Chart
If you have any questions or would like to discuss the markets further, please feel free to contact me at 800-826-2270 or gperlin@rjofutures.com.
Equity - Stocks Look to Pump the Breaks on Slide

The indices were hanging on to slight gains in anticipation of this morning Consumer Sentiment reading. Traders were expecting to see a reading of about 72. The actual reading was way off, coming in at 66.8. That is the worst reading we’ve seen in a decade. This follows Wednesday’s Consumer Price Index reading which showed inflation had hit a 31-year high. At some point or another, higher prices were going to lead to a more reserved consumer. It appears we’ve arrived at that point.

The rest of the month’s news slate is relatively light. Traders will be most interested in GDP on the 24th, and PMI on the 30th. The next two-day FOMC meeting takes place on December 14th and 15th. Fed funds are now suggesting we’ll see a rate hike by the Fed’s June meeting, and the odds of a second (and even a third) hike in 2022 have also increased dramatically. 

E-mini S&P 500 Dec '21 Daily Chart
If you have any questions or would like to discuss the markets further, please feel free to contact me at 800-669-5354 or bdixon@rjofutures.com.
Economy - S-T Mo Failure Insufficient to End RBOB Correction, But Beware

Posted on Nov 08, 2022, 07:51 by Dave Toth

In Fri's Technical Webcast we identified a minor corrective low at 2.6328 from Thur as a mini risk parameter the market needed to sustain gains above to maintain a more immediate bullish count.  The 240-min chart below shows the market's failure overnight below this level, confirming a bearish divergence in very short-term momentum.  This mo failure defines Fri's 2.8172 high as one of developing importance and a parameter from which very short-term traders can objectively base non-bullish decisions like long-covers.

Given the magnitude of the past three weeks' broader recovery however, this short-term momentum failure is of an insufficient scale to conclude anything more than another correction within this broader recovery from 26-Sep's 2.1877 low.  Indeed, overnights failure below 2.6328 only allows us to conclude the end of the portion of the month-and-a-half rally from 31-Oct's 2.4822 next larger-degree corrective low.  2.4822 is the risk parameter this market still needs to fail below to break the uptrend from 18-Oct's 2.3526 low while this 2.3526 low remains intact as the risk parameter this market needs to fail below to break the month-and-a-half uptrend.  From an intermediate-to-longer-term perspective, this week's setback falls well within the bounds of another correction ahead of further gains.  This is another excellent example of the importance of technical and trading SCALE and understanding and matching directional risk exposure to one's personal risk profile.

The reason overnight's admittedly minor mo failure might have longer-term importance is the 2.8172-area from which it stemmed.  In Fri's Technical Blog we also noted the market's engagement of the 2.8076-to-2.8159-area marked by the 61.8% retrace of Jun0-Sewp's 3.2758 -2.1877 decline and the 1.000 progression of Sep-Oct's initial 2.1877 - 2.6185 (suspected a-Wave) rally from 18-Oct's 2.3526 (suspected b-Wave) low.  We remind longer-term players that because of the unique and compelling confluence of:

  • early-Aug's bearish divergence in WEEKLY momentum amidst
  • historically extreme bullish sentiment/contrary opinion levels in our RJO Bullish Sentiment Index
  • an arguably complete and massive 5-wave Elliott sequence from Mar'20's 0.4605 low to Jun's 4.3260 high (as labeled in the weekly log active-continuation chart below) and
  • the 5-wave impulsive sub-division of Jun-Sep's (suspected initial 1st-Wave) decline

The recovery attempt from 26-Sep's 2.1877 low is arguably only a 3-wave (Wave-2) corrective rebuttal to Jun-Sep's decline within a massive, multi-quarter PEAK/reversal process.  Now granted, due to the magnitude of 2020 -2022's secular bull market, we discussed the prospect for this (2nd-Wave corrective) recovery to be "extensive" in terms of both price and time.  A "more extensive" correction is typified by a retracement of 61.8% or more and spanning weeks or even months following a 3-month decline.  Per such, the (suspected corrective) recovery from 26-Sep's 2.1877 low could easily have further to go, with commensurately larger-degree weakness than that exhibited this week (i.e., a failure below at least 2.4822) required to consider the correction complete.  Indeed, the daily log chart above shows the market thus far respecting former 2.6185-area resistance from 10-Oct as a new support candidate.

These issues considered, very shorter-term traders have been advised to move to a neutral/sideline position following overnight's momentum failure below 2.6328, with a recovery above 2.8172 required to negate this call, reaffirm the recovery and re-expose potentially significant gains thereafter.  For intermediate- and longer-term players, a bullish policy and exposure remain advised with a failure below 2.4822 required to threaten this call enough to warrant neutralizing exposure.  We will be watchful for another bearish divergence in momentum following a recovery attempt that falls short of Fri's 2.8172 high that would be considered the next reinforcing factor to a count calling that 2.8172 high the prospective end to the month-and-a-half 2nd-Wave correction.  In lieu of such, a resumption of the current rally to eventual new highs above 2.8172 should not surprise.

Coming Up Next Week...

View Futures Calendar