New Special Report: Inflation, How Much is Too Much?
With so much money in the market, coupled with weakened supply chains and workforces due to the fallout of Covid-19, we are seeing a rampant run on inflation. Prices from everything to lumber, oil, and groceries are up. Learn why this is happening, how long it will go on for, and how to protect yourself with this Special Report!
4th of July: Freedom From Commissions
Receive free commissions when you open and fund an account through the month of August! This is one firecracker you don’t want to miss!
The Markets
Metals - Gold Can't Fight Dollar Strength
Gold Can't Fight Dollar Strength
By: Frank J. Cholly, Senior Market StrategistPosted Aug 20, 2021 8:47AM CT
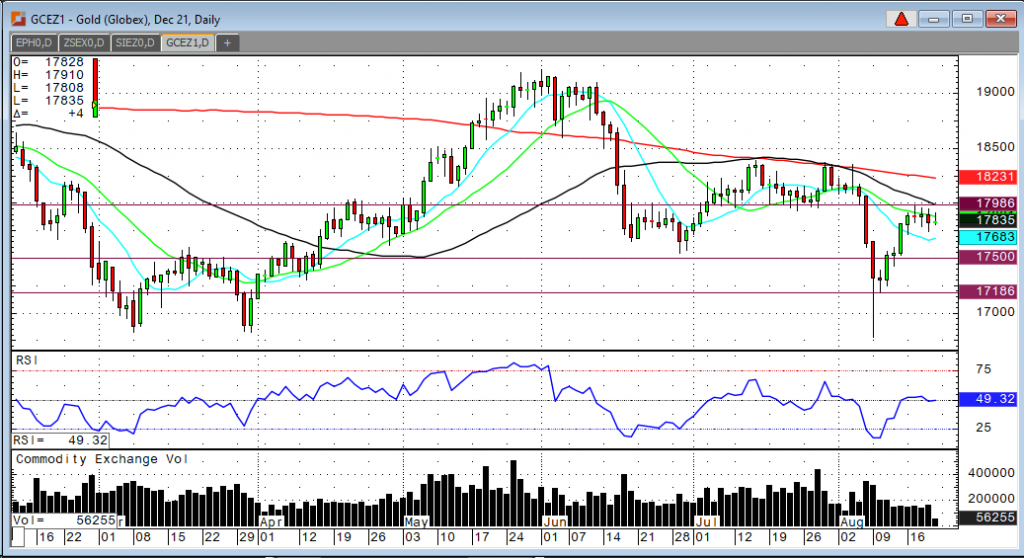
Gold is being capped by the $1,800 resistance and has a
series of lower highs and lower lows this week. On top of that we see the US
Dollar breaking out to new highs. I believe that gold is likely to move back
down towards the $1,750 range and perhaps consolidate there for a while. Gold
and commodities in general are under pressure mainly by this rally in the
Dollar but some of the arguments that used to “support” gold prices are
seemingly no longer supportive. Surging Delta cases, inflation fears, Fed
tapering, softening data, recovery pace slowing, inflation fears
moderating…what is it? Sounds confusing? Yes, it is confusing, and the traders
are uncertain what to expect over the next three to six months. As it looked
like we were headed for a huge economic boom due to re-opening the economy, we
are in fact sliding back towards mandates that actually kill business and jobs.
It seems to me that gold has to pull back again to at least $1,750 or perhaps even $1,700 before traders find value.
Gold Dec '21 Daily Chart If you have any questions or would like to discuss the markets further, please feel free to contact me at 800-826-4124 or fcholly@rjofutures.com. Metals - Silver Facing Pressure from Strong U.S. Dollar
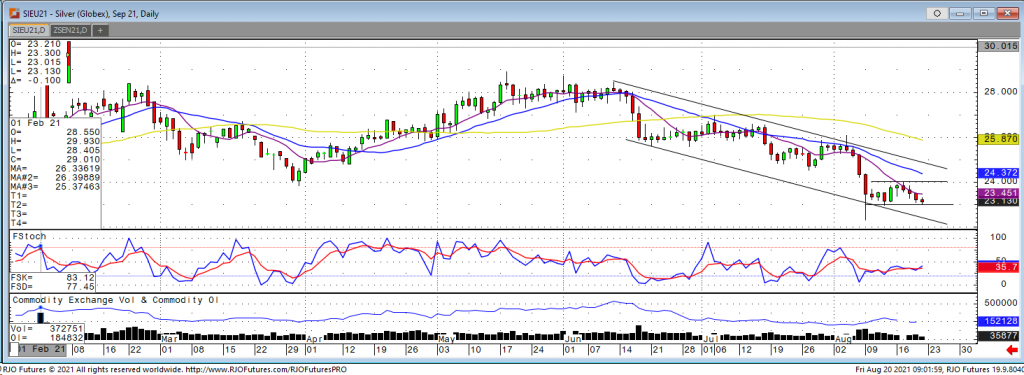
To start the week we saw silver trade higher, continuing Friday’s momentum, with a weekly high of 23.955 before seeing lower highs and lower lows the rest of the week. Despite the move lower in stocks this week, silver couldn’t catch any support and traded as low as 23.015 Friday morning. A stronger US dollar which traded to a recent new high and continues to show strength also added pressure to the silver market. Weekly jobless claims fell to 348,000 and Wednesday’s FOMC meeting showed that there has been an increase in the Fed tapering earlier than originally expected. Gold saw some safe heaven buying with a ramp up in virus cases, but silver hasn’t been able to find the same interest. Silver ETF holdings also saw a decline this week, showing that the metal has lost the interest of some traders and the short-term trend lower looks to continue in the near term. The bulls are needing to see Sept silver hold the 22.97 level and find some fundamental news to push it back to resistance at 24. A break o 22.97 would likely see a push back down to last week’s flash crash low of 22.295. As of now the bear camp holds control and selling is likely to continue until we see a push above $24 to get some more interest back into the long side.
Silver Sep '21 Daily Chart
If you have any questions or would like to discuss the markets further, please feel free to contact me at 800-826-2270 or therrmann@rjofutures.com. Energy - Dampening Demand Outlook Weighs on Oil
Dampening Demand Outlook Weighs on Oil
By: Alex Turro, Senior Market StrategistPosted Aug 20, 2021 9:53AM CT
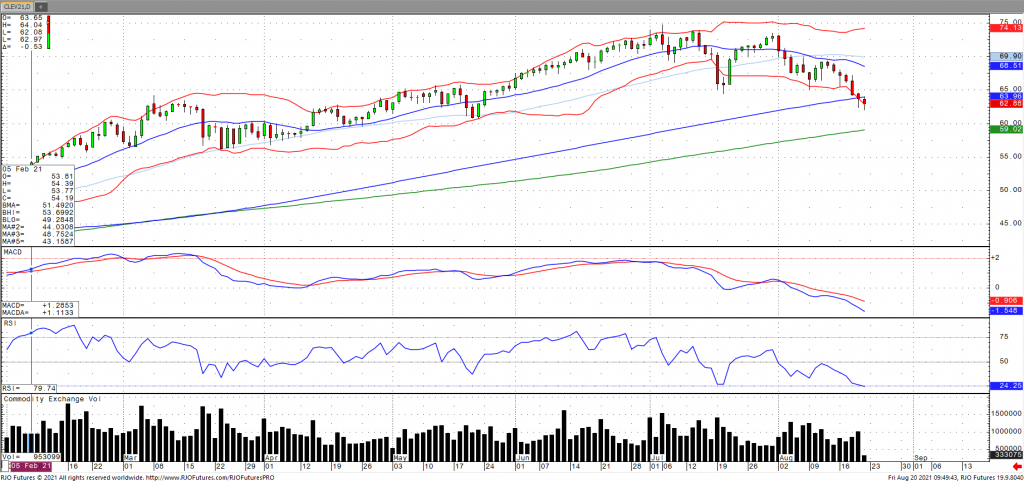
Oil prices are down for the seventh consecutive session on Friday, hovering on three-month lows as the increased cases of the delta variant continue to dampen the global demand outlook. The growing expectation of a reduction asset purchases by the US Federal Reserve has caused the jump in the US Dollar amid this broad risk off sentiment. EIA inventory data was in fact supportive with stocks falling 3.233 million barrels putting supply at the lowest level since January 2020. The US refinery rate came in at 92.2% which should continue to prop up demand for US supplies. Also discounted have been reports that OPEC+ compliance in terms of production came in at 109% for the month of July. Despite down over 6% on the week, oil continues to hold onto bullish trend with today’s range seen between 62.23 – 69.19.
Crude Oil Oct '21 Daily Chart If you have any questions or would like to discuss the markets further, please feel free to contact me at 800-438-4805 or aturro@rjofutures.com. Softs - Macroeconomics Control Commodities – Cocoa
Macroeconomics Control Commodities – Cocoa
By: Peter MoosesPosted 08/20/2021
Grinding data came in better than expected for cocoa. As
traders waited for the data to be released, we saw new lows put in the
September Cocoa contract. European grinding data came in much higher than last
year’s numbers causing a two-day rally in the market. Since the release, we
have seen pullback, most likely profit taking. The world continues to slowly
reopen but as that happens, Covid cases appear to be on the rise in pockets.
This uncertainly and constantly changing data is one of the main reasons for
market volatility.
Technically, the recent rebound has created new support. If the market can trade and hold above 2400, look for more buyers to be attracted back into the market. If clients want exposure for the chance that the market recovery holds, look at further out call options. The demand will eventually return, but the question is when and what will have to take place for investors to believe in the longer-term positive outlook.
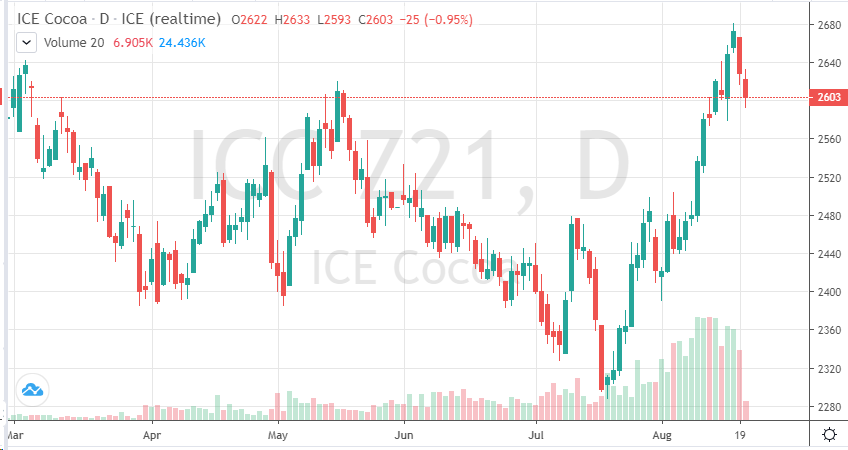
After December cocoa made a new high, it has pulled back to
2600. The macroeconomic picture is pretty gloomy this week. Rising Covid
infections, mixed financial data and currency volatility has made for an
interesting trading week. The COT data released this week should be pretty
telling to see where trader’s heads are at. Production is up, bearish for
prices. Ghana’s output is at the highest level in ten years. The demand tone is
weaker again due to the rising Covid cases and restrictions being put back into
place globally.
For now, traders should look out longer term if they are anticipating a recovery. In the near-term puts may be a good idea for downside protection as the next few months may continue the pattern we saw earlier this year of lower cocoa futures prices. 2500 is a realistic downside target.
On
the heels of mid-Sep-to-early-Oct's steeper, accelerated, 3rd-wave-looking
recovery, the past week-and-a-half's boringly lateral chop is first considered
a corrective/consolidative event that warns of a continuation of the uptrend
that preceded it to new highs above 04-Oct's 891.0 high. This count
remains consistent with our broader base/correction/recovery count introduced
in 13-Sep's Technical Blog following that
day's bullish divergence in short-term momentum above 07-Sep's 809.5 minor
corrective high detailed in the hourly chart below.
The
important takeaway from this month's lateral, sleepy price action is the
definition of Wed's 851.5 low as
the end or lower boundary of a suspected 4th-Wave correction. A failure
below 851.5 will confirm a bearish divergence in daily momentum and defer or
threaten a bullish count enough to warrant non-bullish decisions like
long-covers. A failure below 851.5 will not
necessarily negate a broader bullish count, but it will threaten it enough to
warrant defensive measures as the next pertinent technical levels below 851.5 are
13-Sep's prospective minor 1st-Wave high at 813.8 and obviously 08-Sep's 766.0
low. And making non-bullish decisions "down there" is
sub-optimal to say the least. Per such, both short- and longer-term
commercial traders are advised to pare or neutralize bullish exposure on a
failure below 851.5, acknowledging and accepting whipsaw risk- back above 04-Oct's
891.0 high- in exchange for much deeper and sub-optimal nominal risk below
766.0.
On
a broader scale, the daily log scale chart above shows the developing potential
for a bearish divergence in daily momentum that will be considered confirmed
below 851.5. This chart also shows the past month's recovery thus far
stalling in the immediate neighborhood of the (888.0) Fibonacci
minimum 38.2% retrace of Apr-Sep's entire 1128 - 766 decline). COMBINED
with a failure below 851.5, traders
would then need to be concerned with at least a larger-degree correction pf the
past month's rally and possibly a resumption of Apr-Sep's major downtrend.
Until
and unless the market fails below 851.5 however, we would
remind longer-term players of the key elements on which our bullish count is
predicated:
a confirmed bullish divergence in WEEKLY momentum
(below)
amidst
an
historically low 11% reading in out RJO Bullish Sentiment Index and
a
textbook complete and major 5-wave Elliott sequence down from 29-Apr's
1128 high to 08-Sep's 766.0 low.
Thus
far, the market is only a month into correcting a 4-MONTH, 32% drawdown, so
further and possibly protracted gains remain well within the bounds of a major
(suspected 2nd-Wave) correction of Apr-Sep's decline within an even more
massive PEAK/reversal process from 17-May's 1219 high on an active continuation
basis below.
These
issues considered, a bullish policy and exposure remain advised with a failure
below 851.5 required to defer or threaten this call enough to warrant moving to
a neutral/sideline position. In lieu of such weakness, we anticipate a
continuation of the past month's rally to new highs and potentially significant
gains above 891.0.
Agricultural - Grains - Under Pressure
Grains - Under Pressure
By: Michael Sabo, Senior Market StrategistPosted Aug 20, 2021 10:25AM CT
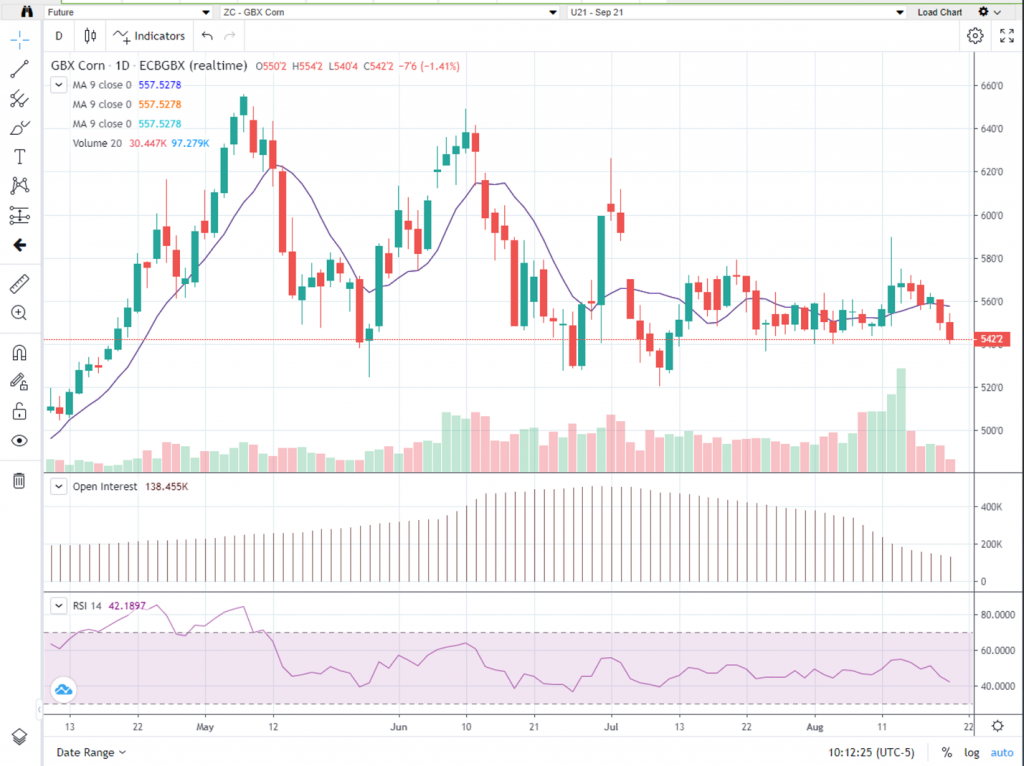
Corn
started the week off with several days of consolidation until it finally pushed
through last week’s low today. While the week as a whole was not a victory for
the bulls, I would say it’s also not a victory for the bears – more of a draw.
At the time of this writing, Sept corn is trading around $5.41. The market may
be getting ready for a possible bullish set up. Why do I say that? Look at the volume,
open interest, and price (see Sept corn daily chart below). The price has
fallen over the last week (although still trading in the “big picture” bullish
range) volume has fallen and so has open interest. This generally signifies
that the market is ready to strengthen and turn bullish as weak longs are
pushed out of the market. Last week I warned “With that said be cautious as the
large trading ranges could come back into play and easily push “weak” longs out
of the market.” I believe that is exactly what we are seeing. In last week’s USDA
Report yields were lowered from 179.5 to 174.6 which was below the range of
estimates and is long term bullish for the market. Short-term technical
indicators turned up for a bit but have mostly pushed into oversold territory
another “tell” suggesting the market may be gearing up for something big. Any weather improvement at this point will
have little impact on corn yields, the damage to yields has been done.
In
a previous article I advised the key numbers to watch were $5.81 ½ on the
upside and $5.19 ½ on the downside. I still believe a close above or below
those points are key.
I would suggest using an option strategy to manage your futures position risk or an outright option strategy. Implied option volatility recently came down but is still relatively high compared to historical vol levels. You may want to incorporate some short options into your strategy in a calculated risk manner such as bull or bear option spreads. I have 25 years of grain market experience, please feel free to call me at 1-800-367-7290 for more details or to discuss in depth trading strategies. Also be sure to check out my past weekly grain market updates posted on our website.
Corn Daily Chart If you have any questions or would like to discuss the markets further, please feel free to contact me at 800-367-7290 or msabo@rjofutures.com. Interest Rates - Hawkish Fed Impacting Interest Rates
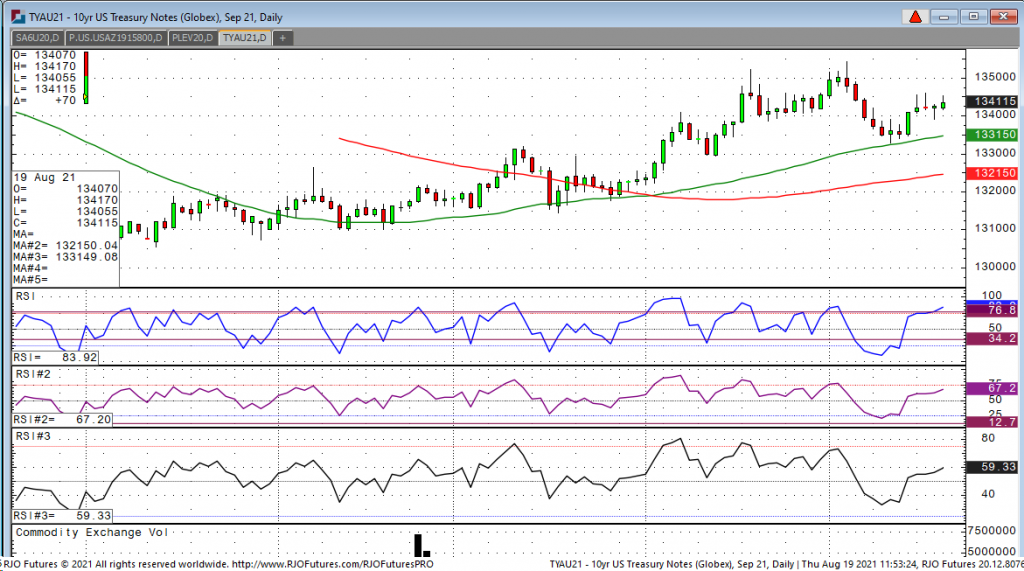
Looking at the September 10-year note we have a high of 134-17 and a low of 134-055 and currently we are trading at 134-11. Looking back this week, we have a had a few important items that have moved the treasuries. Earlier this week, we saw a very weak retail sales which many economists have predicted due to the resurgence of the delta virus that is starting to take hold across the US. So, the weak number was not much of a surprise, but for treasury bears, not welcomed news as their hopes of the Fed starting to taper might not happen as quickly as they anticipated. Yesterday, a fed governor came on tape late in the day and said he would like to see the Fed taper as early as September as he sees employment continue to gain steam. He also stated that he sees inflation at 2.5 % in 2022, which is higher than the Fed’s magic number of 2.0%. So, what we’re seeing here this week is a clash between weaker data and a hawkish Fed governor. One market that is usually a good indicator of where treasuries might move next is the Japanese Yen. Usually when the treasuries rise, the dollar gets weak vs the yen and vice versa. When treasuries fall, usually the dollar gets strong, but what we have been seeing this week is the $ very strong against the yen and treasuries strong as well. One answer might be the Taliban taking over Kabul and the market might be seeing a geopolitical rest developing.
10-Year Note Sep '21 Daily Chart If you have any questions or would like to discuss the markets further, please feel free to contact me at 800-826-2270 or gperlin@rjofutures.com. Equity - Stocks Strong in Early Going
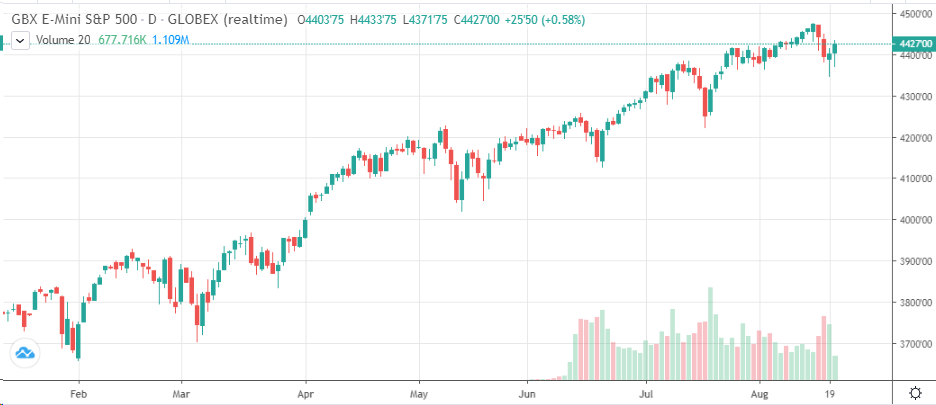
Stocks Strong in Early Going
By: Bill Dixon, Senior Market StrategistPosted Aug 20, 2021 10:04AM CT
Stocks are running higher this morning with the four major indices all up at least half a percent. Concerns the delta variant will slow growth, unrest in the Afghanistan, Chinese crackdowns, weak retail sales on Tuesday, and Fed tapering talk seem to be some of the main culprits behind the Monday-Thursday selloff. However, market participants have a hard time resisting the urge to buy a good dip. A quick look at the daily S&P and Nasdaq charts will tell you that if you see red for two consecutive days, you should look for a place to buy a new low on that third day. We made a new low for the move in the early going yesterday before the buying came in.
The debate about inflation continues to play out (so far deflation is winning). The Fed continues to say this is transitory, and many commodity markets seem to believe them. Next Friday’s Personal Income release will clue us in on how the Fed’s favorite measure of inflation (PCE) is tracking. Regardless of the reading, I don’t expect Powell to back off his stance on the matter. We’ll get GDP data next Thursday, a day that also marks the beginning of the Jackson Hole Symposium.
E-mini S&P 500 Daily Chart If you have any questions or would like to discuss the markets further, please feel free to contact me at 800-669-5354 or bdixon@rjofutures.com. Economy - S-T Mo Failure Insufficient to End RBOB Correction, But Beware
S-T Mo Failure Insufficient to End RBOB Correction, But Beware
By: RJO Market InsightsPosted 11/08/2022
Posted on Nov 08, 2022, 07:51 by Dave Toth
In Fri's Technical Webcast we identified a
minor corrective low at 2.6328 from Thur as a mini risk parameter the market
needed to sustain gains above to maintain a more immediate bullish count.
The 240-min chart below shows the market's failure overnight below this level,
confirming a bearish divergence in very short-term momentum. This mo
failure defines Fri's 2.8172 high as
one of developing importance and a parameter from which very short-term traders
can objectively base non-bullish decisions like long-covers.
Given
the magnitude of the past three weeks' broader recovery however, this
short-term momentum failure is of an insufficient scale to conclude anything
more than another correction within this broader recovery from 26-Sep's 2.1877
low. Indeed, overnights failure below 2.6328 only allows us to conclude
the end of the portion of the month-and-a-half rally from 31-Oct's 2.4822 next
larger-degree corrective low. 2.4822 is the
risk parameter this market still needs to fail below to break the uptrend from
18-Oct's 2.3526 low while this 2.3526 low
remains intact as the risk parameter this market needs to fail below to break
the month-and-a-half uptrend. From an
intermediate-to-longer-term perspective, this week's setback falls well within
the bounds of another correction ahead of further gains. This is another
excellent example of the importance of technical and trading SCALE and
understanding and matching directional risk exposure to one's personal risk
profile.
The
reason overnight's admittedly minor mo failure might have longer-term
importance is the 2.8172-area from which it stemmed. In
Fri's Technical Blog we also noted the market's engagement of the
2.8076-to-2.8159-area marked by the 61.8% retrace of Jun0-Sewp's 3.2758 -2.1877
decline and the 1.000 progression of Sep-Oct's initial 2.1877 - 2.6185
(suspected a-Wave) rally from 18-Oct's 2.3526 (suspected b-Wave) low. We
remind longer-term players that because of the unique and compelling confluence
of:
early-Aug's bearish divergence in WEEKLY momentum
amidst
historically
extreme bullish sentiment/contrary opinion levels in our RJO Bullish
Sentiment Index
an
arguably complete and massive 5-wave Elliott sequence from Mar'20's 0.4605
low to Jun's 4.3260 high (as labeled in the weekly log active-continuation
chart below) and
the
5-wave impulsive sub-division of Jun-Sep's (suspected initial 1st-Wave) decline
The
recovery attempt from 26-Sep's 2.1877 low is arguably only a 3-wave (Wave-2)
corrective rebuttal to Jun-Sep's decline within a massive, multi-quarter
PEAK/reversal process. Now granted, due to the magnitude of 2020 -2022's
secular bull market, we discussed the prospect for this (2nd-Wave corrective)
recovery to be "extensive" in terms of both price and time. A
"more extensive" correction is typified by a retracement of 61.8% or
more and spanning weeks or even months following a 3-month decline. Per
such, the (suspected corrective) recovery from 26-Sep's 2.1877 low could easily
have further to go, with commensurately larger-degree weakness than that
exhibited this week (i.e., a failure below at least 2.4822) required
to consider the correction complete. Indeed, the daily log chart above
shows the market thus far respecting former 2.6185-area resistance from 10-Oct
as a new support candidate.
These
issues considered, very shorter-term traders have been advised to move to a neutral/sideline
position following overnight's momentum failure below 2.6328, with a recovery
above 2.8172 required to negate this call, reaffirm the recovery and re-expose
potentially significant gains thereafter. For intermediate- and
longer-term players, a bullish policy and exposure remain advised with a
failure below 2.4822 required to threaten this call enough to warrant
neutralizing exposure. We will be watchful for another bearish divergence
in momentum following a recovery attempt that falls short of Fri's 2.8172 high
that would be considered the next reinforcing factor to a count calling that
2.8172 high the prospective end to the month-and-a-half 2nd-Wave
correction. In lieu of such, a resumption of the current rally to
eventual new highs above 2.8172 should not surprise.
By: John Caruso, Senior Market StrategistPosted Aug 20, 2021 8:44AM CT
Good morning,
I’m in the office this morning, so thanks for baring with
me.
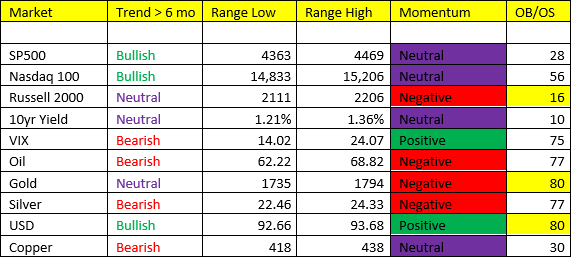
We highlighted some significant developments in our TRM table yesterday. Namely, USD transitioning to bullish trend, and key economic bellwether commodities, copper and oil flipping to bearish trend. Now, the cycle – Scenario 3 to Scenario 4 (still up for debate, but probable), and back to potentially Scenario 2/3 into yearend. So yeah, this is what we’re dealing with, a multiple personality style market. Now before you get all “beared up”, we think the probability of Scenario 4 is what we’d call “shallow”. I don’t expect anything treacherous, the Fed is watching and waiting for the appropriate time to begin the taper (which should’ve began in Q2 2021 but fairly typical they’re behind the curve). So, my point being, don’t fall in love with any particular market theme or trade. Again, today’s market is likely not going to be tomorrow’s, and all of these trends could reverse, AGAIN, within a week’s time. Tread lightly.
If you’re forcing me to look hard into the future, say over the next 12 months – it’s true, we could see a deep period of potential deleveraging/disinflation out into mid-year 2022. The year/year comps 6-12 months out are going to be nearly impossible to top vs what we just experienced in Q1/Q2 of 2021. On top of the comps, the Fed is likely to be at its most “Hawkish” point in its taper cycle…while the cycle is demonstrably SLOWING.
USD: breakout, bullish trend, immediate OB at the top of the range. This is how it could play out in the near-term: the Delta (and now Lambda) variant are a real threat – let’s say the Fed gets cold feet about the taper at Jackson Hole next week….well then we could see more pin action lower in the USD, back to BEARISH, and a resumption of the inflation trade in the NEAR-TERM. We do think that the possibility of the virus bleeding into the mid-term elections is possible/probable as we know how DC likes to play their “never let a crisis go to waste” game. The variables of what could happen from here are endless. Embrace the uncertainty.
Stocks- The IVOL premiums were huge when I looked yesterday morning, which makes us skeptical of the possibility of a “deep” correction (10% or greater). There’s too much big money betting/hedging on volatility. The NASDAQ IVOL premium is currently at 92% !! Wall Street is paying up BIG for protection, and markets don’t tend to CRASH while the market is expecting it too.
Gold- looks interesting to me here. With the flash crash of 2 weeks ago Sunday, that sent gold down nearly $100 in a blink, I think my range indicators are “off”. That was clearly a ‘false’ manipulated move, and it has thrown my range analysis off. I think so long as we hold above 1760, gold could be setting for another run towards 1820. We did see Peter Thiel in his June SEC filing reportedly purchased $50M worth of gold bars (not stocks, etfs, miners, but GOLD BARS), citing the rising probability of black swan events in the future. I don’t know what to make of this really, because $50M to a guy worth nearly $10B could simply be diversification purposes, but it’s certainly notable, but not the reason why I’m interested in gold again. With a blend of Scen. 3/4 we think gold will have its moments throughout the rest of Q3 – but choose your spots wisely. More on gold later.
If you have any questions or would like to discuss the markets further, please feel free to contact me at 800-669-5354 or jcaruso@rjofutures.com.