Looking to diversify your investment portfolio with futures trading, but lack the expertise on your own? Trading Systems and their programs are now listed on our website complete with track records, products traded and minimum account requirements and fees. If you need help navigating the site and viewing the results, give us a call.
New: Micro Bitcoin Investor Kit
Bitcoin is on an unprecedented run and is at the forefront of the trend in cryptocurrency and as a response, the CME has released a micro Bitcoin futures contract that is 1/10th the size of a regular Bitcoin futures contract. Learn everything you need to trade the micro Bitcoin futures contract with this Investor Kit!
The Markets
Metals - Bad News is Good for Gold
Bad News is Good for Gold
By: Frank J. Cholly, Senior Market StrategistPosted Oct 8, 2021 8:53AM CT
There you have it! Proof that gold needs the Fed’s easy
money policy to rally. At least for the short term. Bad economic data leads
traders to believe that the Fed cannot take away the punch bowl just yet.
However, I still believe that the next big bull market in gold will be driven
by long term inflation. How long will they try to tell themselves that this is
“transitory”? How long exactly is transitory? How much more evidence does the Fed
need to see in terms of inflated costs?
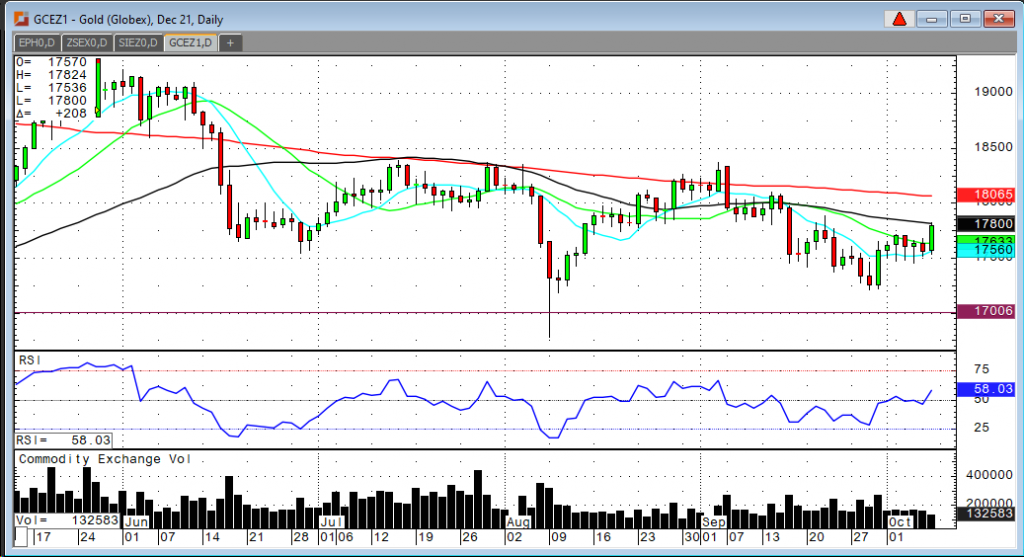
But let’s focus on today. The monthly jobs report was a big miss from what the market was looking for. The market was expecting added jobs in September to be in the neighborhood of 475,000 to 500,00. What we got was 194,000 jobs added. A big miss. The lowest number this year! So, a big miss like that ahead of next months Fed Announcement leads traders to believe that the Fed will not need to get aggressive with tapering or move projected rate hike dates up. Gold is up $22.00 after this bad jobs number. If gold today can close above $1,781, the 5- day moving average, that would be considered friendly to the gold bulls. Next technical level to the upside would then be $1,800.
Gold Dec '21 Daily Chart If you have any questions or would like to discuss the markets further, please feel free to contact me at 800-826-4124 or fcholly@rjofutures.com. Metals - Silver Looking to Rebound
Silver Looking to Rebound
By: Eli Tesfaye, Senior Market StrategistPosted Oct 8, 2021 11:22AM CT
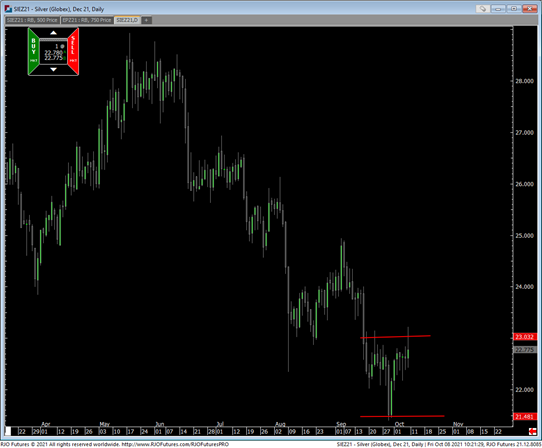
The Silver market is looking to set up for a rebound. Currently, the market is trading 10 cents positive. The big news is that Senate extended the debit limit by two more months. I think President Biden will get his bill passed down the road, and there may be an inflation pressure around the corner. Current price action will probably invite some bargain hunters to get involved on the long side at these price levels.
The technical landscape slightly tilted in favor of the bull camp. A close over 23.00 will signal near-term lows are in but do not rule out a "break to the downside below 20.00" and a subsequent reversal. Markets tend to do this when they are confirming lows. Reach out to me if you want to approach this market using options. Also, there is a mini contract for silver if you're going to test the waters.
Silver Dec '21 Daily Chart If you have any questions or would like to discuss the markets further, please feel free to contact me at 800-367-7290 or etesfaye@rjofutures.com. Energy - Oil Taps $80 a Barrel for the First Time Since 2014
Oil Taps $80 a Barrel for the First Time Since 2014
By: Alex Turro, Senior Market StrategistPosted Oct 8, 2021 9:54AM CT
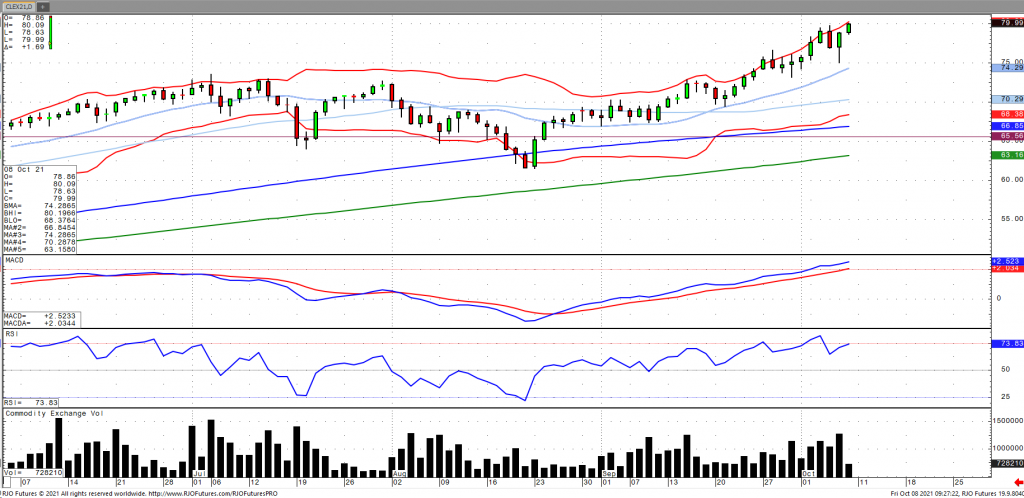
Oil prices continued to ramp higher on Friday morning as the market assess the possibility of additional consumption of global petroleum through the substitution of higher priced gas to oil as well as the uncertainty of the US releasing their strategic reserves. Lending support was the return of Chinese demand from holiday as well as reports from OPEC+ on Monday that that they will not be increasing monthly production by more than initial expectation of 400k barrels per day. Crude stocks increased for the second week in a row, building 2.345 million barrels with stocks now 72.040 million barrels below last year and 32.037 million barrels below the five-year average, according the EIA. This comes on the back of exports falling to the lowest since early August to 2.114m bpd as well as imports increasing to 7.035m bpd, the highest since mid-July. The market remains bullish trend with today’s range seen between 73.46 – 79.81.
Crude Oil Nov '21 Daily Chart If you have any questions or would like to discuss the markets further, please feel free to contact me at 800-438-4805 or aturro@rjofutures.com. Softs - Cocoa Supply, The Weaker Euro, and The U.S. Debt Ceiling
Cocoa Supply, The Weaker Euro, and The U.S. Debt Ceiling
By: Peter MoosesPosted 10/08/2021
As
it appears the U.S. will extend their debt limit in the coming days markets are
finding support. We’ve seen volatility in the global markets over the past week
stemming from debt concerns, weakness in the Euro and split news about the
progress in the battle against Covid. As more individuals get vaccinated
against Covid, it appears numbers in cases, hospitalizations and deaths are
headed in the right direction – but this depends where you are looking. There
are still many parts of the world struggling to recover physically and
economically after the past year and half. As we enter the fall and winter
seasons and holiday season, we’ll see what the trajectory is of the virus.
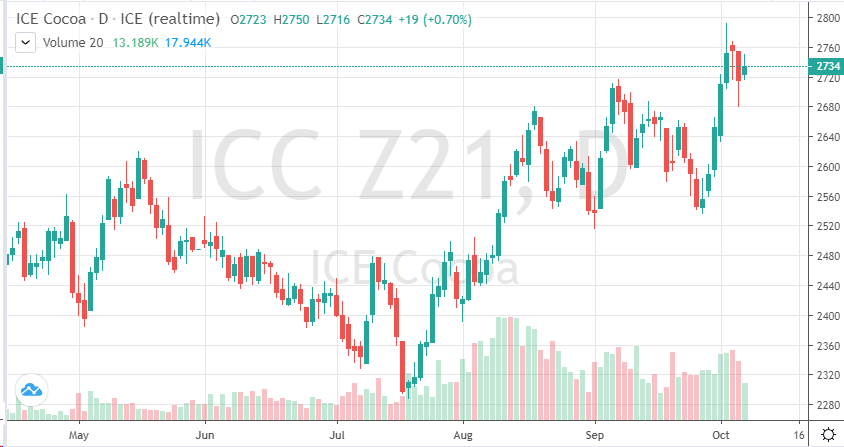
The equity markets, both European and U.S. have provided strain on commodities. Cocoa has managed to stage a rally earlier this week, trying to hit a new high of 2800 – but we have seen a big pullback the past few sessions. The key for the bulls is if production will really be lower than anticipated. This key will guide the cocoa market to start Q4.
On
the heels of mid-Sep-to-early-Oct's steeper, accelerated, 3rd-wave-looking
recovery, the past week-and-a-half's boringly lateral chop is first considered
a corrective/consolidative event that warns of a continuation of the uptrend
that preceded it to new highs above 04-Oct's 891.0 high. This count
remains consistent with our broader base/correction/recovery count introduced
in 13-Sep's Technical Blog following that
day's bullish divergence in short-term momentum above 07-Sep's 809.5 minor
corrective high detailed in the hourly chart below.
The
important takeaway from this month's lateral, sleepy price action is the
definition of Wed's 851.5 low as
the end or lower boundary of a suspected 4th-Wave correction. A failure
below 851.5 will confirm a bearish divergence in daily momentum and defer or
threaten a bullish count enough to warrant non-bullish decisions like
long-covers. A failure below 851.5 will not
necessarily negate a broader bullish count, but it will threaten it enough to
warrant defensive measures as the next pertinent technical levels below 851.5 are
13-Sep's prospective minor 1st-Wave high at 813.8 and obviously 08-Sep's 766.0
low. And making non-bullish decisions "down there" is
sub-optimal to say the least. Per such, both short- and longer-term
commercial traders are advised to pare or neutralize bullish exposure on a
failure below 851.5, acknowledging and accepting whipsaw risk- back above 04-Oct's
891.0 high- in exchange for much deeper and sub-optimal nominal risk below
766.0.
On
a broader scale, the daily log scale chart above shows the developing potential
for a bearish divergence in daily momentum that will be considered confirmed
below 851.5. This chart also shows the past month's recovery thus far
stalling in the immediate neighborhood of the (888.0) Fibonacci
minimum 38.2% retrace of Apr-Sep's entire 1128 - 766 decline). COMBINED
with a failure below 851.5, traders
would then need to be concerned with at least a larger-degree correction pf the
past month's rally and possibly a resumption of Apr-Sep's major downtrend.
Until
and unless the market fails below 851.5 however, we would
remind longer-term players of the key elements on which our bullish count is
predicated:
a confirmed bullish divergence in WEEKLY momentum
(below)
amidst
an
historically low 11% reading in out RJO Bullish Sentiment Index and
a
textbook complete and major 5-wave Elliott sequence down from 29-Apr's
1128 high to 08-Sep's 766.0 low.
Thus
far, the market is only a month into correcting a 4-MONTH, 32% drawdown, so
further and possibly protracted gains remain well within the bounds of a major
(suspected 2nd-Wave) correction of Apr-Sep's decline within an even more
massive PEAK/reversal process from 17-May's 1219 high on an active continuation
basis below.
These
issues considered, a bullish policy and exposure remain advised with a failure
below 851.5 required to defer or threaten this call enough to warrant moving to
a neutral/sideline position. In lieu of such weakness, we anticipate a
continuation of the past month's rally to new highs and potentially significant
gains above 891.0.
Agricultural - Corn - Another Inside Week
Corn - Another Inside Week
By: Michael Sabo, Senior Market StrategistPosted Oct 8, 2021 10:38AM CT
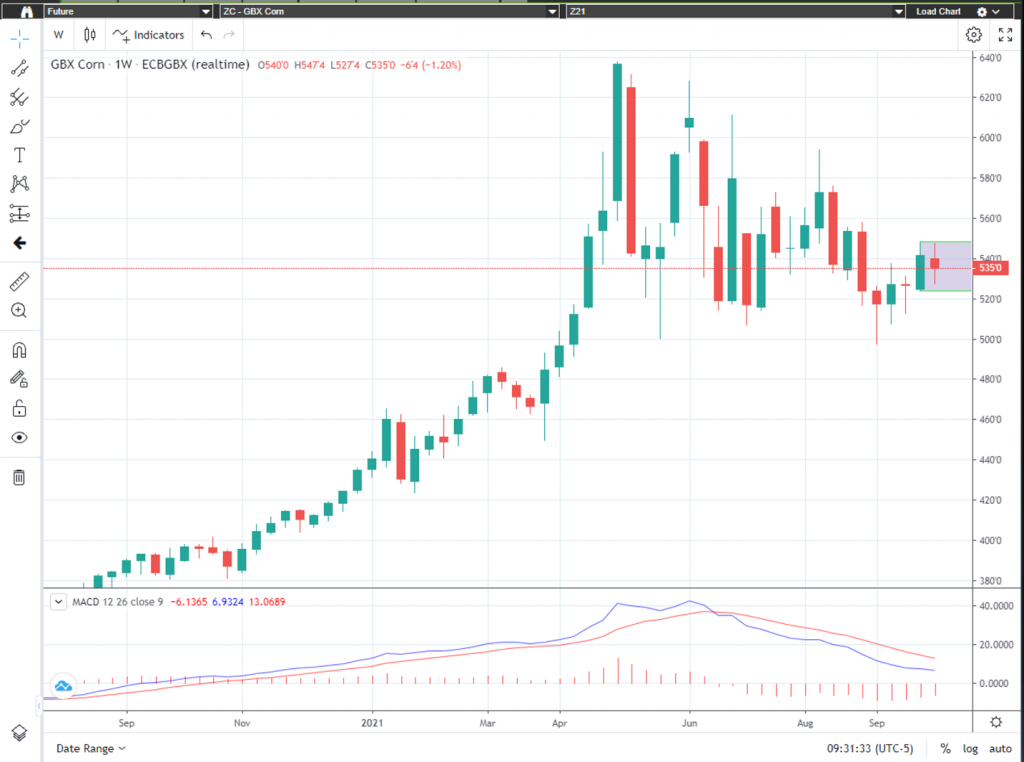
Three weeks ago, I advised
traders on the following “Below is a weekly December corn chart, as one can see,
this week December corn is trading inside last weeks price range. If it closes
out the week this way (and I think it will) next week’s key short-term numbers
to watch will be $5.38 ½ on the upside and $5.06 ½ on the downside. I would
recommend traders take their cue from the breakout.” The was the week of September 20. Last week December
corn broke above the $5.38 ½ level and moved to a high of $5.48 ½ before
backing off and closing the week at $5.41 ½ - while we didn’t see corn make
huge moves to the upside it was still a very solid showing for the week and
more importantly confirmed the chart model I am following. This week is showing
us another inside week setup. Traders should watch for a break above $5.49 or a
break below $5.23, basically last week’s range. I am still cautiously bullish
and believe Dec corn has additional upside if the fundamentals continue to
remain in the range of estimates or come in bullish. On Tuesday October 12th
USDA Supply Demand and Crop Production Reports will be released at 11am cst,
make sure you have adequate risk management strategies in place to protect your
positions as this market seems to be “coiling up”!
The “big picture” numbers remain the
same and probably will for some time. I firmly believe a break below $4.96 could
give the bears control of the market and a break above $6.39 ½ on the upside may
have enough bulls behind it to propel corn to all-time highs. There are several
minor areas of support and resistance inside this range that can help with
short term market direction if violated. Call me directly at 1-800-367-7290 for
more in-depth discussion on these numbers and to discuss trading strategies
specific to your situation.
I would suggest using an option
strategy to manage your futures position risk or an outright option strategy.
Implied option volatility has come down quite a bit from its most recent highs
mainly due to the consolidation and tighter trading ranges. I have 25 years of grain
market experience, feel free to call or email with any questions you may have. Be sure to check out my archived weekly grain
market insight articles posted on our website.
**** Reserve
your FREE 2022 Commodity Trading Guide Today! ****
This 55-page guide is packed with indispensable market information. It has a complete commodity calendar listing all major market reports, option expiration dates, futures first notice dates, futures last trading dates, etc. It readily serves as your commodity market encyclopedia and has a market almanac for all regularly traded commodities. To reserve your copy today email me at msabo@rjofutures.com with your name, mailing address and a preferred contact number so we can confirm your information and I will have your copy reserved and ready to send out as soon as we receive them.
Corn Dec '21 Daily Chart If you have any questions or would like to discuss the markets further, please feel free to contact me at 800-367-7290 or msabo@rjofutures.com. Equity - Stocks Mixed This Morning
Stocks Mixed This Morning
By: Jeff Yasak, Senior Market StrategistPosted Oct 8, 2021 9:28AM CT
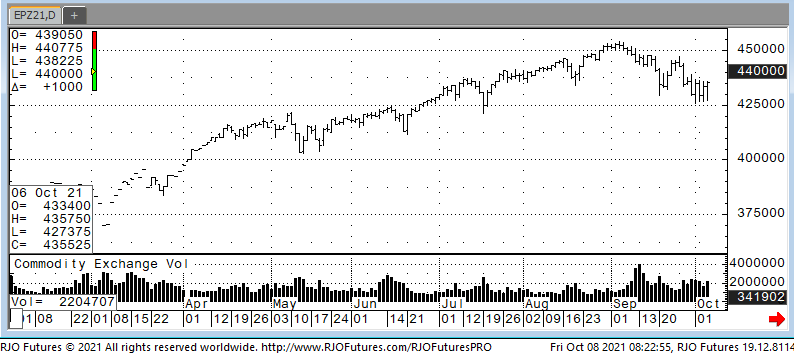
U.S. stock futures
are mixed this morning as traders took in a key report on the labor market’s
recovery. The S&P was down slightly a reversal from a third straight day of
gains. The rally was part due to the Senate leaders reaching an agreement on
raising the government borrowing limit into December, avoiding a default as
early as this month. They voted to
increase by $480 billion and it will head to the House of Representatives
today. With the budget temporarily out
of the way the focus was switched to the latest job report which showed another
miss on payroll gains following a disappointing August number. Non-farm payrolls only rose by 194,000,
missing the expected 500,000 number. The
unemployment number fell more than expected to 4.8% but it was followed by a
poor labor force participation rate of 61.6% versus 61.7% in August. Even with
the payroll miss in September the report may still be strong enough to trigger
a tapering from the Federal Reserve.
Jerome Powell said it would only take a “reasonably good report” in
September to meet the Fed’s threshold.
Support today is 435500 and 432500 with resistance at 442500 and 446000.
E-mini S&P 500 Daily Chart If you have any questions or would like to discuss the markets further, please feel free to contact me at 888-861-1656 or jyasak@rjofutures.com. Economy - S-T Mo Failure Insufficient to End RBOB Correction, But Beware
S-T Mo Failure Insufficient to End RBOB Correction, But Beware
By: RJO Market InsightsPosted 11/08/2022
Posted on Nov 08, 2022, 07:51 by Dave Toth
In Fri's Technical Webcast we identified a
minor corrective low at 2.6328 from Thur as a mini risk parameter the market
needed to sustain gains above to maintain a more immediate bullish count.
The 240-min chart below shows the market's failure overnight below this level,
confirming a bearish divergence in very short-term momentum. This mo
failure defines Fri's 2.8172 high as
one of developing importance and a parameter from which very short-term traders
can objectively base non-bullish decisions like long-covers.
Given
the magnitude of the past three weeks' broader recovery however, this
short-term momentum failure is of an insufficient scale to conclude anything
more than another correction within this broader recovery from 26-Sep's 2.1877
low. Indeed, overnights failure below 2.6328 only allows us to conclude
the end of the portion of the month-and-a-half rally from 31-Oct's 2.4822 next
larger-degree corrective low. 2.4822 is the
risk parameter this market still needs to fail below to break the uptrend from
18-Oct's 2.3526 low while this 2.3526 low
remains intact as the risk parameter this market needs to fail below to break
the month-and-a-half uptrend. From an
intermediate-to-longer-term perspective, this week's setback falls well within
the bounds of another correction ahead of further gains. This is another
excellent example of the importance of technical and trading SCALE and
understanding and matching directional risk exposure to one's personal risk
profile.
The
reason overnight's admittedly minor mo failure might have longer-term
importance is the 2.8172-area from which it stemmed. In
Fri's Technical Blog we also noted the market's engagement of the
2.8076-to-2.8159-area marked by the 61.8% retrace of Jun0-Sewp's 3.2758 -2.1877
decline and the 1.000 progression of Sep-Oct's initial 2.1877 - 2.6185
(suspected a-Wave) rally from 18-Oct's 2.3526 (suspected b-Wave) low. We
remind longer-term players that because of the unique and compelling confluence
of:
early-Aug's bearish divergence in WEEKLY momentum
amidst
historically
extreme bullish sentiment/contrary opinion levels in our RJO Bullish
Sentiment Index
an
arguably complete and massive 5-wave Elliott sequence from Mar'20's 0.4605
low to Jun's 4.3260 high (as labeled in the weekly log active-continuation
chart below) and
the
5-wave impulsive sub-division of Jun-Sep's (suspected initial 1st-Wave) decline
The
recovery attempt from 26-Sep's 2.1877 low is arguably only a 3-wave (Wave-2)
corrective rebuttal to Jun-Sep's decline within a massive, multi-quarter
PEAK/reversal process. Now granted, due to the magnitude of 2020 -2022's
secular bull market, we discussed the prospect for this (2nd-Wave corrective)
recovery to be "extensive" in terms of both price and time. A
"more extensive" correction is typified by a retracement of 61.8% or
more and spanning weeks or even months following a 3-month decline. Per
such, the (suspected corrective) recovery from 26-Sep's 2.1877 low could easily
have further to go, with commensurately larger-degree weakness than that
exhibited this week (i.e., a failure below at least 2.4822) required
to consider the correction complete. Indeed, the daily log chart above
shows the market thus far respecting former 2.6185-area resistance from 10-Oct
as a new support candidate.
These
issues considered, very shorter-term traders have been advised to move to a neutral/sideline
position following overnight's momentum failure below 2.6328, with a recovery
above 2.8172 required to negate this call, reaffirm the recovery and re-expose
potentially significant gains thereafter. For intermediate- and
longer-term players, a bullish policy and exposure remain advised with a
failure below 2.4822 required to threaten this call enough to warrant
neutralizing exposure. We will be watchful for another bearish divergence
in momentum following a recovery attempt that falls short of Fri's 2.8172 high
that would be considered the next reinforcing factor to a count calling that
2.8172 high the prospective end to the month-and-a-half 2nd-Wave
correction. In lieu of such, a resumption of the current rally to
eventual new highs above 2.8172 should not surprise.
By: John Caruso, Senior Market StrategistPosted Oct 7, 2021 11:25AM CT
John Caruso comments on the strong rally we are seeing the equity markets today and how it could shake out the rest of the day and into next week. If you have any questions or would like to discuss the markets further, please feel free to contact me at 800-669-5354 or jcaruso@rjofutures.com.