Looking to diversify your investment portfolio with futures trading, but lack the expertise on your own? Trading Systems and their programs are now listed on our website complete with track records, products traded and minimum account requirements and fees. If you need help navigating the site and viewing the results, give us a call.
New: Micro Bitcoin Investor Kit
Bitcoin is on an unprecedented run and is at the forefront of the trend in cryptocurrency and as a response, the CME has released a micro Bitcoin futures contract that is 1/10th the size of a regular Bitcoin futures contract. Learn everything you need to trade the micro Bitcoin futures contract with this Investor Kit!
The Markets
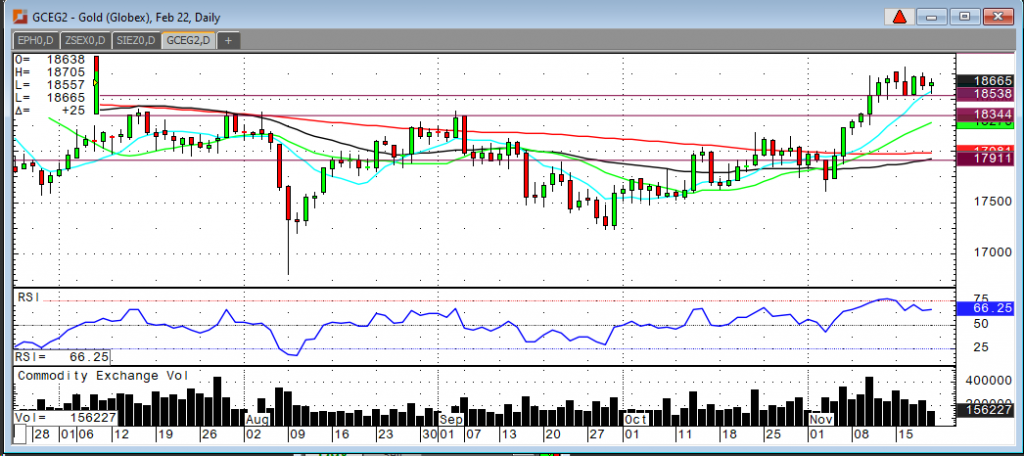
Metals - Gold is Coiling Before Secondary Rally
Gold is Coiling Before Secondary Rally
By: Frank J. Cholly, Senior Market StrategistPosted Nov 19, 2021 8:57AM CT
It’s no surprise that gold is taking a “breather” after adding $100 in premium in the first half of November. A bid of consolidation is in order before resumption of the rally. So far, $1,850 support has held up well, but a breakout above $1,875 is necessary to kickstart a secondary rally towards $1,900. In spite of US dollar strength, I still have a high degree of confidence that gold will continue to attract new buyers. As gold prices begin to move above $1,900 the buying will become more aggressive as “fear of missing out” will kick into high gear. You see, gold is that rare commodity that attracts more buyers at higher levels. When it comes to gold, higher prices do not curb demand like it does in other raw commodities, and we cannot just open the spicket and more gold pours out. It just doesn’t work that way.
Silver has been lagging and I don’t expect that to last much longer. Silver has struggled to punch through $25.50, but once it does, silver will rally very quickly towards $28.00.
Gold Feb '22 Daily Chart If you have any questions or would like to discuss the markets further, please feel free to contact me at 800-826-4124 or fcholly@rjofutures.com. Energy - Oil Falls on Possible Reserve Release
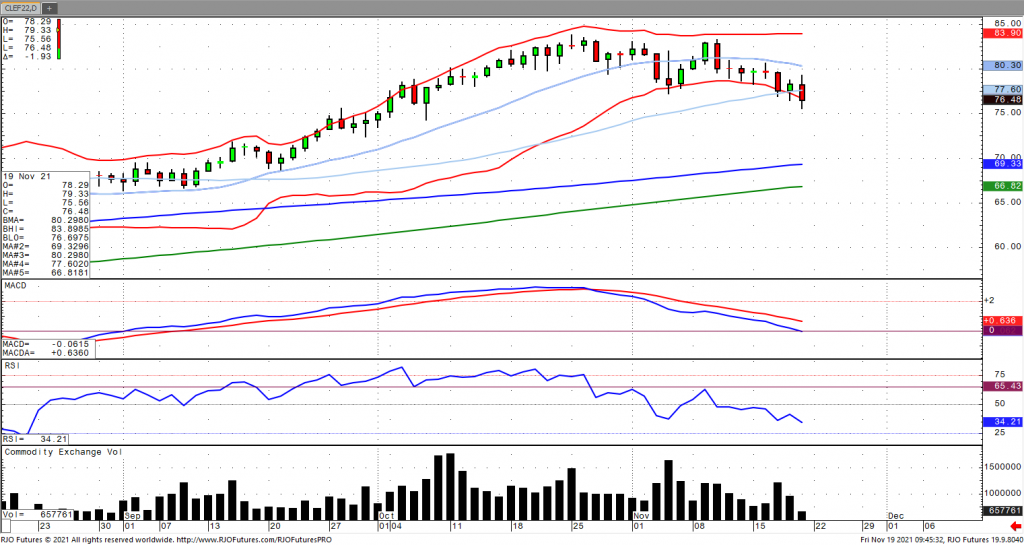
Oil Falls on Possible Reserve Release
By: Alex Turro, Senior Market StrategistPosted Nov 19, 2021 10:06AM CT
Oil prices are poised for their fourth consecutive weekly decline as we come into options expiration amid a recent surge of Covid cases in Europe as well as the possibility of the release of strategic reserves. This global coordinated effort is rumored to be led by China who may release 7 million barrels from their strategic reserve. Largely discounted were reports that OPEC+ output last month came in below their expectations. Oil inventories reported a draw of -2.101 million barrels against an expected build, registering its first draw in four weeks, according to the EIA. Stocks are now down -11.5% year over year and 3.1% below the 5-year average. The market remains bullish trend with today’s range seen between 77.14 – 84.78.
Crude Oil Jan '22 Daily Chart If you have any questions or would like to discuss the markets further, please feel free to contact me at 800-438-4805 or aturro@rjofutures.com. Softs - Fundamentals Carry Cocoa Futures Higher
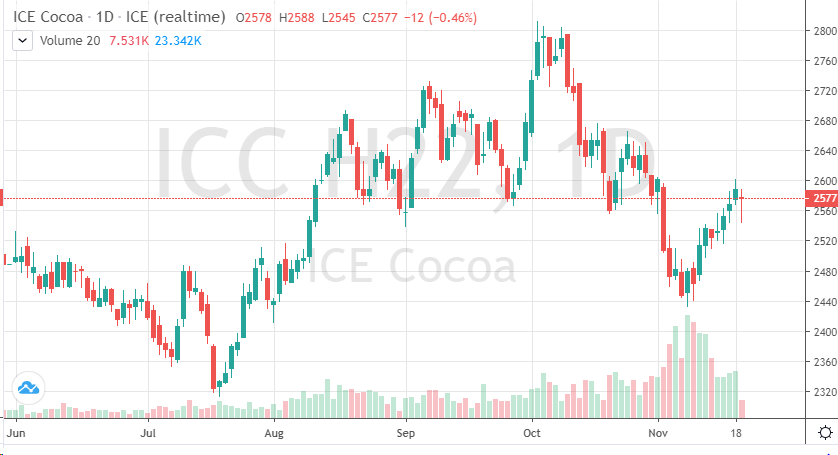
Fundamentals Carry Cocoa Futures Higher
By: Peter MoosesPosted 11/19/2021
Supply
and demand news for cocoa has been positive of late. The fundamental side of
the equation has been helping bullish traders at the halfway point of the
quarter. Demand for chocolate has been higher during the holiday season.
Grinding data has also provided support. The currencies have also helped the
recent rally. The Euro’s correlation to cocoa has helped prices move back to
prices we saw last month.
Current
weather patterns in key growing regions are somewhat supportive for more
production – but light rain and hot temperatures may keep data intact at
current estimates. The next few weeks will be telling.
Technically, we are at a key point of resistance. After the recent rally, prices have failed to move above 2600 and hold. Friday’s trade showed a big pullback in prices as some trader’s appeared to take profits from the recent move. The COT data released later should be telling on where traders are positioning themselves.
On
the heels of mid-Sep-to-early-Oct's steeper, accelerated, 3rd-wave-looking
recovery, the past week-and-a-half's boringly lateral chop is first considered
a corrective/consolidative event that warns of a continuation of the uptrend
that preceded it to new highs above 04-Oct's 891.0 high. This count
remains consistent with our broader base/correction/recovery count introduced
in 13-Sep's Technical Blog following that
day's bullish divergence in short-term momentum above 07-Sep's 809.5 minor
corrective high detailed in the hourly chart below.
The
important takeaway from this month's lateral, sleepy price action is the
definition of Wed's 851.5 low as
the end or lower boundary of a suspected 4th-Wave correction. A failure
below 851.5 will confirm a bearish divergence in daily momentum and defer or
threaten a bullish count enough to warrant non-bullish decisions like
long-covers. A failure below 851.5 will not
necessarily negate a broader bullish count, but it will threaten it enough to
warrant defensive measures as the next pertinent technical levels below 851.5 are
13-Sep's prospective minor 1st-Wave high at 813.8 and obviously 08-Sep's 766.0
low. And making non-bullish decisions "down there" is
sub-optimal to say the least. Per such, both short- and longer-term
commercial traders are advised to pare or neutralize bullish exposure on a
failure below 851.5, acknowledging and accepting whipsaw risk- back above 04-Oct's
891.0 high- in exchange for much deeper and sub-optimal nominal risk below
766.0.
On
a broader scale, the daily log scale chart above shows the developing potential
for a bearish divergence in daily momentum that will be considered confirmed
below 851.5. This chart also shows the past month's recovery thus far
stalling in the immediate neighborhood of the (888.0) Fibonacci
minimum 38.2% retrace of Apr-Sep's entire 1128 - 766 decline). COMBINED
with a failure below 851.5, traders
would then need to be concerned with at least a larger-degree correction pf the
past month's rally and possibly a resumption of Apr-Sep's major downtrend.
Until
and unless the market fails below 851.5 however, we would
remind longer-term players of the key elements on which our bullish count is
predicated:
a confirmed bullish divergence in WEEKLY momentum
(below)
amidst
an
historically low 11% reading in out RJO Bullish Sentiment Index and
a
textbook complete and major 5-wave Elliott sequence down from 29-Apr's
1128 high to 08-Sep's 766.0 low.
Thus
far, the market is only a month into correcting a 4-MONTH, 32% drawdown, so
further and possibly protracted gains remain well within the bounds of a major
(suspected 2nd-Wave) correction of Apr-Sep's decline within an even more
massive PEAK/reversal process from 17-May's 1219 high on an active continuation
basis below.
These
issues considered, a bullish policy and exposure remain advised with a failure
below 851.5 required to defer or threaten this call enough to warrant moving to
a neutral/sideline position. In lieu of such weakness, we anticipate a
continuation of the past month's rally to new highs and potentially significant
gains above 891.0.
By: Michael Sabo, Senior Market StrategistPosted Nov 19, 2021 10:39AM CT
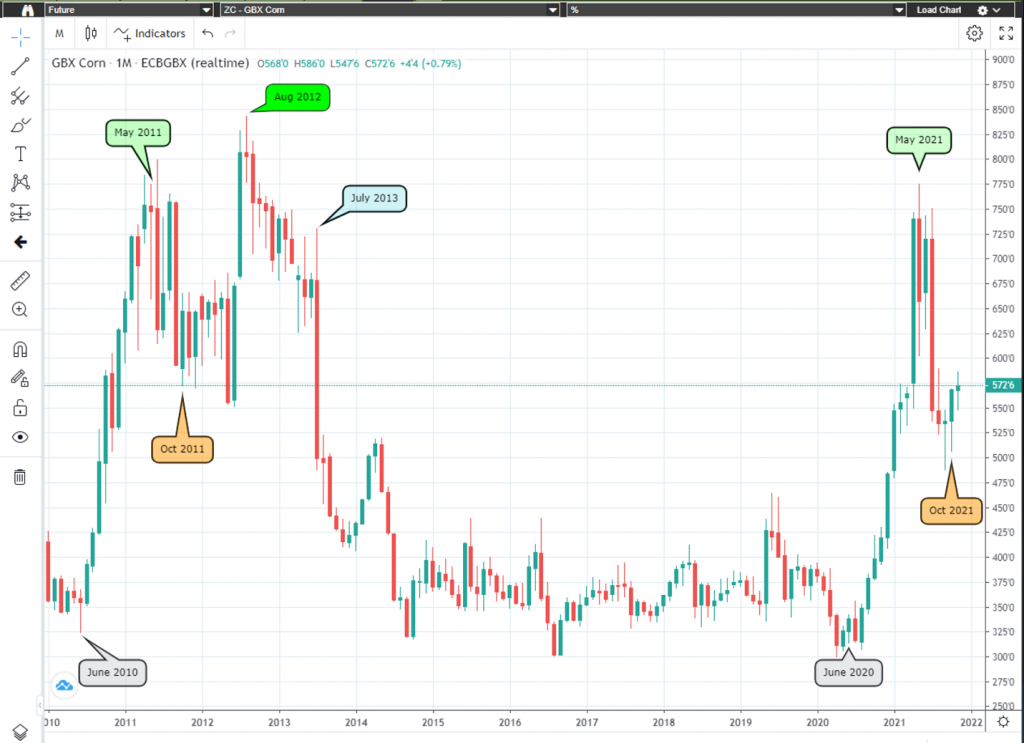
Last week on November 12, I advised traders on the following “Without extremely bearish news outside the expectations, it made sense the market has been moving higher. At the time of this writing corn is forming an inside day, If this continues and actually forms today, watch for a breakout next week. Upside number $5.80 and downside number $5.64 ½.” While we did not form an inside day on Nov 12 because the market finished that session with a high of $5.82, the two trading sessions after both formed inside days. Then on November 17th corn broke to the upside hitting a high of $5.84.
In todays market insight I wanted to give a quick look at the major rally we saw in 2010-2012 and compare it to the current rally that started in 2010. As they say a picture, or chart in this case, is worth a thousand words. See chart below.
The “big picture” numbers remain the same and probably will for some time. I firmly believe a break below $4.96 could give the bears control of the market and a break above $6.39 ½ on the upside may have enough bulls behind it to propel corn to all-time highs. There are several minor areas of support and resistance inside this range that can help with short term market direction if violated. Call me directly at 1-800-367-7290 for more in-depth discussion on these numbers and to discuss trading strategies specific to your situation.
I would suggest using an option strategy to manage your futures position risk or an outright option strategy. Implied option volatility has come down quite a bit from its most recent highs mainly due to the consolidation and tighter trading ranges. I have 25 years of grain market experience, feel free to call or email with any questions you may have. Be sure to check out my archived weekly grain market insight articles posted on our website.
**** Reserve
your FREE 2022 Commodity Trading Guide Today! ****
This 55-page guide is packed with indispensable market information. It has a complete commodity calendar that lists the dates and times of Market Reports, option expiration dates, futures first notice dates, futures last trade dates, etc. It readily serves as your commodity market encyclopedia giving you an in depth look at each commodity, there is market almanac for all actively traded commodities and much more! To reserve your complimentary Commodity Trading Guide, send me an email at msabo@rjofutures.com with the following information: your full name, mailing address and a preferred phone number so we can confirm your request. Once confirmed, I will reserve your trading guide, and have it sent out as soon as we receive them.
Corn Daily Chart If you have any questions or would like to discuss the markets further, please feel free to contact me at 800-367-7290 or msabo@rjofutures.com. Equity - Stock Futures Mixed on New Covid Fears
Stock Futures Mixed on New Covid Fears
By: Jeff Yasak, Senior Market StrategistPosted Nov 19, 2021 9:01AM CT
U.S. Stock futures are mostly lower this morning with the Dow and S&P 500 trending to extend Thursday’s losses. This is mostly due to new Covid-19 fears creating some lockdowns in Europe. Early gains were wiped out after the Austrian government imposed a new 10–20-day lockdown in response to rising cases seen in that country. This will include both vaccinated and unvaccinated. Conversely, Nasdaq futures are trading higher this morning supported by stocks related to the “Stay-at-Home” trade that was very prevalent in 2020. These stocks include Amazon, Zoom, Netflix and Teledoc. There isn’t any relevant economic data being released today but traders will be watching D.C. as the House is expected to Pass Biden’s “Build Back Better Bill”. This bill includes the spending of $1.85 trillion on healthcare, education and climate.
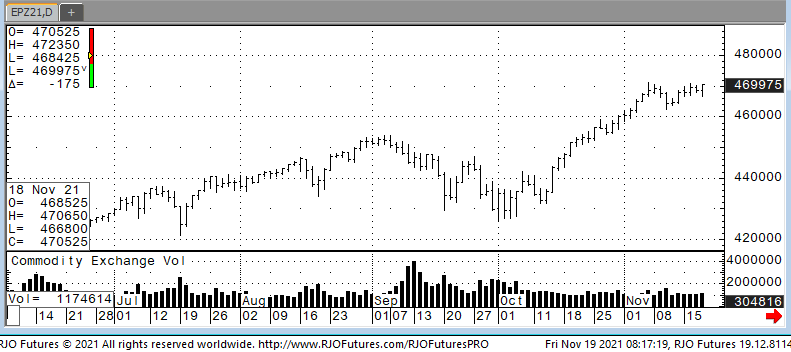
Support today is 4668500 and 465500 with resistance checking in at 472500 and 473200.
E-mini S&P 500 Dec '21 Daily Chart If you have any questions or would like to discuss the markets further, please feel free to contact me at 888-861-1656 or jyasak@rjofutures.com. Economy - S-T Mo Failure Insufficient to End RBOB Correction, But Beware
S-T Mo Failure Insufficient to End RBOB Correction, But Beware
By: RJO Market InsightsPosted 11/08/2022
Posted on Nov 08, 2022, 07:51 by Dave Toth
In Fri's Technical Webcast we identified a
minor corrective low at 2.6328 from Thur as a mini risk parameter the market
needed to sustain gains above to maintain a more immediate bullish count.
The 240-min chart below shows the market's failure overnight below this level,
confirming a bearish divergence in very short-term momentum. This mo
failure defines Fri's 2.8172 high as
one of developing importance and a parameter from which very short-term traders
can objectively base non-bullish decisions like long-covers.
Given
the magnitude of the past three weeks' broader recovery however, this
short-term momentum failure is of an insufficient scale to conclude anything
more than another correction within this broader recovery from 26-Sep's 2.1877
low. Indeed, overnights failure below 2.6328 only allows us to conclude
the end of the portion of the month-and-a-half rally from 31-Oct's 2.4822 next
larger-degree corrective low. 2.4822 is the
risk parameter this market still needs to fail below to break the uptrend from
18-Oct's 2.3526 low while this 2.3526 low
remains intact as the risk parameter this market needs to fail below to break
the month-and-a-half uptrend. From an
intermediate-to-longer-term perspective, this week's setback falls well within
the bounds of another correction ahead of further gains. This is another
excellent example of the importance of technical and trading SCALE and
understanding and matching directional risk exposure to one's personal risk
profile.
The
reason overnight's admittedly minor mo failure might have longer-term
importance is the 2.8172-area from which it stemmed. In
Fri's Technical Blog we also noted the market's engagement of the
2.8076-to-2.8159-area marked by the 61.8% retrace of Jun0-Sewp's 3.2758 -2.1877
decline and the 1.000 progression of Sep-Oct's initial 2.1877 - 2.6185
(suspected a-Wave) rally from 18-Oct's 2.3526 (suspected b-Wave) low. We
remind longer-term players that because of the unique and compelling confluence
of:
early-Aug's bearish divergence in WEEKLY momentum
amidst
historically
extreme bullish sentiment/contrary opinion levels in our RJO Bullish
Sentiment Index
an
arguably complete and massive 5-wave Elliott sequence from Mar'20's 0.4605
low to Jun's 4.3260 high (as labeled in the weekly log active-continuation
chart below) and
the
5-wave impulsive sub-division of Jun-Sep's (suspected initial 1st-Wave) decline
The
recovery attempt from 26-Sep's 2.1877 low is arguably only a 3-wave (Wave-2)
corrective rebuttal to Jun-Sep's decline within a massive, multi-quarter
PEAK/reversal process. Now granted, due to the magnitude of 2020 -2022's
secular bull market, we discussed the prospect for this (2nd-Wave corrective)
recovery to be "extensive" in terms of both price and time. A
"more extensive" correction is typified by a retracement of 61.8% or
more and spanning weeks or even months following a 3-month decline. Per
such, the (suspected corrective) recovery from 26-Sep's 2.1877 low could easily
have further to go, with commensurately larger-degree weakness than that
exhibited this week (i.e., a failure below at least 2.4822) required
to consider the correction complete. Indeed, the daily log chart above
shows the market thus far respecting former 2.6185-area resistance from 10-Oct
as a new support candidate.
These
issues considered, very shorter-term traders have been advised to move to a neutral/sideline
position following overnight's momentum failure below 2.6328, with a recovery
above 2.8172 required to negate this call, reaffirm the recovery and re-expose
potentially significant gains thereafter. For intermediate- and
longer-term players, a bullish policy and exposure remain advised with a
failure below 2.4822 required to threaten this call enough to warrant
neutralizing exposure. We will be watchful for another bearish divergence
in momentum following a recovery attempt that falls short of Fri's 2.8172 high
that would be considered the next reinforcing factor to a count calling that
2.8172 high the prospective end to the month-and-a-half 2nd-Wave
correction. In lieu of such, a resumption of the current rally to
eventual new highs above 2.8172 should not surprise.
By: John Caruso, Senior Market StrategistPosted Nov 19, 2021 8:32AM CT
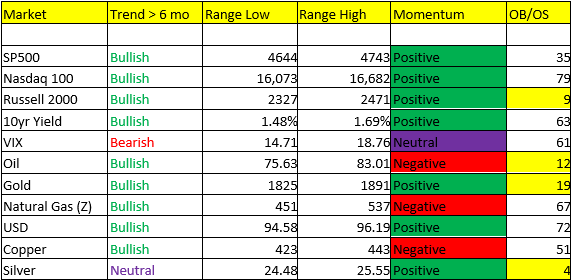
Bond shorts are getting “hugged” this morning. We’ve mentioned the massive short position in the bond market as of the latest CFTC position report (nearly 100% of CTAs are short according to some sources). So you get a net consensus position and BAM! Bond yields are back down 10 bps from the recent high of 1.64%. This won’t last, but it could carry on for a few more sessions – remember, it’s widely recognized that being long on US treasuries is one of the worst places you could be invested. When adjusted for inflation, real rates on the 10yr are NEGATIVE. We’ve been busy covering the bulk of our short position over the past week, but still leaving a core short (which we’ll be grossing up from the low end of the 10yr yield range of 1.48%).
Stocks: the NASDAQ 100 Index closed at another ATH on the year yesterday (16,508) and is etching out new ATHs once again this morning. The small cap Russell 2000 isn’t fairing as well this morning (-1.42%), which is likely due to the slide in bond yields and energy (remember 26% of the RTY consists of Financial stocks). I’m not concerned with this slide, because we’ll likely see that rotation BACK into small caps over the next 1 or 2 weeks. We’ve signaled 4 times to buy the Indices this year, and have hit on all 4. We’ll wait on watch a little before we look at perhaps grossing up the small caps.
Oil- Another deep dive overnight. I’m hearing certain parts of Europe are locking down again, as well as Australia. I haven’t heard anything further on SPR releases from the US and China, besides, in the past those have been buying opportunities. Those reserves eventually need to be refilled. Oil is immediate OS right here right now, low end of the range, and BULLISH TREND remains intact.
Bitcoin- I’ve been thinking about re-adding the bitcoin range back into our table below. BTC remains BULLISH TREND, Neutral Momentum, and immediately OS right here right now. I’ve been lightly buying over the past few days in BTC and ETH.
Lastly, every and any negative headline on Covid-19 has been a buying opportunity for the past 1.5yr. I don’t suspect this time is any different.
If you have any questions or would like to discuss the markets further, please feel free to contact me at 800-669-5354 or jcaruso@rjofutures.com.