Looking to diversify your investment portfolio with futures trading, but lack the expertise on your own? Trading Systems and their programs are now listed on our website complete with track records, products traded and minimum account requirements and fees. If you need help navigating the site and viewing the results, give us a call.
New: Micro Bitcoin Investor Kit
Bitcoin is on an unprecedented run and is at the forefront of the trend in cryptocurrency and as a response, the CME has released a micro Bitcoin futures contract that is 1/10th the size of a regular Bitcoin futures contract. Learn everything you need to trade the micro Bitcoin futures contract with this Investor Kit!
The Markets
Metals - Gold Down Hard on Dollar Strength
Gold Down Hard on Dollar Strength
By: Frank J. Cholly, Senior Market StrategistPosted Nov 24, 2021 9:33AM CT
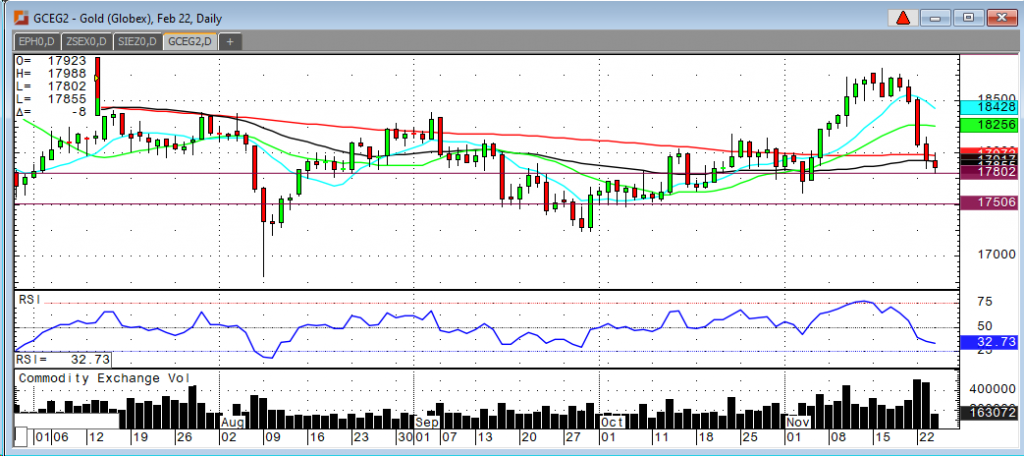
A huge reversal in gold this week as the US Dollar Index
hits new contract highs. Once gold broke below $1,850, technical selling took
over as sell stops were triggered. Gold and outside markets are reacting to the
renomination of Fed Chairman Jerome Powell. The believe is that Chairman Powell
will be more “hawkish” than what a new Fed Chairman would be.
Gold has quickly become over sold and while I’m unsure if the market will have an equally sharp rebound, I do see a good opportunity to get long again in the $1,785 to $1,780 range. Dollar strength is gold’s biggest obstacle right now. I do believe that gold will adjust to rising rates and Dollar strength in a positive way. There’s a level on the chart where the slide lower will reverse. Traders should not have been so invested in the prospect of a new and more dovish Fed Chair. Better the devil that you know.
Gold Feb '22 Daily Chart If you have any questions or would like to discuss the markets further, please feel free to contact me at 800-826-4124 or fcholly@rjofutures.com. Energy - Oil Higher Despite Strategic Reserve Release
Oil Higher Despite Strategic Reserve Release
By: Alex Turro, Senior Market StrategistPosted Nov 24, 2021 9:40AM CT
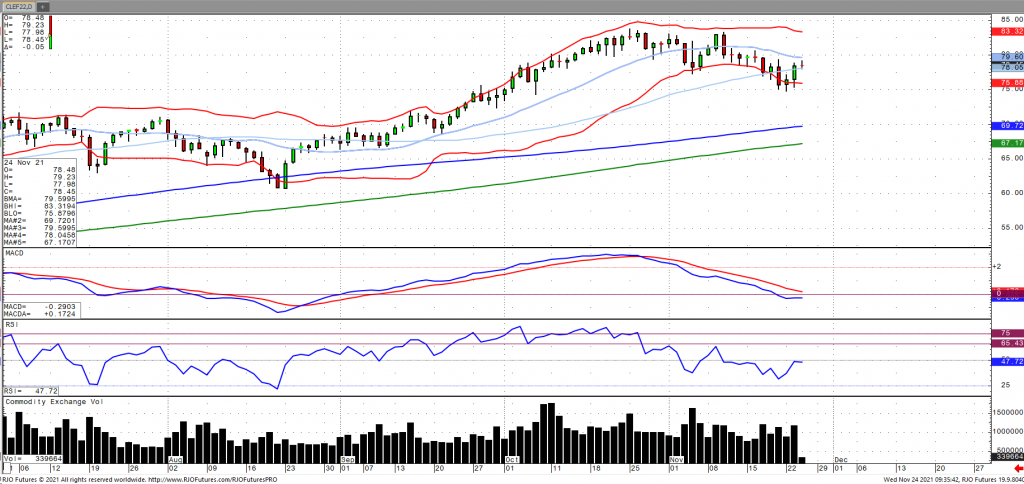
Oil prices fell to around $75 a barrel earlier in the week before moving back into positive territory following reports that the US will lead a global coordinated effort to release their strategic petroleum reserves (SPR). The US is set to release 50 million barrels with 32 million released in the next few months and 18 million of a previous sale. Other countries who have committed include China, India, Japan, South Korea as well as the United Kingdom. The UK has agreed to release 1.5 million barrels with India committing to 5 million barrels with the remaining countries unspecified. This effectively equates to one day’s worth of global oil consumption, which is not going to able to offset this structural deficit. OPEC+ is scheduled to meet next month as they are set to release an additional 400k barrels per day. Oil volatility (OVX) has come off the top end of the range as the market remains bullish trend with today’s range seen between 75.03 – 83.34.
Crude Oil Jan '22 Daily Chart If you have any questions or would like to discuss the markets further, please feel free to contact me at 800-438-4805 or aturro@rjofutures.com. Agricultural - Bullish Canola Count Intact Above Minimum 851.5
Bullish Canola Count Intact Above Minimum 851.5
By: RJO Market InsightsPosted 10/14/2022
Posted on Oct 14, 2022, 07:42 by Dave Toth
On
the heels of mid-Sep-to-early-Oct's steeper, accelerated, 3rd-wave-looking
recovery, the past week-and-a-half's boringly lateral chop is first considered
a corrective/consolidative event that warns of a continuation of the uptrend
that preceded it to new highs above 04-Oct's 891.0 high. This count
remains consistent with our broader base/correction/recovery count introduced
in 13-Sep's Technical Blog following that
day's bullish divergence in short-term momentum above 07-Sep's 809.5 minor
corrective high detailed in the hourly chart below.
The
important takeaway from this month's lateral, sleepy price action is the
definition of Wed's 851.5 low as
the end or lower boundary of a suspected 4th-Wave correction. A failure
below 851.5 will confirm a bearish divergence in daily momentum and defer or
threaten a bullish count enough to warrant non-bullish decisions like
long-covers. A failure below 851.5 will not
necessarily negate a broader bullish count, but it will threaten it enough to
warrant defensive measures as the next pertinent technical levels below 851.5 are
13-Sep's prospective minor 1st-Wave high at 813.8 and obviously 08-Sep's 766.0
low. And making non-bullish decisions "down there" is
sub-optimal to say the least. Per such, both short- and longer-term
commercial traders are advised to pare or neutralize bullish exposure on a
failure below 851.5, acknowledging and accepting whipsaw risk- back above 04-Oct's
891.0 high- in exchange for much deeper and sub-optimal nominal risk below
766.0.
On
a broader scale, the daily log scale chart above shows the developing potential
for a bearish divergence in daily momentum that will be considered confirmed
below 851.5. This chart also shows the past month's recovery thus far
stalling in the immediate neighborhood of the (888.0) Fibonacci
minimum 38.2% retrace of Apr-Sep's entire 1128 - 766 decline). COMBINED
with a failure below 851.5, traders
would then need to be concerned with at least a larger-degree correction pf the
past month's rally and possibly a resumption of Apr-Sep's major downtrend.
Until
and unless the market fails below 851.5 however, we would
remind longer-term players of the key elements on which our bullish count is
predicated:
a confirmed bullish divergence in WEEKLY momentum
(below)
amidst
an
historically low 11% reading in out RJO Bullish Sentiment Index and
a
textbook complete and major 5-wave Elliott sequence down from 29-Apr's
1128 high to 08-Sep's 766.0 low.
Thus
far, the market is only a month into correcting a 4-MONTH, 32% drawdown, so
further and possibly protracted gains remain well within the bounds of a major
(suspected 2nd-Wave) correction of Apr-Sep's decline within an even more
massive PEAK/reversal process from 17-May's 1219 high on an active continuation
basis below.
These
issues considered, a bullish policy and exposure remain advised with a failure
below 851.5 required to defer or threaten this call enough to warrant moving to
a neutral/sideline position. In lieu of such weakness, we anticipate a
continuation of the past month's rally to new highs and potentially significant
gains above 891.0.
Agricultural - Grains - Highest Close for December Corn Since July 1!
Grains - Highest Close for December Corn Since July 1!
By: Michael Sabo, Senior Market StrategistPosted Nov 24, 2021 10:10AM CT
Over the last two weeks December corn has been consolidating just under what I believe to be a major trendline (see red trendline on chart below). Yesterday December corn hit a daily high of $5.81 and closed at $5.80 ½, which is the highest daily close that contract has seen since July 1st, 2021. Two weeks ago, I advised traders on the following “Without extremely bearish news outside the expectations, it made sense the market has been moving higher. At the time of this writing corn is forming an inside day, If this continues and actually forms today, watch for a breakout next week. Upside number $5.80 and downside number $5.64 ½.” Then on November 19th I advised traders “While we did not form an inside day on Nov 12 because the market finished that session with a high of $5.82, the two trading sessions after both formed inside days. Then on November 17th corn broke to the upside hitting a high of $5.84.” The last three sessions, including today, we have seen higher highs and higher lows with December corn hitting a daily high so far today of $5.89. The market appears poised to continue higher, but not without some selling pressure from time to time. For now I remain bullish especially with a break above the trendline I mentioned earlier. A close above $5.84 today would bode well for the bulls in my opinion to keep prices moving into Friday. Keep in mind this Friday is December grain option expiration so we could see increased volatility on both sides.
The “big picture” numbers remain the same and probably will for some time. I firmly believe a break below $4.96 could give the bears control of the market and a break above $6.39 ½ on the upside may have enough bulls behind it to propel corn to all-time highs. There are several minor areas of support and resistance inside this range that can help with short term market direction if violated. Call me directly at 1-800-367-7290 for more in-depth discussion on these numbers and to discuss trading strategies specific to your situation.
I would suggest using an option strategy to manage your futures position risk or an outright option strategy. Implied option volatility has come down quite a bit from its most recent highs mainly due to the consolidation and tighter trading ranges. I have 25 years of grain market experience, feel free to call or email with any questions you may have. Be sure to check out my archived weekly grain market insight articles posted on our website.
**** Reserve
your FREE 2022 Commodity Trading Guide Today! ****
This 55-page guide is packed with indispensable market information. It has a complete commodity calendar that lists the dates and times of Market Reports, option expiration dates, futures first notice dates, futures last trade dates, etc. It readily serves as your commodity market encyclopedia giving you an in depth look at each commodity, there is market almanac for all actively traded commodities and much more! To reserve your complimentary Commodity Trading Guide, send me an email at msabo@rjofutures.com with the following information: your full name, mailing address and a preferred phone number so we can confirm your request. Once confirmed, I will reserve your trading guide, and have it sent out as soon as we receive them.
Corn Dec '21 Daily Chart If you have any questions or would like to discuss the markets further, please feel free to contact me at 800-367-7290 or msabo@rjofutures.com. Interest Rates - Interest Rates Down on News of Powell Nomination
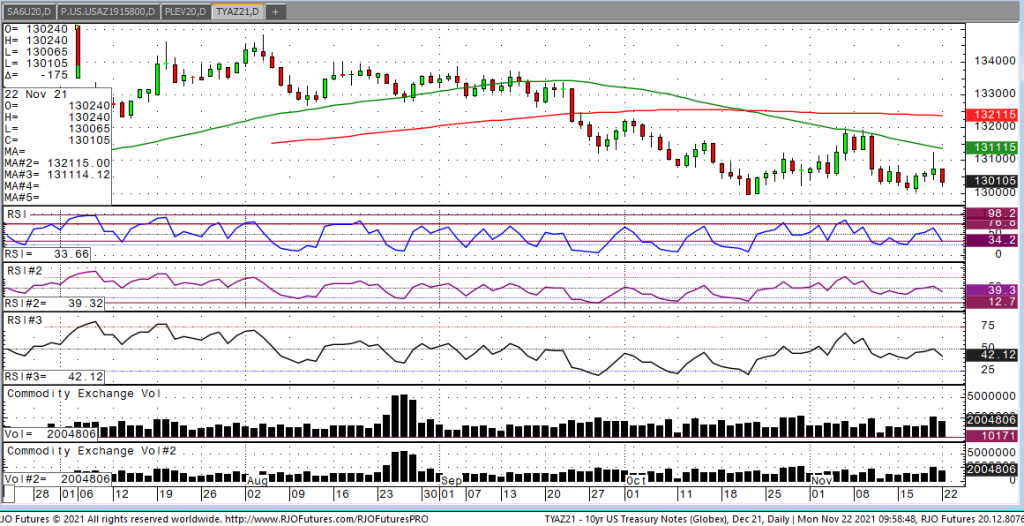
Looking at the December 10-year note, we have a high of
130-24 that came early last night and a low of 130-065 and currently trading
130-10. Some big news came out this morning as President Biden intends to
nominate Jerome Powell for a second term as Fed chair. The stock market rallied
on the news and the note fell. As dovish as Powell has been, the market
believes he is less dovish as Fed Brainard so that’s why were seeing price down
and yields up. The note market rallied late last week on continued talk that China
and Japan were going to release oil reserves in hopes of increasing supply to
the market as OPEC does not seem willing to increase production. Soon after the
rumor about China and Japan, WTI fell around $3 as most traders don’t believe
that the release will do much in the long run and as a result the price of
crude has stabilized and is currently up 77-cents at 76.70.
Looking at technicals, we are still in a bear and the inability for the December 10-year to hold gains over the key 131-00 puts the low ff the move at 129-31, which is a double bottom that we saw on October 21 in focus. A close below that key level brings 128-28-31 in play.
10-Year Note Dec '21 Daily Chart If you have any questions or would like to discuss the markets further, please feel free to contact me at 800-826-2270 or gperlin@rjofutures.com. Equity - Stocks Continue to Slide
Stocks Continue to Slide
By: Bill Dixon, Senior Market StrategistPosted Nov 24, 2021 9:51AM CT
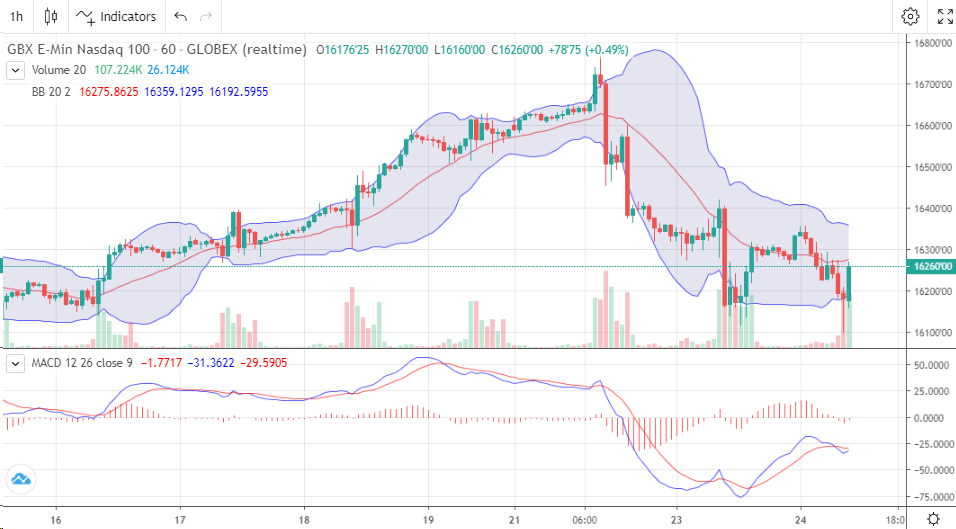
All four indices are lower to kick off the week’s last full day of trading. While the Russell and Nasdaq managed to make new lows for the move, the Dow and S&P have failed to do so. Tech has led the way down as bond yields are on the rise once again. Lockdowns are back in some corners of the world due to surges in coronavirus cases. Inflation also seems to be a bit stickier than some would have guessed. Factor in that Powell is still driving the bus at the Fed (Brainard would have likely been more dovish), and you’ve got some ingredients for a selloff. With all that in mind, we’re dipping into oversold territory in the Russell. The Dec VIX is trading above 21, and while that doesn’t mean it can’t go higher, it has struggled to tread water at these levels for any meaningful amount of time.
Trading hours are cut short tomorrow and Friday for Thanksgiving. We’ve got a few important data releases next week including PMI on Tuesday and the jobs data on Friday. Happy Thanksgiving to you and yours.
S&P 500 60-Min Chart If you have any questions or would like to discuss the markets further, please feel free to contact me at 800-669-5354 or bdixon@rjofutures.com. Economy - S-T Mo Failure Insufficient to End RBOB Correction, But Beware
S-T Mo Failure Insufficient to End RBOB Correction, But Beware
By: RJO Market InsightsPosted 11/08/2022
Posted on Nov 08, 2022, 07:51 by Dave Toth
In Fri's Technical Webcast we identified a
minor corrective low at 2.6328 from Thur as a mini risk parameter the market
needed to sustain gains above to maintain a more immediate bullish count.
The 240-min chart below shows the market's failure overnight below this level,
confirming a bearish divergence in very short-term momentum. This mo
failure defines Fri's 2.8172 high as
one of developing importance and a parameter from which very short-term traders
can objectively base non-bullish decisions like long-covers.
Given
the magnitude of the past three weeks' broader recovery however, this
short-term momentum failure is of an insufficient scale to conclude anything
more than another correction within this broader recovery from 26-Sep's 2.1877
low. Indeed, overnights failure below 2.6328 only allows us to conclude
the end of the portion of the month-and-a-half rally from 31-Oct's 2.4822 next
larger-degree corrective low. 2.4822 is the
risk parameter this market still needs to fail below to break the uptrend from
18-Oct's 2.3526 low while this 2.3526 low
remains intact as the risk parameter this market needs to fail below to break
the month-and-a-half uptrend. From an
intermediate-to-longer-term perspective, this week's setback falls well within
the bounds of another correction ahead of further gains. This is another
excellent example of the importance of technical and trading SCALE and
understanding and matching directional risk exposure to one's personal risk
profile.
The
reason overnight's admittedly minor mo failure might have longer-term
importance is the 2.8172-area from which it stemmed. In
Fri's Technical Blog we also noted the market's engagement of the
2.8076-to-2.8159-area marked by the 61.8% retrace of Jun0-Sewp's 3.2758 -2.1877
decline and the 1.000 progression of Sep-Oct's initial 2.1877 - 2.6185
(suspected a-Wave) rally from 18-Oct's 2.3526 (suspected b-Wave) low. We
remind longer-term players that because of the unique and compelling confluence
of:
early-Aug's bearish divergence in WEEKLY momentum
amidst
historically
extreme bullish sentiment/contrary opinion levels in our RJO Bullish
Sentiment Index
an
arguably complete and massive 5-wave Elliott sequence from Mar'20's 0.4605
low to Jun's 4.3260 high (as labeled in the weekly log active-continuation
chart below) and
the
5-wave impulsive sub-division of Jun-Sep's (suspected initial 1st-Wave) decline
The
recovery attempt from 26-Sep's 2.1877 low is arguably only a 3-wave (Wave-2)
corrective rebuttal to Jun-Sep's decline within a massive, multi-quarter
PEAK/reversal process. Now granted, due to the magnitude of 2020 -2022's
secular bull market, we discussed the prospect for this (2nd-Wave corrective)
recovery to be "extensive" in terms of both price and time. A
"more extensive" correction is typified by a retracement of 61.8% or
more and spanning weeks or even months following a 3-month decline. Per
such, the (suspected corrective) recovery from 26-Sep's 2.1877 low could easily
have further to go, with commensurately larger-degree weakness than that
exhibited this week (i.e., a failure below at least 2.4822) required
to consider the correction complete. Indeed, the daily log chart above
shows the market thus far respecting former 2.6185-area resistance from 10-Oct
as a new support candidate.
These
issues considered, very shorter-term traders have been advised to move to a neutral/sideline
position following overnight's momentum failure below 2.6328, with a recovery
above 2.8172 required to negate this call, reaffirm the recovery and re-expose
potentially significant gains thereafter. For intermediate- and
longer-term players, a bullish policy and exposure remain advised with a
failure below 2.4822 required to threaten this call enough to warrant
neutralizing exposure. We will be watchful for another bearish divergence
in momentum following a recovery attempt that falls short of Fri's 2.8172 high
that would be considered the next reinforcing factor to a count calling that
2.8172 high the prospective end to the month-and-a-half 2nd-Wave
correction. In lieu of such, a resumption of the current rally to
eventual new highs above 2.8172 should not surprise.