Looking to diversify your investment portfolio with futures trading, but lack the expertise on your own? Trading Systems and their programs are now listed on our website complete with track records, products traded and minimum account requirements and fees. If you need help navigating the site and viewing the results, give us a call.
New: Micro Bitcoin Investor Kit
Bitcoin is on an unprecedented run and is at the forefront of the trend in cryptocurrency and as a response, the CME has released a micro Bitcoin futures contract that is 1/10th the size of a regular Bitcoin futures contract. Learn everything you need to trade the micro Bitcoin futures contract with this Investor Kit!
The Markets
Metals - Fed Revives Gold
Fed Revives Gold
By: Frank J. Cholly, Senior Market StrategistPosted Dec 17, 2021 8:44AM CT
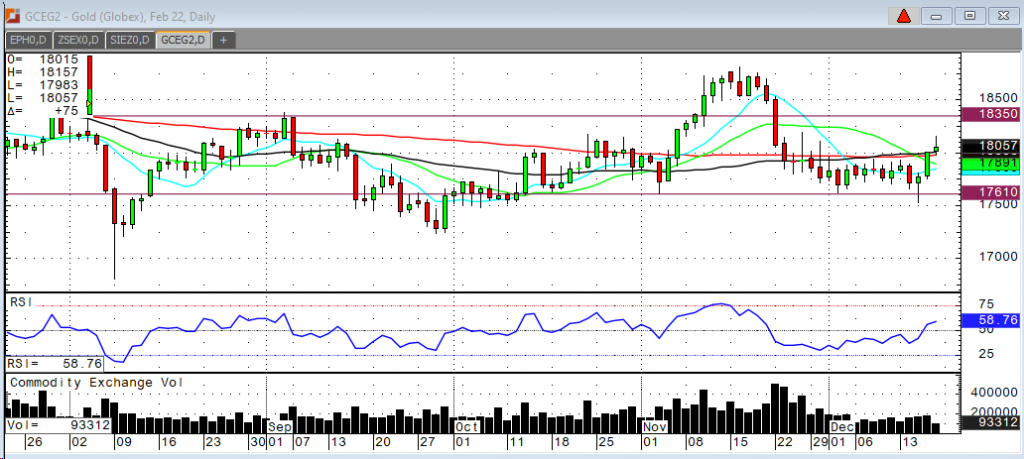
Since the Fed announcement on Wednesday, the gold market has added $62.00 of premium. A close today above $1,800 would confirm a short-term bottom and reversal. The next big test for this rally will be in the range of $1.832 to $1,835. I have said before that this next rally would likely have an easier time moving back towards the November swing high of $1,882. But let’s not get too far ahead of ourselves just yet. I like gold and do expect that there will eventually be a challenge of the $2,000 level, however, I’m reluctant to get too excited about gold doing what it should have been doing all along. We have been faked out and disappointed too many times already. Considering all the cash, the money printing stimulus and emergency type measures taken by the government, gold should be much higher. That’s just my opinion! Gold will attract more buying as the trend up becomes more pronounced. When it comes to gold, the higher it goes, the more people want it.
Gold Feb '22 Daily Chart If you have any questions or would like to discuss the markets further, please feel free to contact me at 800-826-4124 or fcholly@rjofutures.com. Metals - Silver Showing Signs of Life
Silver Showing Signs of Life
By: Eli Tesfaye, Senior Market StrategistPosted Dec 17, 2021 8:37AM CT
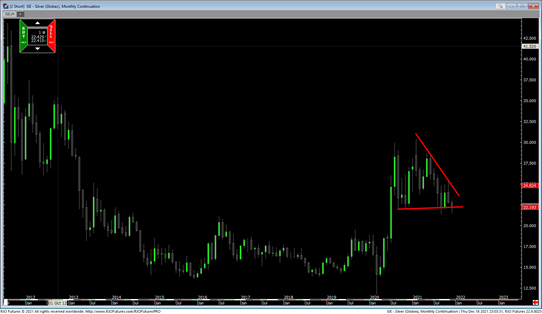
The monthly silver chart was showing signs of life even before the Fed's minutes. Inflation is front and center. The pace of the Fed rate hike might be just slow enough to give silver traders some ammunition to expect higher price action. As I stated in previously, once the Covid-19 variants takes a back seat, silver will shine once more. Also, I have said before, one thing to remember is that rejection of the downside from these price levels (which is playing out in this week's sessions) will result in a strong rally. Seasonal support should come in to support silver right now. The $21.00 level continues to be supported. A break above the $23.50 range would likely extend really near $25.00. The long-term chart shows that you need above $23.50 to reject bearish price action entirely. Please give me a call to discuss strategies from these levels.
Silver Monthly Chart If you have any questions or would like to discuss the markets further, please feel free to contact me at 800-367-7290 or etesfaye@rjofutures.com. Energy - Oil Poised for Weekly Loss
Oil Poised for Weekly Loss
By: Alex Turro, Senior Market StrategistPosted Dec 17, 2021 9:29AM CT
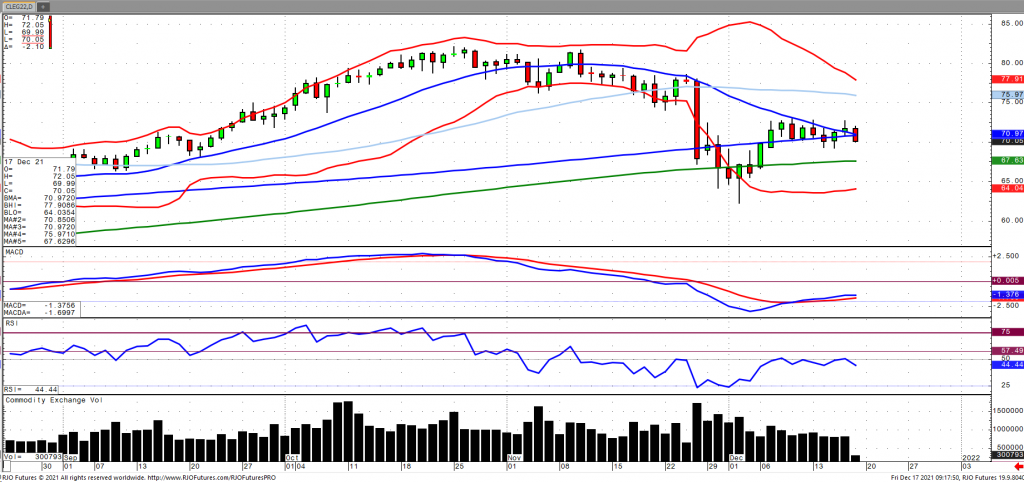
Oil prices are falling early in the session after rebounding yesterday and are poised for a weekly loss as uncertainty surrounding the omicron variant continue to dampen sentiment and raise concerns over fuel demand. OPEC+ has stated that it my convene before their Jan 4th meeting if the demand outlook warrants a change in their plans to add 400k per day in January while simultaneously noting an expected increase in demand for the first quarter of 2022. In contrast, the International Energy Agency (IEA) came out on Tuesday noting that oil output is set to out outpace demand, specifically domestically, at least through the end of next year. Crude stocks fell -4.584 million barrels with stocks now down -71.810 million barrels below last year and -33.779 million barrels below the five-year average, according to the EIA. Oil volatility (OVX) continues to remain elevated in the mid-upper 40s with the market transitioning to bearish trend with today’s range seen between 65.33 – 73.26.
Crude Oil Feb '22 Daily Chart If you have any questions or would like to discuss the markets further, please feel free to contact me at 800-438-4805 or aturro@rjofutures.com. Softs - Will Cocoa Futures End the Year at $2600?
Will Cocoa Futures End the Year at $2600?
By: Peter MoosesPosted 12/17/2021
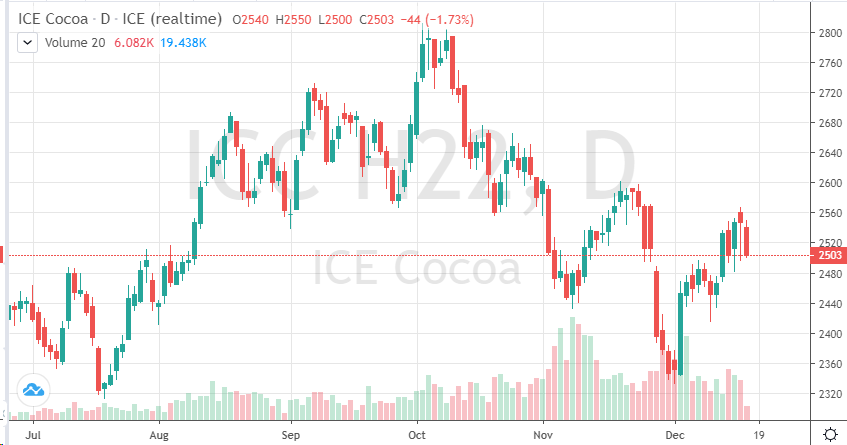
Cocoa
futures have been trading around 2500. After the lows we saw earlier this
month, cocoa futures have been able to rally slightly despite renewed fears of
Covid lockdowns. As the Omicron variant spreads and the medical world tries to
figure out next steps – commodities have been volatile.
On
the cocoa side of the equation, supply issues could be what this market needs
to get and trade above 2600 in the March contract. Many areas of the cocoa
world are coming in with lower production estimates. Weather premium could also
still boost prices as well. If demand can increase in the coming weeks and
months, these factors could be just enough to carry the cocoa bulls higher. COT
data will give us an idea where trader’s heads are at as we approach year end.
For now, traders should take a cautious approach as the Fed announcement earlier this week gave us an idea of what the next two years could look like. The ECB changing its course of action has also affected the markets and potentially the longer-term moves in their system.
On
the heels of mid-Sep-to-early-Oct's steeper, accelerated, 3rd-wave-looking
recovery, the past week-and-a-half's boringly lateral chop is first considered
a corrective/consolidative event that warns of a continuation of the uptrend
that preceded it to new highs above 04-Oct's 891.0 high. This count
remains consistent with our broader base/correction/recovery count introduced
in 13-Sep's Technical Blog following that
day's bullish divergence in short-term momentum above 07-Sep's 809.5 minor
corrective high detailed in the hourly chart below.
The
important takeaway from this month's lateral, sleepy price action is the
definition of Wed's 851.5 low as
the end or lower boundary of a suspected 4th-Wave correction. A failure
below 851.5 will confirm a bearish divergence in daily momentum and defer or
threaten a bullish count enough to warrant non-bullish decisions like
long-covers. A failure below 851.5 will not
necessarily negate a broader bullish count, but it will threaten it enough to
warrant defensive measures as the next pertinent technical levels below 851.5 are
13-Sep's prospective minor 1st-Wave high at 813.8 and obviously 08-Sep's 766.0
low. And making non-bullish decisions "down there" is
sub-optimal to say the least. Per such, both short- and longer-term
commercial traders are advised to pare or neutralize bullish exposure on a
failure below 851.5, acknowledging and accepting whipsaw risk- back above 04-Oct's
891.0 high- in exchange for much deeper and sub-optimal nominal risk below
766.0.
On
a broader scale, the daily log scale chart above shows the developing potential
for a bearish divergence in daily momentum that will be considered confirmed
below 851.5. This chart also shows the past month's recovery thus far
stalling in the immediate neighborhood of the (888.0) Fibonacci
minimum 38.2% retrace of Apr-Sep's entire 1128 - 766 decline). COMBINED
with a failure below 851.5, traders
would then need to be concerned with at least a larger-degree correction pf the
past month's rally and possibly a resumption of Apr-Sep's major downtrend.
Until
and unless the market fails below 851.5 however, we would
remind longer-term players of the key elements on which our bullish count is
predicated:
a confirmed bullish divergence in WEEKLY momentum
(below)
amidst
an
historically low 11% reading in out RJO Bullish Sentiment Index and
a
textbook complete and major 5-wave Elliott sequence down from 29-Apr's
1128 high to 08-Sep's 766.0 low.
Thus
far, the market is only a month into correcting a 4-MONTH, 32% drawdown, so
further and possibly protracted gains remain well within the bounds of a major
(suspected 2nd-Wave) correction of Apr-Sep's decline within an even more
massive PEAK/reversal process from 17-May's 1219 high on an active continuation
basis below.
These
issues considered, a bullish policy and exposure remain advised with a failure
below 851.5 required to defer or threaten this call enough to warrant moving to
a neutral/sideline position. In lieu of such weakness, we anticipate a
continuation of the past month's rally to new highs and potentially significant
gains above 891.0.
Agricultural - Grains - Consolidation on Corn Weekly Chart
Grains - Consolidation on Corn Weekly Chart
By: Michael Sabo, Senior Market StrategistPosted Dec 17, 2021 11:26AM CT
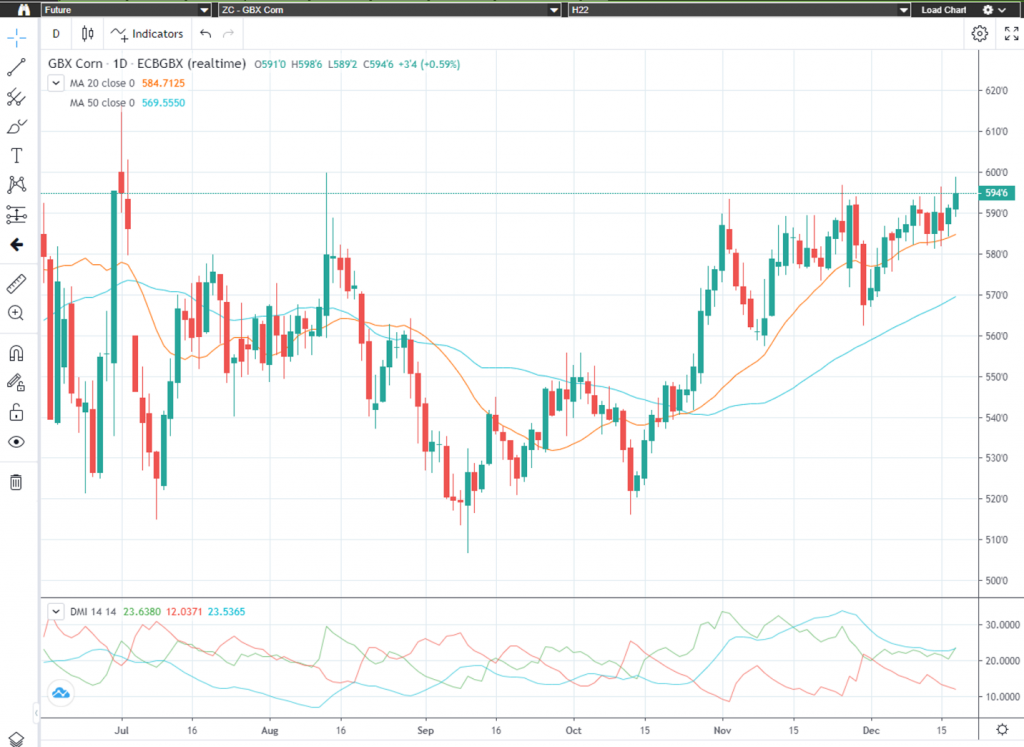
Last week I advised traders “At the time of this writing March corn is trading at $5.91, a solid move higher since last Friday. At 11am today the USDA will release the Supply/Demand and Crop Production Report, this could be a market mover. I would recommend traders watch for a breakout above $6.01 ¼ or break below $5.55 ¾ (see red lines below) to gauge short term market direction.” March corn continues to push higher and at the time of this writing it has hit a daily high of $5.98 3/4. Traders should watch for the breakout above $6.01 ½ . Yesterday, March corn had an inside day which appears to have been a nice setup since the market is breaking higher today. Watch for the major breakout above $6.01 ½ .
The “big picture” numbers remain the same and probably will for some time. I firmly believe a break below $4.96 could give the bears control of the market and a break above $6.39 ½ on the upside may have enough bulls behind it to propel corn to all-time highs. There are several minor areas of support and resistance inside this range that can help with short term market direction if violated. Call me directly at 1-800-367-7290 for more in-depth discussion on these numbers and to discuss trading strategies specific to your situation.
I would suggest using an option strategy to manage your futures position risk or an outright option strategy. Implied option volatility has come down quite a bit from its most recent highs mainly due to the consolidation and tighter trading ranges. I have 25 years of grain market experience, feel free to call or email with any questions you may have. Be sure to check out my archived weekly grain market insight articles posted on our website.
**** Reserve
your FREE 2022 Commodity Trading Guide Today! ****
This 55-page guide is packed with indispensable market information. It has a complete commodity calendar that lists the dates and times of Market Reports, option expiration dates, futures first notice dates, futures last trade dates, etc. It readily serves as your commodity market encyclopedia giving you an in depth look at each commodity, there is market almanac for all actively traded commodities and much more! To reserve your complimentary Commodity Trading Guide, send me an email at msabo@rjofutures.com with the following information: your full name, mailing address and a preferred phone number so we can confirm your request. Once confirmed, I will reserve your trading guide, and have it sent out as soon as we receive them.
Corn Weekly Chart If you have any questions or would like to discuss the markets further, please feel free to contact me at 800-367-7290 or msabo@rjofutures.com. Equity - Stocks Down on Tech Sell-Off
Stocks Down on Tech Sell-Off
By: Jeff Yasak, Senior Market StrategistPosted Dec 17, 2021 9:05AM CT
Stock futures are
trading lower this morning after Thursday’s sell-off in tech sector as traders
look past growth stocks in anticipation of a tighter monetary policy next year.
Higher rates and the central bank speeding up of their asset purchase tapering
has weighed heavily on the value of technology and growth stocks. Through
Thursday’s close the Nasdaq composite has fallen 5% in the last month. The Fed
is not the only one responding to faster inflation, Thursday also saw rate
hikes from Mexico, the U.K. and Norway with the European Central Bank pledging
to reduce the rate of bond purchases in the upcoming year. Europe’s largest fund manager at Amundi
stated. “We see a risk of a bearish steepening of the yield curve. This
reinforces our negative view on duration and is generally positive for value
equites relative to growth equities.”
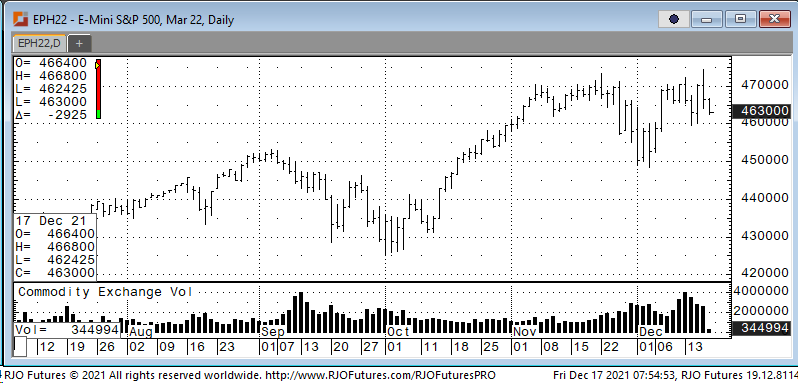
Support is checking in at 461000 and 457400 with resistance showing 471100 and 477800.
E-mini S&P 500 Mar '22 Daily Chart If you have any questions or would like to discuss the markets further, please feel free to contact me at 888-861-1656 or jyasak@rjofutures.com. Economy - S-T Mo Failure Insufficient to End RBOB Correction, But Beware
S-T Mo Failure Insufficient to End RBOB Correction, But Beware
By: RJO Market InsightsPosted 11/08/2022
Posted on Nov 08, 2022, 07:51 by Dave Toth
In Fri's Technical Webcast we identified a
minor corrective low at 2.6328 from Thur as a mini risk parameter the market
needed to sustain gains above to maintain a more immediate bullish count.
The 240-min chart below shows the market's failure overnight below this level,
confirming a bearish divergence in very short-term momentum. This mo
failure defines Fri's 2.8172 high as
one of developing importance and a parameter from which very short-term traders
can objectively base non-bullish decisions like long-covers.
Given
the magnitude of the past three weeks' broader recovery however, this
short-term momentum failure is of an insufficient scale to conclude anything
more than another correction within this broader recovery from 26-Sep's 2.1877
low. Indeed, overnights failure below 2.6328 only allows us to conclude
the end of the portion of the month-and-a-half rally from 31-Oct's 2.4822 next
larger-degree corrective low. 2.4822 is the
risk parameter this market still needs to fail below to break the uptrend from
18-Oct's 2.3526 low while this 2.3526 low
remains intact as the risk parameter this market needs to fail below to break
the month-and-a-half uptrend. From an
intermediate-to-longer-term perspective, this week's setback falls well within
the bounds of another correction ahead of further gains. This is another
excellent example of the importance of technical and trading SCALE and
understanding and matching directional risk exposure to one's personal risk
profile.
The
reason overnight's admittedly minor mo failure might have longer-term
importance is the 2.8172-area from which it stemmed. In
Fri's Technical Blog we also noted the market's engagement of the
2.8076-to-2.8159-area marked by the 61.8% retrace of Jun0-Sewp's 3.2758 -2.1877
decline and the 1.000 progression of Sep-Oct's initial 2.1877 - 2.6185
(suspected a-Wave) rally from 18-Oct's 2.3526 (suspected b-Wave) low. We
remind longer-term players that because of the unique and compelling confluence
of:
early-Aug's bearish divergence in WEEKLY momentum
amidst
historically
extreme bullish sentiment/contrary opinion levels in our RJO Bullish
Sentiment Index
an
arguably complete and massive 5-wave Elliott sequence from Mar'20's 0.4605
low to Jun's 4.3260 high (as labeled in the weekly log active-continuation
chart below) and
the
5-wave impulsive sub-division of Jun-Sep's (suspected initial 1st-Wave) decline
The
recovery attempt from 26-Sep's 2.1877 low is arguably only a 3-wave (Wave-2)
corrective rebuttal to Jun-Sep's decline within a massive, multi-quarter
PEAK/reversal process. Now granted, due to the magnitude of 2020 -2022's
secular bull market, we discussed the prospect for this (2nd-Wave corrective)
recovery to be "extensive" in terms of both price and time. A
"more extensive" correction is typified by a retracement of 61.8% or
more and spanning weeks or even months following a 3-month decline. Per
such, the (suspected corrective) recovery from 26-Sep's 2.1877 low could easily
have further to go, with commensurately larger-degree weakness than that
exhibited this week (i.e., a failure below at least 2.4822) required
to consider the correction complete. Indeed, the daily log chart above
shows the market thus far respecting former 2.6185-area resistance from 10-Oct
as a new support candidate.
These
issues considered, very shorter-term traders have been advised to move to a neutral/sideline
position following overnight's momentum failure below 2.6328, with a recovery
above 2.8172 required to negate this call, reaffirm the recovery and re-expose
potentially significant gains thereafter. For intermediate- and
longer-term players, a bullish policy and exposure remain advised with a
failure below 2.4822 required to threaten this call enough to warrant
neutralizing exposure. We will be watchful for another bearish divergence
in momentum following a recovery attempt that falls short of Fri's 2.8172 high
that would be considered the next reinforcing factor to a count calling that
2.8172 high the prospective end to the month-and-a-half 2nd-Wave
correction. In lieu of such, a resumption of the current rally to
eventual new highs above 2.8172 should not surprise.
Economy - Futures Market Outlook w/John Caruso - 12/16/2021
Futures Market Outlook w/John Caruso - 12/16/2021
By: John Caruso, Senior Market StrategistPosted Dec 16, 2021 9:15AM CT
FOMC Highlights:
-Taper accelerated to $30B (up from $15B)
-Dot plot shows and extra hike in 2022 to 3 (up from 2)
-The Fed will not hike rates if A. the Economy cannot withstand one and B. Not until the USA has reached FULL EMPLOYMENT
That last part was the “olive branch” to the bulls. There’s plenty of ambiguity around the definition of “Full Employment”, and when asked about it in the Q&A…Powell bobbed and weaved. Powell even went as far as saying something to the effect that they “didn’t want to roil markets”. That was good enough for a +2.00% rally across the board in the broader stock indices.
Interest Rates: This is going to be fairly unpopular with many, and always subject to change, but my bias still lies on the side of the “bond bulls” at the moment. Why? Well for one thing, bond yields have the tendency to remain “range bound” as growth continues to accel, but the Inflation component of the economy begins to cool. Furthermore, we believe there is going to be a pending shift to Scenario 4 aka Risk-Off backdrop headed into Q2 2022 – which in that case, it’s a clear cut BUY TREASURIES. Once again, this is akin to Q4 2018 – when the FED went HAWKISH right at the cycle TOP! While consensus was bearish bonds (because the Fed was Hawkish obviously), we were BULLISH bonds because we had the highest probability suggesting that the cycle was COOLING and we were moving to Scenario 4 in spite of the Fed being too HAWKISH. You got that? So in essence you could say that the Fed is a HAWKISH as they’re going to be RIGHT NOW.
Side note: The BOE raised interest rates to 0.25% vs 0.10% exp. EVEN in light of the Omicron breakout in the UK. So maybe that should tell you something about how central banks are going to set policy even in the face of Covid19 going forward.
I will be traveling today, but I’ll be in front of the market tomorrow for the morning session and into the close. So if there’s something actionable, you’ll get a signal, and you can call the desk for assistance.
All the best. Good luck.
If you have any questions or would like to discuss the markets further, please feel free to contact me at 800-669-5354 or jcaruso@rjofutures.com.