Looking to diversify your investment portfolio with futures trading, but lack the expertise on your own? Trading Systems and their programs are now listed on our website complete with track records, products traded and minimum account requirements and fees. If you need help navigating the site and viewing the results, give us a call.
New: Micro Bitcoin Investor Kit
Bitcoin is on an unprecedented run and is at the forefront of the trend in cryptocurrency and as a response, the CME has released a micro Bitcoin futures contract that is 1/10th the size of a regular Bitcoin futures contract. Learn everything you need to trade the micro Bitcoin futures contract with this Investor Kit!
The Markets
Metals - Don't Count Gold Out!
Don't Count Gold Out!
By: Frank J. Cholly, Senior Market StrategistPosted Jun 25, 2021 8:56AM CT
Gold and precious metals may have gotten slammed off a
“shift” in Fed language. A willingness to talk about talking about rate hikes.
The Fed won’t be able to control inflation, and inflation will be persistent.
Not transitory. We have never seen anything like what has happened to the
global economy over the past twelve months. The huge increase in money supply.
The rate of savings. The reopening of the economy. The pent-up demand.
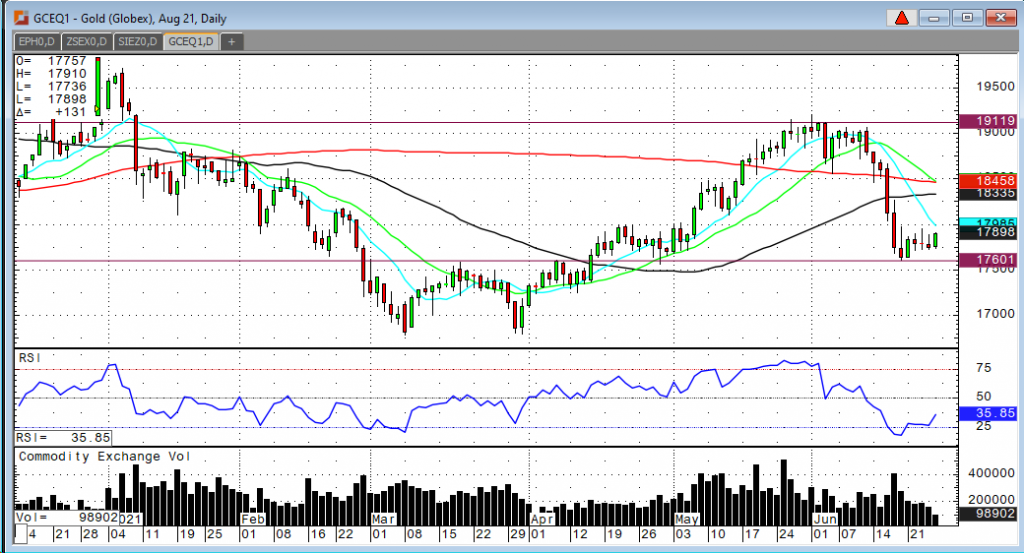
I believe that it’s usually a level on the chart that turns
a market around. It looks to me like gold has found a value range around
$1,775. On the downside, $1,760 needs to hold or we will likely see a test of
$1,740. On the way up, gold needs a close above $1,800 then a good pop above
$1,820 to get back on the uptrend.
Platinum back above $1,100 is a positive, but we need to see a close up there today.
Gold Aug '21 Daily Chart If you have any questions or would like to discuss the markets further, please feel free to contact me at 800-826-4124 or fcholly@rjofutures.com. Metals - Silver Market Sideways
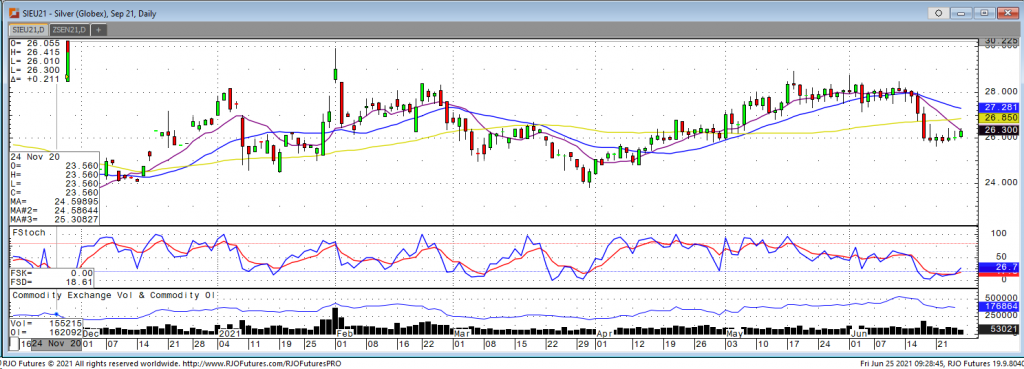
The silver market chopped sideways this week around the $26 level after falling $2 the end of last week’s trade. There has been a nice recovery in stocks since the Fed meeting last week and that along with the Fed reiterating that inflation will be temporary has limited any bullish strength in silver. The market also saw a PCE number that was higher than the prior month but in line with expectations. This would typically show increasing inflation expectations and benefit the gold and silver but the market hasn’t been reacting to traditional drivers such as increasing demand and signs of inflation. Although Sept silver has found support around $26, it was unable to hold any push higher off that level. A break of $25.85 would likely see the price trade down to $24 which is the lower end of the longer term, sideways channel it has been trading in. The bulls need to see a rally that goes to test resistance of $28 but with the way the market has been ignoring any fundamental data that it normally follows it might be difficult for any bullish rally in the near term.
Silver Sep '21 Daily Chart If you have any questions or would like to discuss the markets further, please feel free to contact me at 800-826-2270 or therrmann@rjofutures.com. Energy - Crude Oil Near Three Year High
Crude Oil Near Three Year High
By: Alex Turro, Senior Market StrategistPosted Jun 25, 2021 10:03AM CT
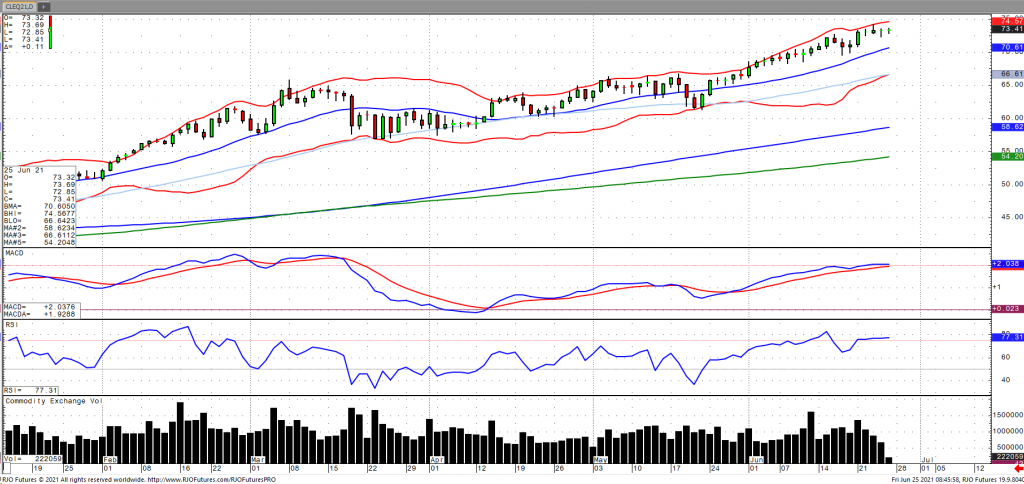
Oil prices have come off their Wednesday lows as the global recovery demand continues to come into focus amidst higher highs in European high frequency data following an improvement in German business confidence and Eurozone manufacturing as well as services PMI earlier this week. This was coupled with a drawdown in oil inventories as US crude inventories fell to their lowest since March 2020 with US gasoline stocks posting a surprise draw as well, according to the EIA. OPEC+ are set to meet on July 1st to discuss output cuts and a potential increase in production. This comes as doubts remain regarding Iranian oil coming back online despite claims of an impending end to Iranian sanctions. The market remains bullish trend with today’s range seen between 70.22 – 74.13.
Crude Oil Aug '21 Daily Chart If you have any questions or would like to discuss the markets further, please feel free to contact me at 800-438-4805 or aturro@rjofutures.com. Agricultural - Bullish Canola Count Intact Above Minimum 851.5
Bullish Canola Count Intact Above Minimum 851.5
By: RJO Market InsightsPosted 10/14/2022
Posted on Oct 14, 2022, 07:42 by Dave Toth
On
the heels of mid-Sep-to-early-Oct's steeper, accelerated, 3rd-wave-looking
recovery, the past week-and-a-half's boringly lateral chop is first considered
a corrective/consolidative event that warns of a continuation of the uptrend
that preceded it to new highs above 04-Oct's 891.0 high. This count
remains consistent with our broader base/correction/recovery count introduced
in 13-Sep's Technical Blog following that
day's bullish divergence in short-term momentum above 07-Sep's 809.5 minor
corrective high detailed in the hourly chart below.
The
important takeaway from this month's lateral, sleepy price action is the
definition of Wed's 851.5 low as
the end or lower boundary of a suspected 4th-Wave correction. A failure
below 851.5 will confirm a bearish divergence in daily momentum and defer or
threaten a bullish count enough to warrant non-bullish decisions like
long-covers. A failure below 851.5 will not
necessarily negate a broader bullish count, but it will threaten it enough to
warrant defensive measures as the next pertinent technical levels below 851.5 are
13-Sep's prospective minor 1st-Wave high at 813.8 and obviously 08-Sep's 766.0
low. And making non-bullish decisions "down there" is
sub-optimal to say the least. Per such, both short- and longer-term
commercial traders are advised to pare or neutralize bullish exposure on a
failure below 851.5, acknowledging and accepting whipsaw risk- back above 04-Oct's
891.0 high- in exchange for much deeper and sub-optimal nominal risk below
766.0.
On
a broader scale, the daily log scale chart above shows the developing potential
for a bearish divergence in daily momentum that will be considered confirmed
below 851.5. This chart also shows the past month's recovery thus far
stalling in the immediate neighborhood of the (888.0) Fibonacci
minimum 38.2% retrace of Apr-Sep's entire 1128 - 766 decline). COMBINED
with a failure below 851.5, traders
would then need to be concerned with at least a larger-degree correction pf the
past month's rally and possibly a resumption of Apr-Sep's major downtrend.
Until
and unless the market fails below 851.5 however, we would
remind longer-term players of the key elements on which our bullish count is
predicated:
a confirmed bullish divergence in WEEKLY momentum
(below)
amidst
an
historically low 11% reading in out RJO Bullish Sentiment Index and
a
textbook complete and major 5-wave Elliott sequence down from 29-Apr's
1128 high to 08-Sep's 766.0 low.
Thus
far, the market is only a month into correcting a 4-MONTH, 32% drawdown, so
further and possibly protracted gains remain well within the bounds of a major
(suspected 2nd-Wave) correction of Apr-Sep's decline within an even more
massive PEAK/reversal process from 17-May's 1219 high on an active continuation
basis below.
These
issues considered, a bullish policy and exposure remain advised with a failure
below 851.5 required to defer or threaten this call enough to warrant moving to
a neutral/sideline position. In lieu of such weakness, we anticipate a
continuation of the past month's rally to new highs and potentially significant
gains above 891.0.
Agricultural - Have We Seen a Top in Grains?
Have We Seen a Top in Grains?
By: Michael Sabo, Senior Market StrategistPosted Jun 25, 2021 10:06AM CT
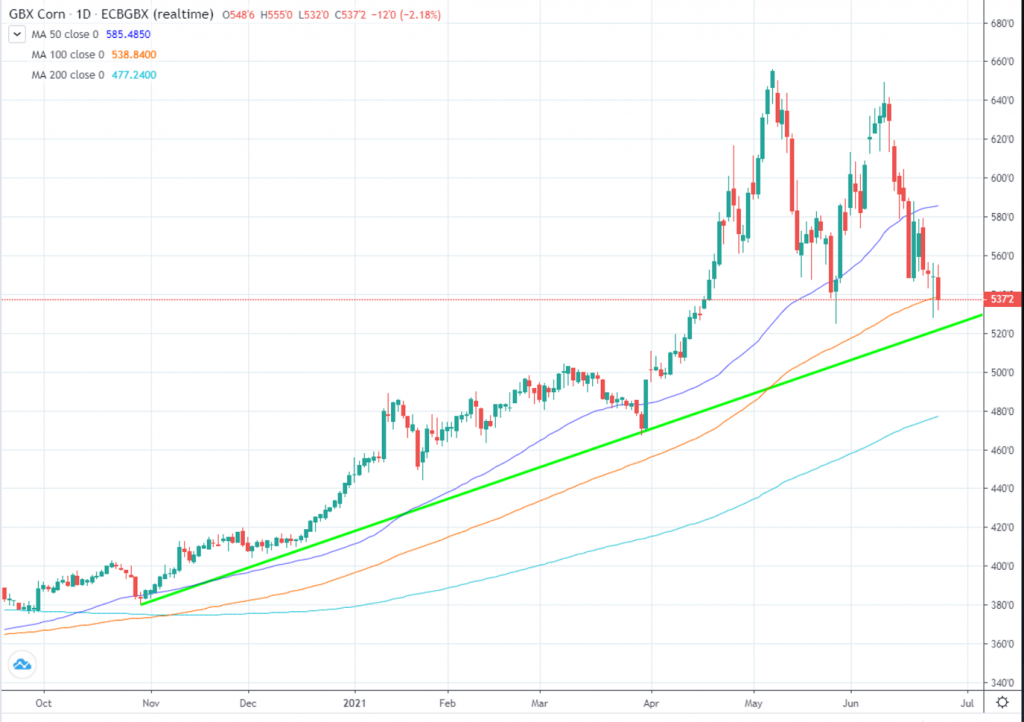
The question on most traders and producers’ minds is have we seen the top in the grain markets? I don’t believe we have yet. The chart patterns still suggest the long-term upside trend remains in place even with corn off over $1 and soybeans off about $2 from their most recent highs. Until we see failure of the major trend lines in these markets, I believe traders should still look for buying opportunities. Recent rainfall has put the market under some pressure, to be expected, which should be used as a buying opportunity but not without a solid risk management plan in place. In the corn and soybean market traders could consider buying futures at these levels and using an option strategy to manage the risk. With the sizable daily ranges and increased margins using an option strategy to manage your futures positions risk can reduce margin requirements and allow you to weather the day to day “market noise” while keeping your focus on the bigger trend. Feel free to call me at 1-800-367-7290 to discuss some current trading strategies.
Corn Daily Chart If you have any questions or would like to discuss the markets further, please feel free to contact me at 800-367-7290 or msabo@rjofutures.com. Interest Rates - Fed Could Raise Rates Soon
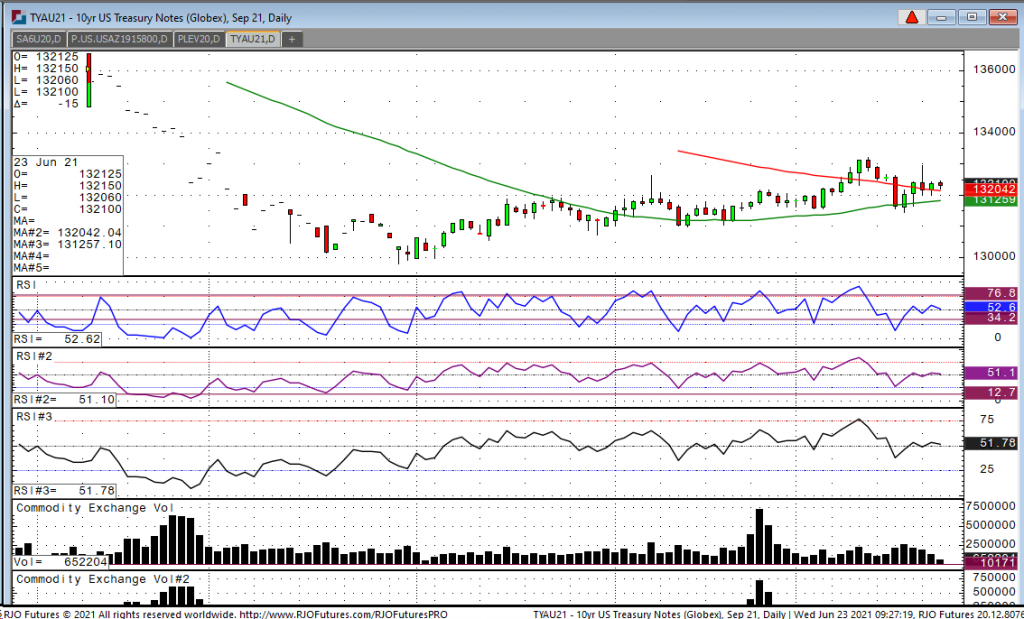
Looking at the September 10-year note, we have had a narrow range today with a high of 123-15 and a low of 123-06. The market has been somewhat supported today with data showing mixed news. We saw market manufacturing a bit stronger than expected, but new home sales month on month were weaker than expected. Yesterday, Chairman Powell, testified before congress and basically reiterated what he has been saying all along that he sees inflation being transitory and any jump that we have seen in the last month has been caused by the economy reopening. I am not sure he is correct in his assumption as one just needs to visit your local grocery store or gas station and see prices are up substantially. The big test will come on Friday when the PCE comes out at 7:30 central. Rumors are it will come out very strong and if it does, traders should watch out below because the Fed could say that they will soon begin to taper, meaning they will cut back on their bond buying which is a precursor for the possibility of raising rates sooner rather than later.
10-Year Note Sep '21 Daily Chart If you have any questions or would like to discuss the markets further, please feel free to contact me at 800-826-2270 or gperlin@rjofutures.com. Equity - Stocks Hit New All-Time Highs
Stocks Hit New All-Time Highs
By: Bill Dixon, Senior Market StrategistPosted Jun 25, 2021 10:16AM CT
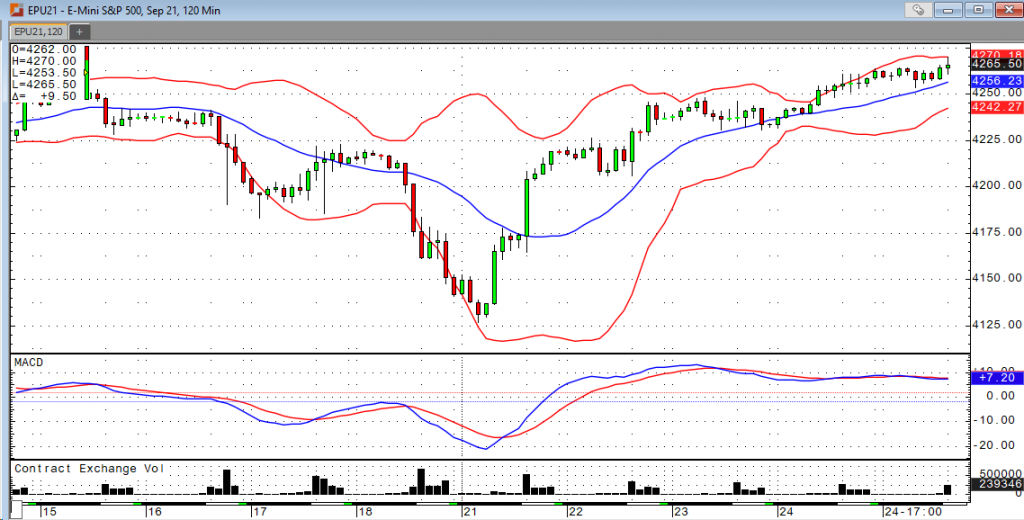
The September S&P futures have printed another all-time
high this morning. A week after the Fed
put the rally on pause by expressing some concern about the rate of inflation,
optimism about the reopening and hope that a bipartisan infrastructure bill may
actually get done has us trending higher yet again. The Dow, Nasdaq, and Russell failed to print
new all-time highs so far, but the Russell and Nasdaq are not terribly far
off.
Confirming Fed Chair Powell’s inflationary concerns, this
morning’s PCE reading (Fed’s preferred measure of inflation) went up another
.4% in May. That means that the price of
goods has gone up 3.9% over the past year.
The Fed expects these numbers will start to cool off as the economy
normalizes and the labor shortage resolves itself. Anyone who has filled up their tank, visited
the grocery store, looked for a house or car, etc. recently can only hope that
he’ll be right about this all being “transitory.”
Next week’s news slate is a strong one. Traders will be most focused on next Friday’s jobs data. Powell has stood firm that he won’t consider tapering until we reach full employment, and the last few jobs numbers have been underwhelming at best. We’ll see if we can finally start to turn the corner, but I don’t expect that to happen until we see greater expiration of benefits. Have a great weekend.
E-mini S&P 500 Sep '21 Daily Chart If you have any questions or would like to discuss the markets further, please feel free to contact me at 800-669-5354 or bdixon@rjofutures.com. Economy - S-T Mo Failure Insufficient to End RBOB Correction, But Beware
S-T Mo Failure Insufficient to End RBOB Correction, But Beware
By: RJO Market InsightsPosted 11/08/2022
Posted on Nov 08, 2022, 07:51 by Dave Toth
In Fri's Technical Webcast we identified a
minor corrective low at 2.6328 from Thur as a mini risk parameter the market
needed to sustain gains above to maintain a more immediate bullish count.
The 240-min chart below shows the market's failure overnight below this level,
confirming a bearish divergence in very short-term momentum. This mo
failure defines Fri's 2.8172 high as
one of developing importance and a parameter from which very short-term traders
can objectively base non-bullish decisions like long-covers.
Given
the magnitude of the past three weeks' broader recovery however, this
short-term momentum failure is of an insufficient scale to conclude anything
more than another correction within this broader recovery from 26-Sep's 2.1877
low. Indeed, overnights failure below 2.6328 only allows us to conclude
the end of the portion of the month-and-a-half rally from 31-Oct's 2.4822 next
larger-degree corrective low. 2.4822 is the
risk parameter this market still needs to fail below to break the uptrend from
18-Oct's 2.3526 low while this 2.3526 low
remains intact as the risk parameter this market needs to fail below to break
the month-and-a-half uptrend. From an
intermediate-to-longer-term perspective, this week's setback falls well within
the bounds of another correction ahead of further gains. This is another
excellent example of the importance of technical and trading SCALE and
understanding and matching directional risk exposure to one's personal risk
profile.
The
reason overnight's admittedly minor mo failure might have longer-term
importance is the 2.8172-area from which it stemmed. In
Fri's Technical Blog we also noted the market's engagement of the
2.8076-to-2.8159-area marked by the 61.8% retrace of Jun0-Sewp's 3.2758 -2.1877
decline and the 1.000 progression of Sep-Oct's initial 2.1877 - 2.6185
(suspected a-Wave) rally from 18-Oct's 2.3526 (suspected b-Wave) low. We
remind longer-term players that because of the unique and compelling confluence
of:
early-Aug's bearish divergence in WEEKLY momentum
amidst
historically
extreme bullish sentiment/contrary opinion levels in our RJO Bullish
Sentiment Index
an
arguably complete and massive 5-wave Elliott sequence from Mar'20's 0.4605
low to Jun's 4.3260 high (as labeled in the weekly log active-continuation
chart below) and
the
5-wave impulsive sub-division of Jun-Sep's (suspected initial 1st-Wave) decline
The
recovery attempt from 26-Sep's 2.1877 low is arguably only a 3-wave (Wave-2)
corrective rebuttal to Jun-Sep's decline within a massive, multi-quarter
PEAK/reversal process. Now granted, due to the magnitude of 2020 -2022's
secular bull market, we discussed the prospect for this (2nd-Wave corrective)
recovery to be "extensive" in terms of both price and time. A
"more extensive" correction is typified by a retracement of 61.8% or
more and spanning weeks or even months following a 3-month decline. Per
such, the (suspected corrective) recovery from 26-Sep's 2.1877 low could easily
have further to go, with commensurately larger-degree weakness than that
exhibited this week (i.e., a failure below at least 2.4822) required
to consider the correction complete. Indeed, the daily log chart above
shows the market thus far respecting former 2.6185-area resistance from 10-Oct
as a new support candidate.
These
issues considered, very shorter-term traders have been advised to move to a neutral/sideline
position following overnight's momentum failure below 2.6328, with a recovery
above 2.8172 required to negate this call, reaffirm the recovery and re-expose
potentially significant gains thereafter. For intermediate- and
longer-term players, a bullish policy and exposure remain advised with a
failure below 2.4822 required to threaten this call enough to warrant
neutralizing exposure. We will be watchful for another bearish divergence
in momentum following a recovery attempt that falls short of Fri's 2.8172 high
that would be considered the next reinforcing factor to a count calling that
2.8172 high the prospective end to the month-and-a-half 2nd-Wave
correction. In lieu of such, a resumption of the current rally to
eventual new highs above 2.8172 should not surprise.
Economy - Futures Market Outlook w/John Caruso - 06/23/2021
Futures Market Outlook w/John Caruso - 06/23/2021
By: John Caruso, Senior Market StrategistPosted Jun 23, 2021 1:26PM CT
John Caruso talks about the latest news in the futures market, including the news that Atlanta Fed Chairman Raphael Bostic believes that interest rates could be raised by the end of 2022. If you have any questions or would like to discuss the markets further, please feel free to contact me at 800-669-5354 or jcaruso@rjofutures.com.