Looking to diversify your investment portfolio with futures trading, but lack the expertise on your own? Trading Systems and their programs are now listed on our website complete with track records, products traded and minimum account requirements and fees. If you need help navigating the site and viewing the results, give us a call.
New: Micro Bitcoin Investor Kit
Bitcoin is on an unprecedented run and is at the forefront of the trend in cryptocurrency and as a response, the CME has released a micro Bitcoin futures contract that is 1/10th the size of a regular Bitcoin futures contract. Learn everything you need to trade the micro Bitcoin futures contract with this Investor Kit!
The Markets
Metals - Gold is Flat
Gold is Flat
By: Frank J. Cholly, Senior Market StrategistPosted Dec 9, 2021 9:36AM CT
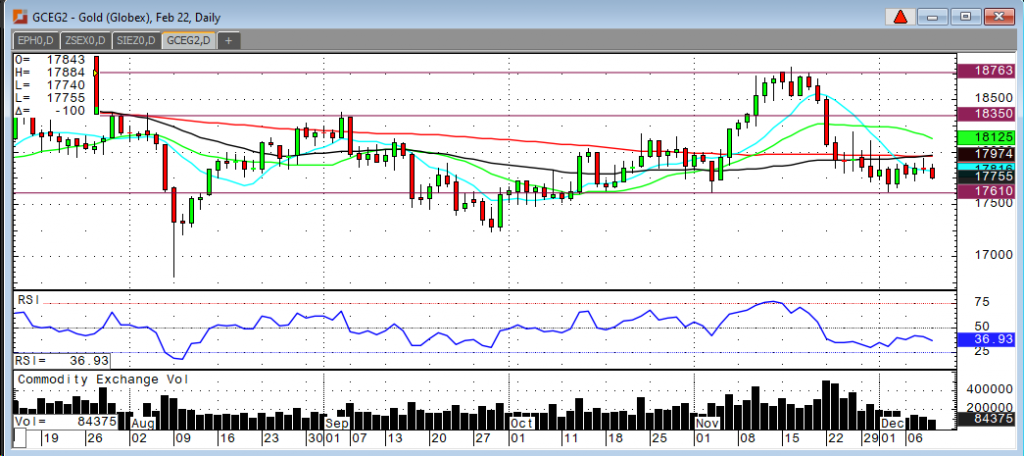
After a convincing breakout rally above $1835 and then
sustaining levels above $1850 here we are again, bouncing along at $1775. Just
like that gold gave back $100 in premium. What’s wrong with gold? Gold can’t
rally on clear signs of inflation. Gold can’t rally as a safe haven trade. But
gold is basing another bottom and should have a very easy time moving back
towards $1,900, but what will be the catalyst? I don’t think that it’ll be the
risk off trade. It won’t be a weaker dollar trade either, because the dollar
will be supported by rising rates. Rate hikes are coming. Inflation is
undeniable and this administration is all about spending more…
I still firmly believe that gold will eventually rally on inflation. I know that the Fed will not have an easy time rising rates and that’s why inflation will continue to get hotter. Once gold gets back above $2,000, and it will, that will become a new bottom for a very long time. Some of you may remember when people didn’t want to buy gold at $775 because it was too “expensive”!
Gold Feb '22 Daily Chart If you have any questions or would like to discuss the markets further, please feel free to contact me at 800-826-4124 or fcholly@rjofutures.com. Metals - Silver Trending Sideways
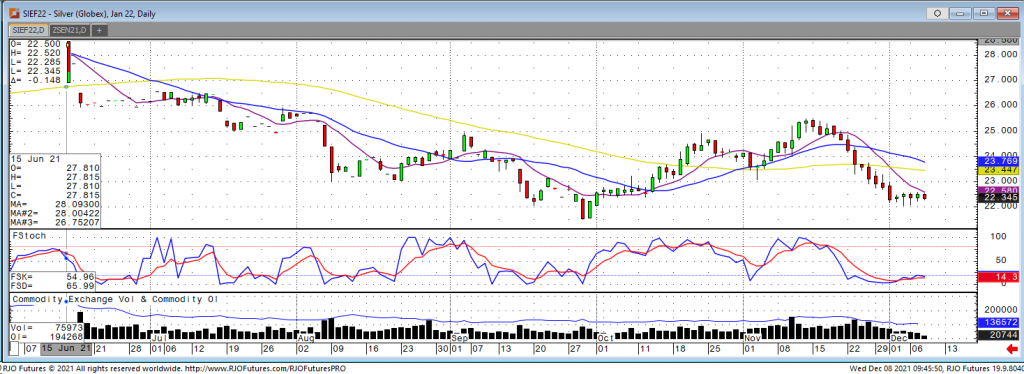
The January silver contract has traded sideways so far this week with Monday putting in a low of 22.10. The silver market is looking to build some support here, at least temporarily, after the fall the second half of November from 25.475 to 22.05. Stocks are trying to hold the gains from earlier in the week and the market is awaiting US CPI numbers that come out on Friday. More importantly for the silver market is how the US dollar will react to that CPI number, a higher-than-expected number will be bullish the US dollar and most likely drive silver lower. Also, the Fed projection of tapering sooner than originally thought, could pressure stocks which would add pressure to the silver market as well. Another disappointing look for the silver market was its lack of a push higher with the last two days of a risk on environment in stocks. The bullish side of the trade is going to want to see support build here with a slowing of tapering talks and higher inflation readings. Resistance comes in at 23.45 for the January contract and a push through that is needed to see recent highs tested again. If support is broken expect a move lower, but it should be short lived as the 20-22 range is an attractive accumulation level for longer term traders.
Silver Jan '22 Daily Chart If you have any questions or would like to discuss the markets further, please feel free to contact me at 800-826-2270 or therrmann@rjofutures.com. Energy - Oil Lower on Variant Restrictions
Oil Lower on Variant Restrictions
By: Alex Turro, Senior Market StrategistPosted Dec 9, 2021 9:38AM CT
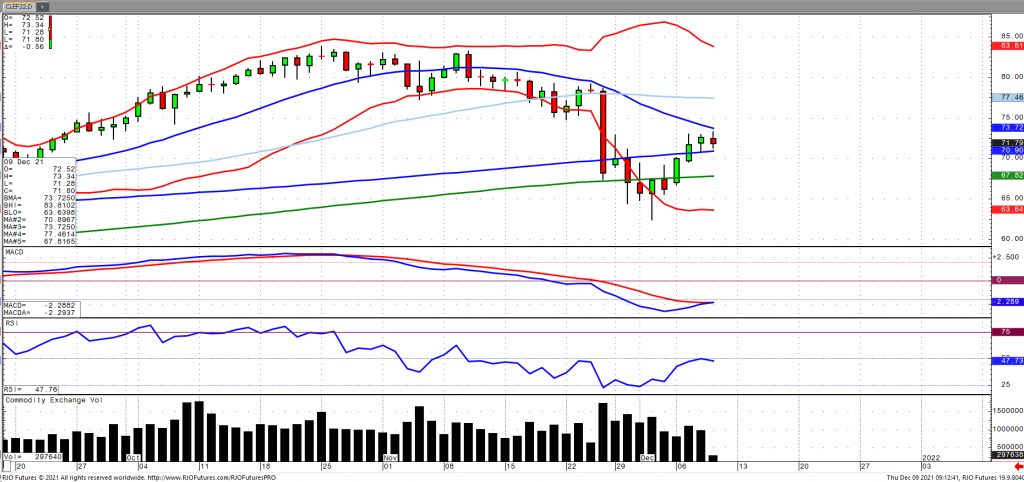
Oil prices are softer as of Thursday morning, reversing gains from earlier in the week, amid enhanced global restrictions from the omicron variant as well as concern regarding its subsequent impact on demand, specifically fuel. In addition, a downgrade to Chinese property developers (Evergrande and Kaisa Group) broadened anxiety. Weekly inventories were largely muted with stocks falling -241k barrels with the deficit widening to -70.361 million barrels and now -30.986 million barrels below the five-year average. Production increased to 11.70 million barrels per day with the third consecutive week of increases and the highest total since May. Oil volatility (ovx) has fallen from its most recent high of ~78 but continues to remain elevated with today’s range between 62.93 – 74.32.
Crude Oil Jan '22 Daily Chart If you have any questions or would like to discuss the markets further, please feel free to contact me at 800-438-4805 or aturro@rjofutures.com. Softs - Key Reversal in Coffee from 10-Year Highs
Key Reversal in Coffee from 10-Year Highs
By: Tony Cholly, Senior Market StrategistPosted Dec 8, 2021 9:00AM CT
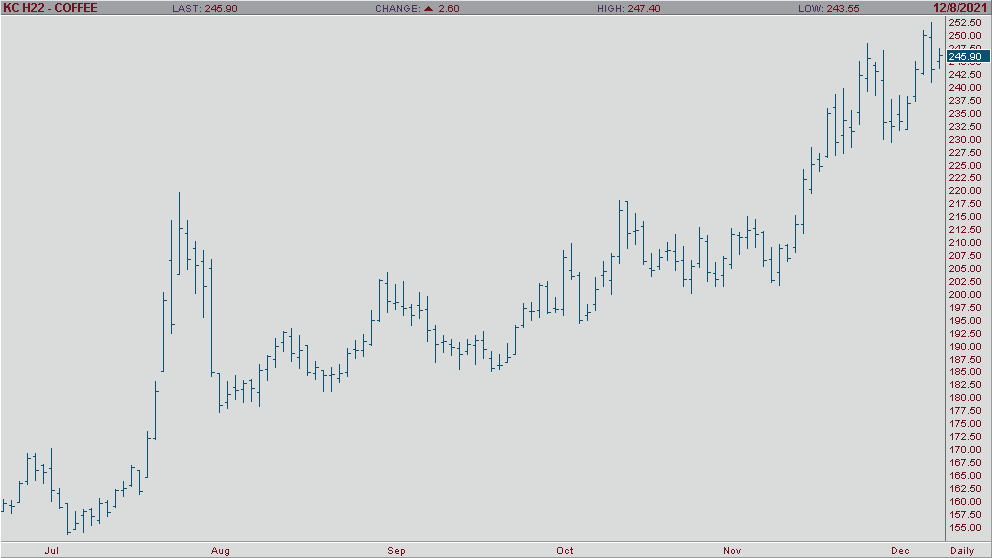
While coffee’s supply/demand outlook is still bullish, a
likely record sized net spec long position has left the market vulnerable to
profit taking and longs liquidating their positions. After reaching 10 year
highs, coffee made a sharp reversal to the downside with a daily key reversal.
When the market could not rally on Colombian production decline, however, a
wave of profit taking and long liquidation took the coffee market well below
its highs by the close. Guatemalas November coffee exports came in 56% above
last years total, which is due in part to the increase in global demand since
mid year.
The reversal yesterday is a short term bearish indicator. Momentum studies are trending lower from high levels which should accelerate a move lower on a break below support. The next are of support hits at 23750 and 23345, while resistance is at 24900 and 25650.
Coffee Mar '22 Daily Chart If you have any questions or would like to discuss the markets further, please feel free to contact me at 800-826-2270 or tcholly@rjofutures.com. Agricultural - Bullish Canola Count Intact Above Minimum 851.5
Bullish Canola Count Intact Above Minimum 851.5
By: RJO Market InsightsPosted 10/14/2022
Posted on Oct 14, 2022, 07:42 by Dave Toth
On
the heels of mid-Sep-to-early-Oct's steeper, accelerated, 3rd-wave-looking
recovery, the past week-and-a-half's boringly lateral chop is first considered
a corrective/consolidative event that warns of a continuation of the uptrend
that preceded it to new highs above 04-Oct's 891.0 high. This count
remains consistent with our broader base/correction/recovery count introduced
in 13-Sep's Technical Blog following that
day's bullish divergence in short-term momentum above 07-Sep's 809.5 minor
corrective high detailed in the hourly chart below.
The
important takeaway from this month's lateral, sleepy price action is the
definition of Wed's 851.5 low as
the end or lower boundary of a suspected 4th-Wave correction. A failure
below 851.5 will confirm a bearish divergence in daily momentum and defer or
threaten a bullish count enough to warrant non-bullish decisions like
long-covers. A failure below 851.5 will not
necessarily negate a broader bullish count, but it will threaten it enough to
warrant defensive measures as the next pertinent technical levels below 851.5 are
13-Sep's prospective minor 1st-Wave high at 813.8 and obviously 08-Sep's 766.0
low. And making non-bullish decisions "down there" is
sub-optimal to say the least. Per such, both short- and longer-term
commercial traders are advised to pare or neutralize bullish exposure on a
failure below 851.5, acknowledging and accepting whipsaw risk- back above 04-Oct's
891.0 high- in exchange for much deeper and sub-optimal nominal risk below
766.0.
On
a broader scale, the daily log scale chart above shows the developing potential
for a bearish divergence in daily momentum that will be considered confirmed
below 851.5. This chart also shows the past month's recovery thus far
stalling in the immediate neighborhood of the (888.0) Fibonacci
minimum 38.2% retrace of Apr-Sep's entire 1128 - 766 decline). COMBINED
with a failure below 851.5, traders
would then need to be concerned with at least a larger-degree correction pf the
past month's rally and possibly a resumption of Apr-Sep's major downtrend.
Until
and unless the market fails below 851.5 however, we would
remind longer-term players of the key elements on which our bullish count is
predicated:
a confirmed bullish divergence in WEEKLY momentum
(below)
amidst
an
historically low 11% reading in out RJO Bullish Sentiment Index and
a
textbook complete and major 5-wave Elliott sequence down from 29-Apr's
1128 high to 08-Sep's 766.0 low.
Thus
far, the market is only a month into correcting a 4-MONTH, 32% drawdown, so
further and possibly protracted gains remain well within the bounds of a major
(suspected 2nd-Wave) correction of Apr-Sep's decline within an even more
massive PEAK/reversal process from 17-May's 1219 high on an active continuation
basis below.
These
issues considered, a bullish policy and exposure remain advised with a failure
below 851.5 required to defer or threaten this call enough to warrant moving to
a neutral/sideline position. In lieu of such weakness, we anticipate a
continuation of the past month's rally to new highs and potentially significant
gains above 891.0.
Agricultural - Grains - Consolidation in Corn Weekly Chart
Grains - Consolidation in Corn Weekly Chart
By: Michael Sabo, Senior Market StrategistPosted Dec 9, 2021 10:40AM CT
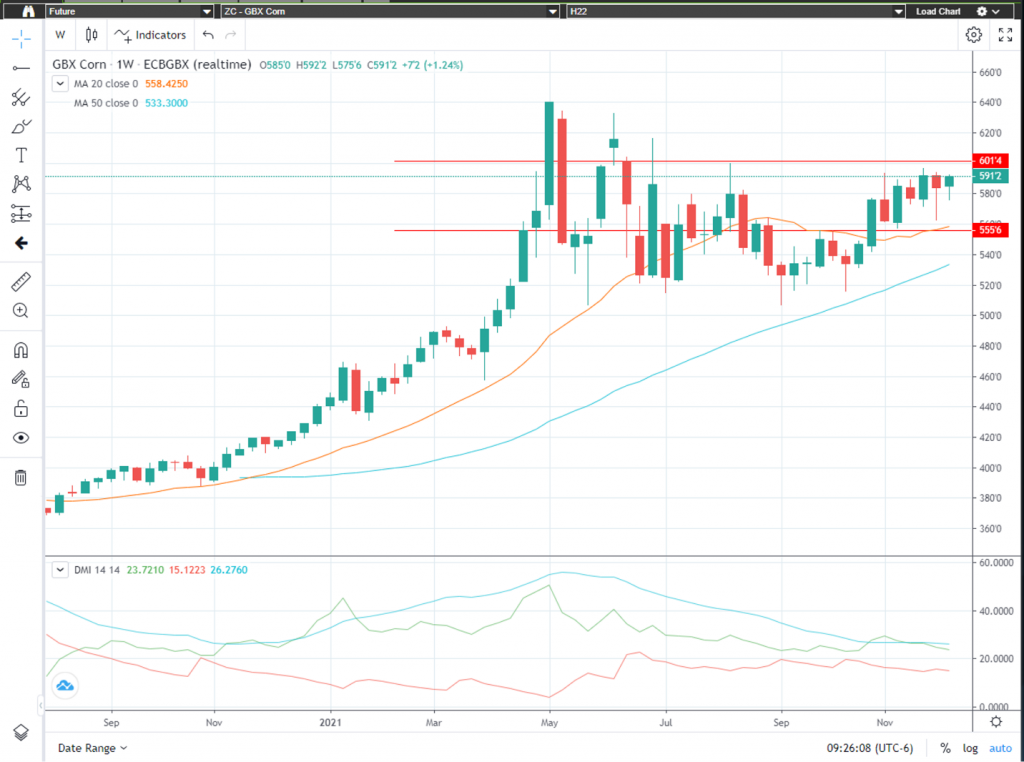
Last week I advised traders “Today’s
break above $5.83 ¼ is a minor break out to the upside after 2 days of market
consolidation. Traders should watch for another push to break above the major
trendline (see red line on chart below) if that happens, I believe it will, the
market should push quickly to the $6.00 area.
I remain bullish…” In fact, after the break above $5.83 ¼ on
December 3rd March corn had an inside day and then has moved higher
for the last 3 trading sessions with each session seeing a higher high and a
higher low. At the time of this writing, March corn is trading at $5.91, a
solid move higher since last Friday. At 11am today the USDA will release the
Supply/Demand and Crop Production Report, this could be a market mover. I would
recommend traders watch for a breakout above $6.01 ¼ or break below $5.55 ¾
(see red lines below) to gauge short term market direction.
The “big picture” numbers remain the
same and probably will for some time. I firmly believe a break below $4.96 could
give the bears control of the market and a break above $6.39 ½ on the upside may
have enough bulls behind it to propel corn to all-time highs. There are several
minor areas of support and resistance inside this range that can help with
short term market direction if violated. Call me directly at 1-800-367-7290 for
more in-depth discussion on these numbers and to discuss trading strategies
specific to your situation.
I would suggest using an option
strategy to manage your futures position risk or an outright option strategy.
Implied option volatility has come down quite a bit from its most recent highs
mainly due to the consolidation and tighter trading ranges. I have 25-years of grain
market experience, feel free to call or email with any questions you may have. Be
sure to check out my archived weekly grain market insight articles posted on
our website
**** Reserve
your FREE 2022 Commodity Trading Guide Today! ****
This 55-page guide is packed with indispensable market information. It has a complete commodity calendar that lists the dates and times of Market Reports, option expiration dates, futures first notice dates, futures last trade dates, etc. It readily serves as your commodity market encyclopedia giving you an in depth look at each commodity, there is market almanac for all actively traded commodities and much more! To reserve your complimentary Commodity Trading Guide, send me an email at msabo@rjofutures.com with the following information: your full name, mailing address and a preferred phone number so we can confirm your request. Once confirmed, I will reserve your trading guide, and have it sent out as soon as we receive them.
Corn Mar '22 Daily Chart If you have any questions or would like to discuss the markets further, please feel free to contact me at 800-367-7290 or msabo@rjofutures.com. Interest Rates - Interest Rates Waiting on Omicron
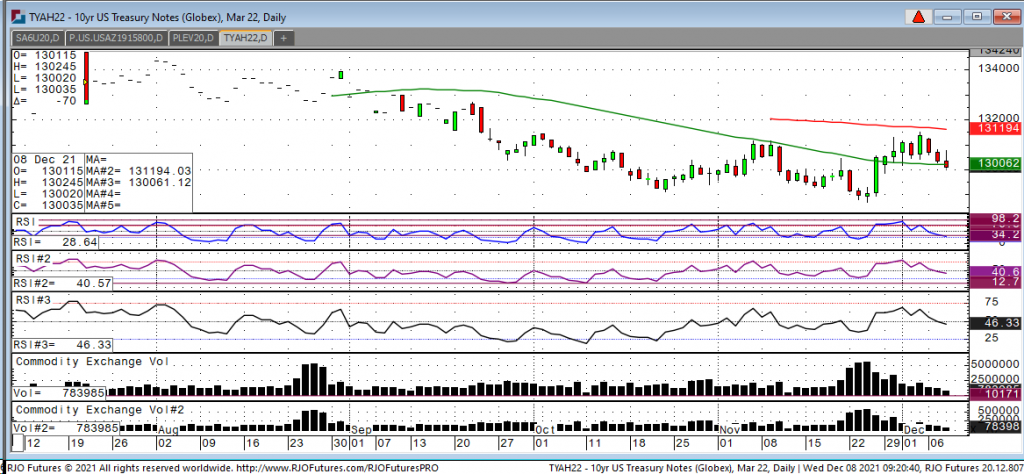
Looking at the March 10-year note, overnight we saw a high of 130-24 and a low of 130-043 and currently the contract is trading 130-055. Last Friday, we saw payrolls come in much weaker than expected that pushed prices to a new high for the move at 131-16, adding to the strength was the new variant that surfaced. There is not enough data for scientists to conclude if Omicron is worse than the current Delta strain. There have been reports in the last few days that say it might be more contagious, but symptoms mirror the common cold. That has taken a lot of the steam out of the note this week and traders are now focused, or let’s say refocused, on the inflation debate and the continued bottlenecks in the economy that continue to drive goods and services to levels that the consumer has not seen in years. There has also been Fed governors on tape stating that the fed needs to be more proactive in tapering and that inflation is still too high and is starting to put a dent in consumer spending. So, as many in the fed circle have become more hawkish and early indications say the new variant may be much less dangerous than previously feared, I wouldn’t be surprised if the high we saw last Friday will be the high for days and weeks to come. A close below the 50-day moving average at 130-06 might be exactly what the bears are looking for.
10yr Note Mar '22 Daily Chart If you have any questions or would like to discuss the markets further, please feel free to contact me at 800-826-2270 or gperlin@rjofutures.com. Equity - Recovery in Stocks Takes a Breather
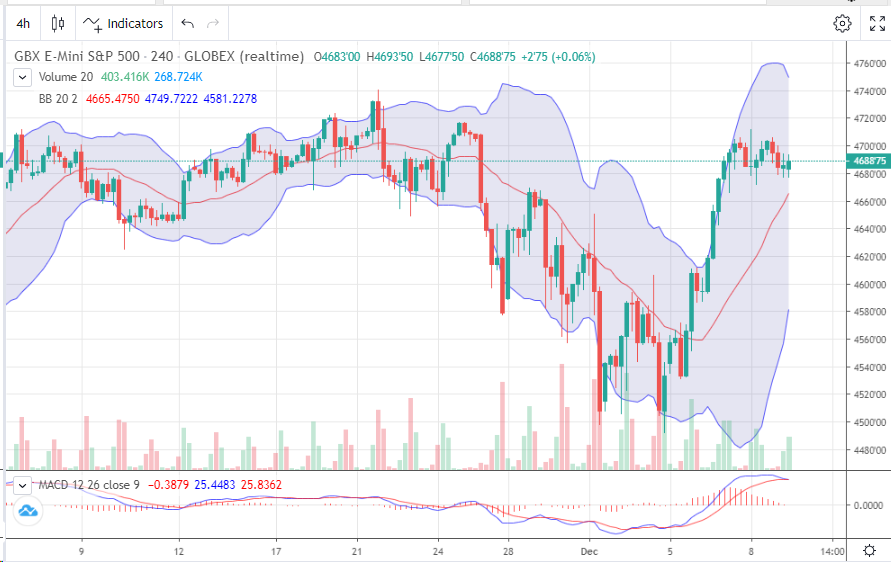
Recovery in Stocks Takes a Breather
By: Bill Dixon, Senior Market StrategistPosted Dec 9, 2021 9:42AM CT
After a strong recovery from last week’s washout, the
incredible, 3-day rally we’ve seen is fizzling out in the early going today. Traders that bought the dip are taking
profits at/near the top end of the ranges.
Traders that were a bit early (myself included) were happy to unload for
smaller losses. Covid fears, talks of
ramping up the taper, debt ceiling woes, and increased global tensions were
just a few of the reasons markets finally put in a meaningful correction.
A week later, the omicron variant seems to be milder than
past variants. While some parts of the
world will likely handle things differently, it appears we will avoid lockdowns
domestically barring some other news.
Taper talk will be addressed following the FOMC’s two-day meeting next
Tuesday and Wednesday. Debt ceiling
theater continues, but that is usually nothing more than that. Theater.
President Biden and Putin met via Zoom, but initial reports lack any
indication things are calming down at the Ukrainian border.
So where do we go next? Does the Santa Claus rally take us higher? Will Powell indeed “double down” on the taper as some have suggested? It’s hard to say, but I think it is a good time to keep positions light until a clearer picture emerges.
E-mini S&P 500 Daily Chart If you have any questions or would like to discuss the markets further, please feel free to contact me at 800-669-5354 or bdixon@rjofutures.com. Economy - S-T Mo Failure Insufficient to End RBOB Correction, But Beware
S-T Mo Failure Insufficient to End RBOB Correction, But Beware
By: RJO Market InsightsPosted 11/08/2022
Posted on Nov 08, 2022, 07:51 by Dave Toth
In Fri's Technical Webcast we identified a
minor corrective low at 2.6328 from Thur as a mini risk parameter the market
needed to sustain gains above to maintain a more immediate bullish count.
The 240-min chart below shows the market's failure overnight below this level,
confirming a bearish divergence in very short-term momentum. This mo
failure defines Fri's 2.8172 high as
one of developing importance and a parameter from which very short-term traders
can objectively base non-bullish decisions like long-covers.
Given
the magnitude of the past three weeks' broader recovery however, this
short-term momentum failure is of an insufficient scale to conclude anything
more than another correction within this broader recovery from 26-Sep's 2.1877
low. Indeed, overnights failure below 2.6328 only allows us to conclude
the end of the portion of the month-and-a-half rally from 31-Oct's 2.4822 next
larger-degree corrective low. 2.4822 is the
risk parameter this market still needs to fail below to break the uptrend from
18-Oct's 2.3526 low while this 2.3526 low
remains intact as the risk parameter this market needs to fail below to break
the month-and-a-half uptrend. From an
intermediate-to-longer-term perspective, this week's setback falls well within
the bounds of another correction ahead of further gains. This is another
excellent example of the importance of technical and trading SCALE and
understanding and matching directional risk exposure to one's personal risk
profile.
The
reason overnight's admittedly minor mo failure might have longer-term
importance is the 2.8172-area from which it stemmed. In
Fri's Technical Blog we also noted the market's engagement of the
2.8076-to-2.8159-area marked by the 61.8% retrace of Jun0-Sewp's 3.2758 -2.1877
decline and the 1.000 progression of Sep-Oct's initial 2.1877 - 2.6185
(suspected a-Wave) rally from 18-Oct's 2.3526 (suspected b-Wave) low. We
remind longer-term players that because of the unique and compelling confluence
of:
early-Aug's bearish divergence in WEEKLY momentum
amidst
historically
extreme bullish sentiment/contrary opinion levels in our RJO Bullish
Sentiment Index
an
arguably complete and massive 5-wave Elliott sequence from Mar'20's 0.4605
low to Jun's 4.3260 high (as labeled in the weekly log active-continuation
chart below) and
the
5-wave impulsive sub-division of Jun-Sep's (suspected initial 1st-Wave) decline
The
recovery attempt from 26-Sep's 2.1877 low is arguably only a 3-wave (Wave-2)
corrective rebuttal to Jun-Sep's decline within a massive, multi-quarter
PEAK/reversal process. Now granted, due to the magnitude of 2020 -2022's
secular bull market, we discussed the prospect for this (2nd-Wave corrective)
recovery to be "extensive" in terms of both price and time. A
"more extensive" correction is typified by a retracement of 61.8% or
more and spanning weeks or even months following a 3-month decline. Per
such, the (suspected corrective) recovery from 26-Sep's 2.1877 low could easily
have further to go, with commensurately larger-degree weakness than that
exhibited this week (i.e., a failure below at least 2.4822) required
to consider the correction complete. Indeed, the daily log chart above
shows the market thus far respecting former 2.6185-area resistance from 10-Oct
as a new support candidate.
These
issues considered, very shorter-term traders have been advised to move to a neutral/sideline
position following overnight's momentum failure below 2.6328, with a recovery
above 2.8172 required to negate this call, reaffirm the recovery and re-expose
potentially significant gains thereafter. For intermediate- and
longer-term players, a bullish policy and exposure remain advised with a
failure below 2.4822 required to threaten this call enough to warrant
neutralizing exposure. We will be watchful for another bearish divergence
in momentum following a recovery attempt that falls short of Fri's 2.8172 high
that would be considered the next reinforcing factor to a count calling that
2.8172 high the prospective end to the month-and-a-half 2nd-Wave
correction. In lieu of such, a resumption of the current rally to
eventual new highs above 2.8172 should not surprise.