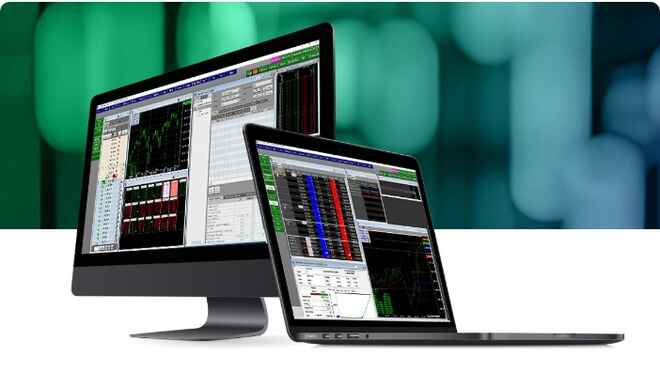
There are two major types of analysis for predicting the performance of commodity futures – fundamental and technical. The latter looks for peaks, bottoms, trends, patterns, and other factors affecting commodity future’s price movement and then makes a buy/sell decision based on those factors. It is a technique many people attempt; though very few are truly successful. The study of technical analysis continues to build credibility with traders throughout the world and there are hundreds of different patterns and indicators that market participants look to leverage in order to gain an edge in the commodity markets.
What is Technical Analysis?
Technical analysis is the study of price action and volume through the careful analysis of various different chart types. Modern-day technical analysis looks to expand upon such principles as price trends, moving averages, volume and open interest, support and resistance levels, as well as momentum indicators.
Often time a technician will look at historical price movement in an effort to predict the next directional move in a given market. This is done by comparing current price action (i.e., current expectations) with comparable historical price action in order to predict the next market move. Since history does tend to repeat itself, often times traders will attempt to study historical price patterns in hopes that the early recognition of these patterns will give them a “tell” to the market’s next move.
This analysis method evaluates commodities by examining statistics generated by market activity, past prices, indicators and volume. Technical analysts do not attempt to measure a commodity’s intrinsic value; instead they monitor pure price action in an effort to assess the underlying strength or weakness of the market in which they are participating.
Using Technical Analysis Studies
Implementation of technical analysis comes from studies of charts and price movements to predict future movements. A technical analyst uses charts to try and find patterns that repeat over a given timeframe. There has been an influx of computer programs that attempt to recognize technical patterns in the market in an effort to capitalize on potential trading opportunities.
There are many different types of technical chart patterns market technicians focus on when making trading decisions and multiple ways to interpret them. This is why technical analysis is an art form. The key is to be able to recognize these patterns and implement a trading strategy based on your beliefs of future price action. As a trader, it is important to have a good understanding of the basic patterns before you can develop a strategy to give you a potential edge. When traders can leverage several different technical indicators in unison that is when market participants truly begin to uncover the value of technical analysis.
Popular Technical Studies
- Support and Resistance
- Moving Average
- Fibonacci Retracements
- Relative Strength Index


