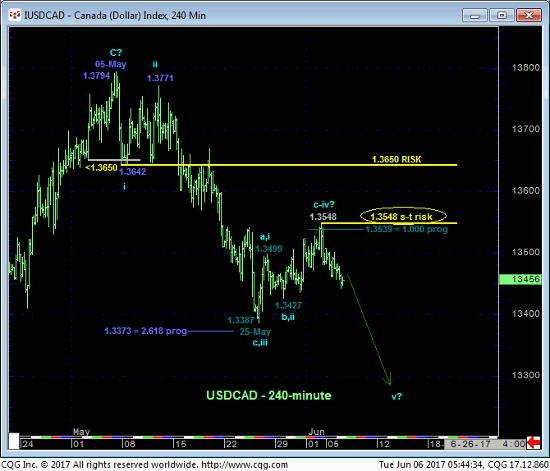
While USDCAD has yet to relapse below 29-May’s 1.3427 low to confirm such, we believe the recent recovery attempt from 25-May’s 1.3387 low to Fri’s 1.3548 high is a 3-wave affair as labeled in the 240-min chart below. Left unaltered by a recovery above 1.3548 this 3-wave recovery is considered a corrective/consolidative event consistent with our bearish count that warns of potentially huge USD losses in the weeks and months ahead. In this regard Fri’s 1.3548 high is considered our new short-term risk parameter from which shorter-term traders with tighter risk profiles can objectively rebase and managed the risk of a resumed bearish policy.

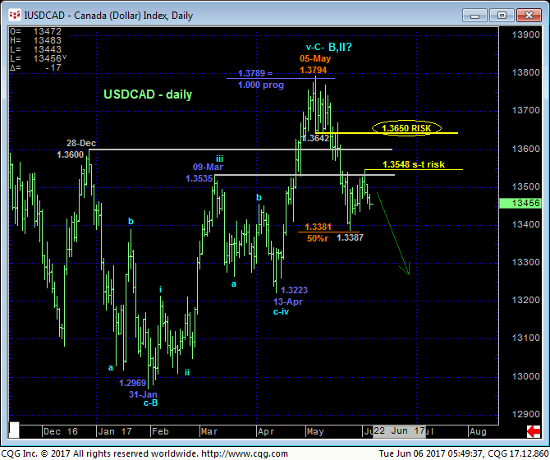
The daily chart below shows that May’s slide has thus far stalled at the exact (1.3381) 50% retrace of Jan-May’s 1.2969 – 1.3794 rally. But the market’s gross failure to sustain late-Apr’s “breakout” above a ton of former 1.35-handle-area resistance-turned-support cannot be ignored as a major indication of weakness and vulnerability, especially given the historically and stubbornly bearish sentiment accorded the CAD futures contract by the managed money circuit that we believe is a major source of fuel for downside vulnerability in the USD.


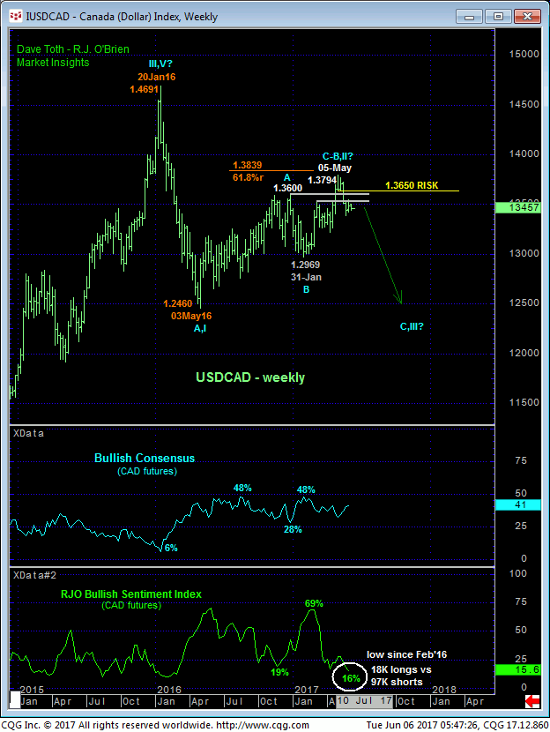
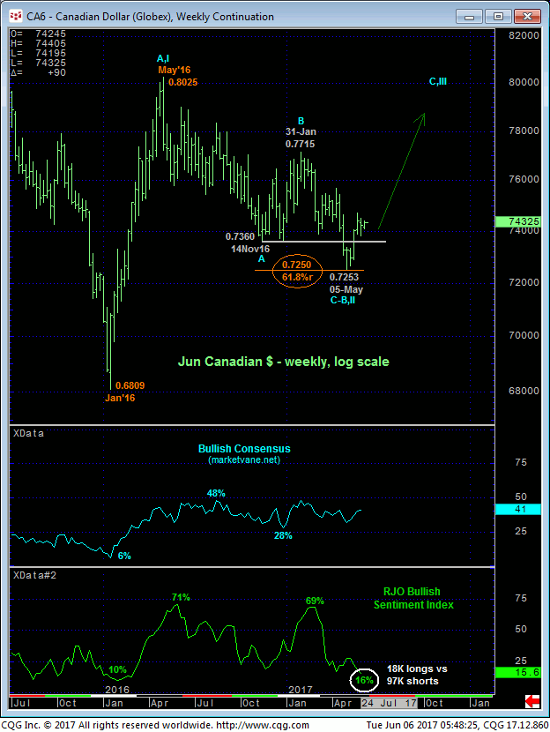
Shockingly, and DESPITE May’s CAD RALLY, our RJO Bullish Sentiment Index of the hot Managed Money positions reportable to the CFTC ACTUALLY FELL FURTHER to a 16% level not seen since Feb 2016. In effect, this managed fund community is FADING the developing uptrend in CAD futures shown in the weekly log scale chart below. AGAINST this developing uptrend in the CAD we believe this bearish exposure that has grown to historic proportions is a source of fuel for potentially huge CAD gains straight away as the market forces this capitulation of this increasingly risky and costly bearish exposure in the contract.
To round out our bearish-USD/bullish-CAD call, the weekly log active-continuation chart of the contract shows that the full year’s decline from May’16’s 0.8025 high to May’17’s 0.7253 low stalled at the exact (0.7250) 61.8% retrace of Jan-May’16’s 0.6809 – 0.8025 rally.
In sum, we believe the past few days’ relapse warns that the recent recovery attempt from 25-May’s 1.3387 low to Fri’s 1.3548 high is a corrective selling opportunity within our broader bearish count introduced in 17-May’s Technical Webcast ahead of further and possibly steep, even relentless USD losses in the weeks and months ahead. Per such a full and aggressive bearish policy remains advised for longer-term players with strength above 1.3548 required to threaten this call and further strength above 1.3650 required to negate it. Shorter-term traders with tighter risk profiles whipsawed out of bearish exposure as a result of 02-Jun’s bullish divergence in short-term mo above 1.3541 are advised to re-established bearish exposure at-the-market (1.3465) with strength above 1.3548 required to negate this call and warrant its cover.


