Technical analysis is one of two core analytical frameworks used by traders to predict the performance of commodities futures. By charting and evaluating peaks, bottoms, trends and various formations, traders can discern patterns and make buy and sell decisions based on this information. By reviewing our curated archive of technical analysis content, you can help ensure that you have the analytical tools necessary to trade with confidence.
Technical Analysis
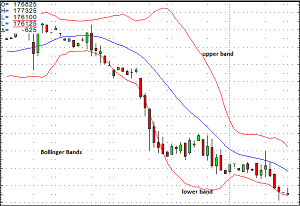
-
Basics of Technical Analysis
For beginning investors, technical analysis may seem somewhat daunting, given the specialized terminology and chart analysis that’s involved. The truth, however, is that virtually anyone can master the basics of technical analysis in a reasonably short time, adding a powerful new tool to their trading repertoire.
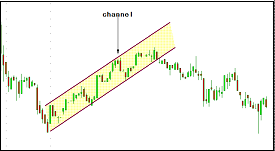
-
Technical Analysis Trading
Technical analysis looks for peaks, bottoms, trends, patterns, and other factors affecting commodity future’s price movement and then makes a buy/sell decision based on those factors. It is a technique many people attempt; though very few are truly successful.
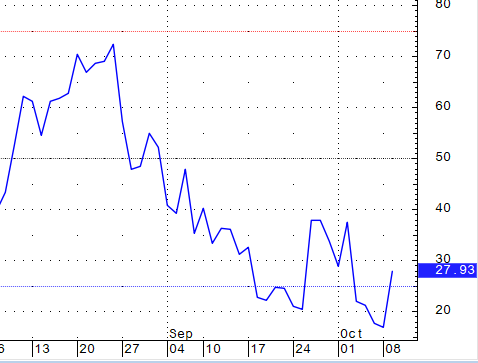
-
Understanding the Relative Strength Index (RSI)
The Relative Strength Index (RSI) is a comparison between the days that the contract finishes up against the days it finishes down. This indicator is a big tool in momentum trading as it can help indicate the strength of a commodity to traders.
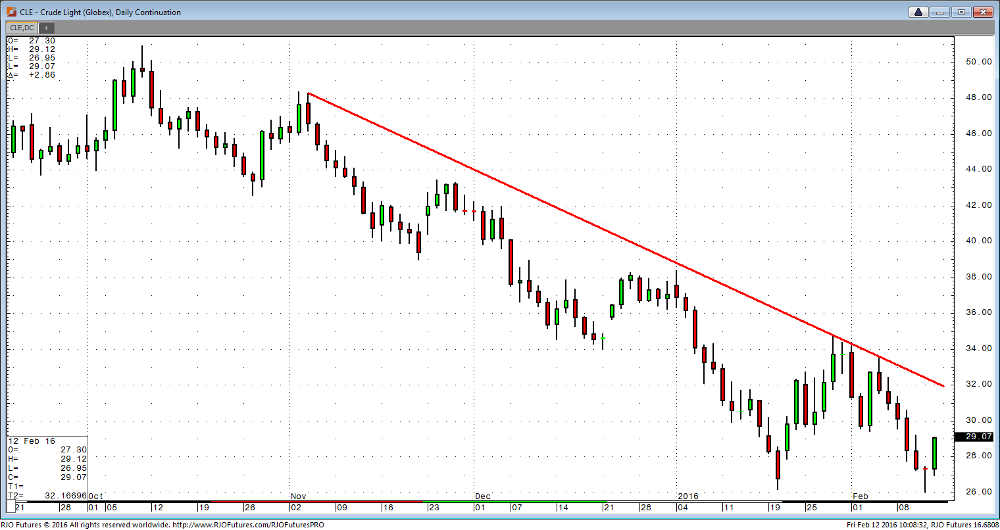
-
Top Three Technical Indicators for Oil Trade
As a trader, it is important to have a good understanding of the basic patterns before you can develop a strategy to give you a potential edge. When you combine a couple of these different methods, you really unlock the power of technical analysis.
-
Commodity Channel Index
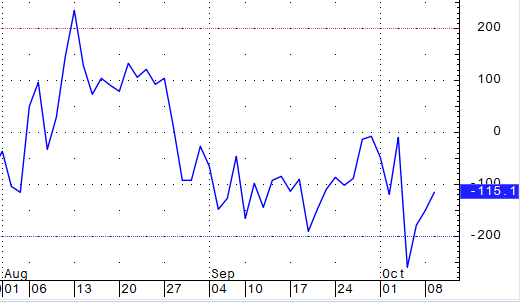
The Commodity Channel Index, or CCI, is a technical trading tool that measures the momentum of a certain investment to help determine if that investment is in danger of being overbought or oversold. The CCI is categorized as a stochastic oscillator because it using oscillating indicators to measure values between two pre-determined values.
-
Gann Chart Analysis
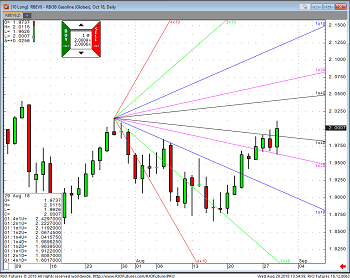
Gann analysis has been used by traders for decades. It is a popular, intricate method for analyzing the direction of a commodity or stock. The basic construction of Gann angles remains the same while some recent changes have become necessary to adjust a few key components in pricing levels and volatility. Gann angles measure pattern, price and time frame.
-
Candlestick Chart Basics
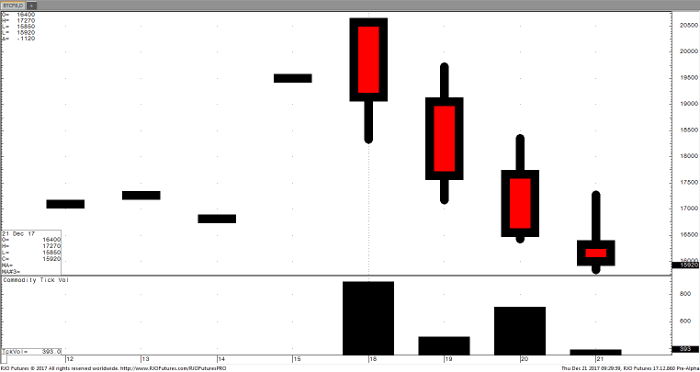
Candlestick charting is a tool of technical analysis and charting which originated in Japan and is now widely used to gauge market sentiments. Unlike western bar charting tool, candlestick charts give traders a better visual interpretation of the high, low, open and close.
-
Pivot Point Trading Technique with Market Volatility
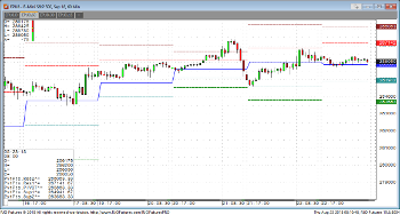
Many markets will experience heightened market volatility, created by market uncertainty. In this environment, many traders find themselves getting chopped up by the violent fluctuations and then becoming reluctant to get back in. One strategy to use when dealing with conditions like this is pivot-trading.
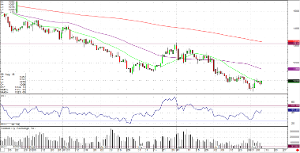
-
Trading with Moving Averages
Moving averages (MA) are one of the oldest and the most popular technical analysis tools. There are different types of moving averages, including simple, exponential, time series, triangular, variable, volume-adjusted, and weighted. You can also calculate a moving average of another moving average. The simple moving average is the most commonly used method.

-
Open Interest, Volume and Your Futures Trading
Open interest refers to the total number of outstanding contracts that have not been settled or offset by delivery. It can also be referred to as open contracts or open commitments. For each buyer of a futures contract there must be a seller. From the time the buyer or seller initiates the trade until the counterparty closes it, that contract is considered “open.”


