JUL COTTON
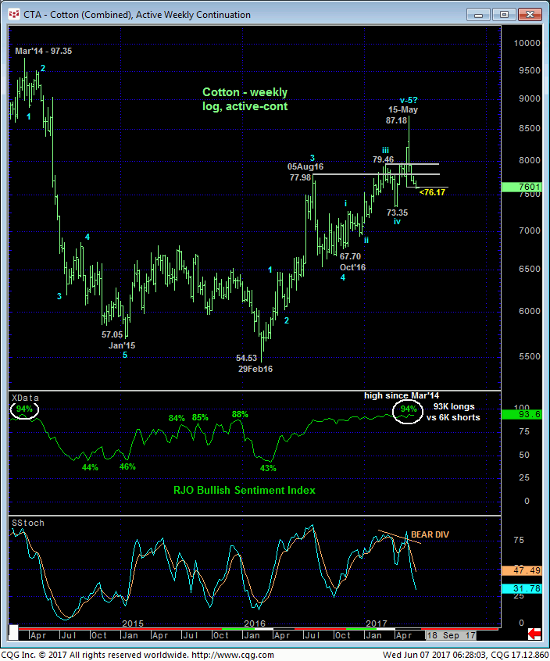
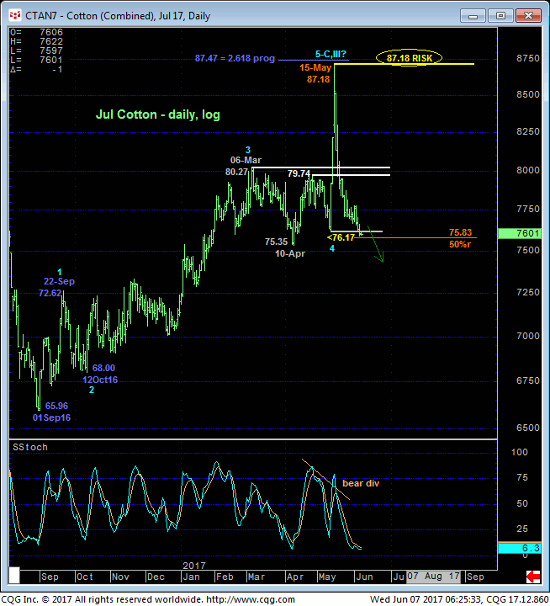
May’s price action in what has been the prompt May contract has been some of the wildest, most volatile in recent memory with the past couple weeks’ gross failure to sustain mid-May’s explosive breakout above a ton of resistance between 79.75 and 80.25 as eventful as the bull’s 3-day spike from 11-May’s 76.17 low to 15-May’s 87.18 high. With yesterday’s failure below 11-May’s 76.17 larger-degree corrective low the market has finally confirmed the bearish divergence in momentum that, in fact, breaks the major uptrend from at least 01Sep16’s 65.96 low and exposes a major correction or reversal lower.
This momentum failure defines 15-May’s 87.18 high as the END of a 5-wave Elliott sequence labeled in the daily log scale chart below. This chart also shows the market having retraced nearly 50% (to 75.83) of Sep’16 – May’15’s entire 65.96 – 87.18 rally. Combined with Apr-May support in the 76.17-to-75.35-range traders should not be surprised by an interim bounce, but only after the market stems the clear and present downtrend with a bullish divergence in short-term momentum.
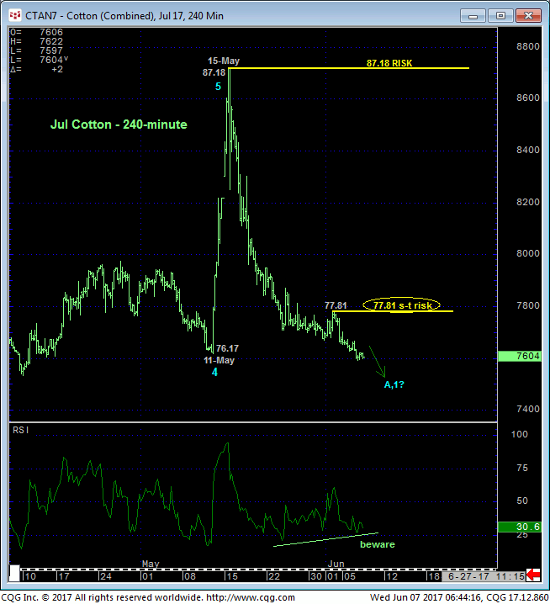
From a short-term perspective the 240-min chart below details the clear and present downtrend with the past couple days’ continuation of this slide leaving Fri’s 77.81 high in its wake as the latest smaller-degree corrective high and short-term risk parameter the market now has to sustain losses below to maintain a more immediate bearish count. Its failure to do so will confirm a bullish divergence in short-term momentum, stem the slide and expose a correction of the past three weeks’ decline that could be relatively extensive given the steep, uninterrupted nature of this recent decline. In lieu of at least such 77.81+ strength, further and possibly accelerated losses should not surprise.
DEC COTTON
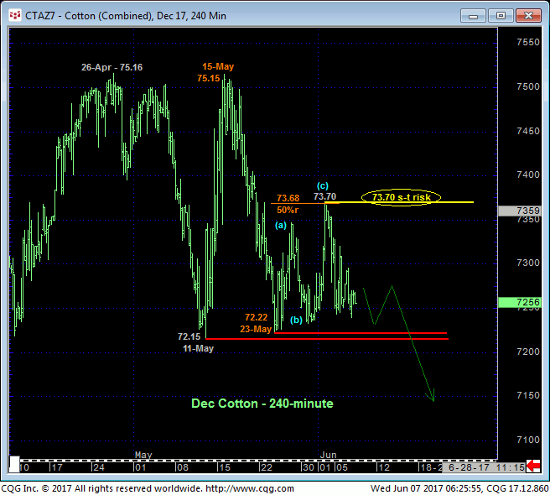
The fact that the soon-to-be-prompt Dec contract failed to incur a mid-May spasm like that particular to the Jul contract leaves the bullish possibility open that all of the price action down from 20-Mar’s 75.72 high is just a (3-wave) correction ahead of a resumption of the secular uptrend. Former 71.50-to-72.00-range resistance from last Sep until early-Feb’s clear and decisive resumption of the secular bull has thus far played its role as new support well for the past two months. 11-May’s 72.15 low marks the lower boundary of this support and the teetering point around which traders can toggle longer-term directional biases and exposure.
IF the relapse attempt from 20-Mar’s 75.72 high is “just” a correction, then we’d expect this general 72.15-area to hold, either outright or after a break below it that the market does not sustain. Conversely, if the past couple months’ price action is that of a broader peak/reversal environment, then we’d expect the market to easily sustain losses below this threshold and even accelerate lower in an increasingly obvious way.
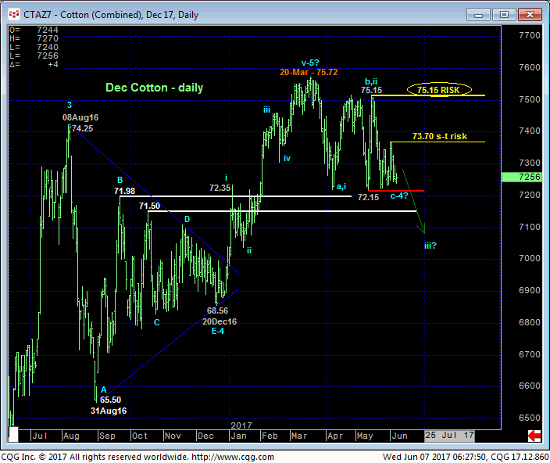
While the market has yet to break the clear support from the 72.15-area, the extent of the past few days’ relapse is important to a bearish count as it renders the recovery attempt from 23-May’s 72.22 low a 3-wave affair as labeled. Left unaltered by strength above 01-Jun’s 73.70 high this 3-wave bounce is considered a corrective/consolidative event ahead of an expected resumption mid-May’s plunge that preceded it. The Fibonacci fact that the late-May/early-Jun recovery attempt stalled at the exact (73.68) 50% retrace of the preceding 75.15 – 72.22 decline would seem to reinforce this bear market correction count. Per such 73.70 is considered our new short-term risk parameter from which non-bullish decisions like long-covers and cautious bearish punts can now be objectively based and managed ahead of a suspected sub-72.15 break that could expose extensive losses.
17-May’s 75.15 larger-degree corrective high serves as our long-term risk parameter the market needs to recoup to resurrect the secular advance.
Finally, we would remind traders of the stubbornly frothy 94% reading in our RJO Bullish Sentiment Index of the hot Managed Money positions reportable to the CFTC. Reflecting 93K long positions to just 6K shorts, this grossly-bullishly-skewed sentiment indicator is considered a huge contributing factor to a peak/reversal environment that could be major in scope, especially now that the market has threatened the major uptrend with a bearish divergence in momentum.
That “gray area” particular to the futures markets resulting from their roll from one contract month to the next must be acknowledged currently however. For while it is clear that the Jul contract has confirmed a momentum failure on a WEEKLY basis, a clear break below 72.15 in the Dec contract remains arguably required to break its longer-term uptrend. Per such flexibility to either directional fallout is advised with adherence to last week’s shorter-term risk parameter at 73.70.
These issues considered, a bearish policy is advised in the Jul contract with a recovery above 77.81 required to negate this call and warrant its cover. Given the Dec contract’s current position at the extreme lower recesses of the past month’s range however where the risk/reward merits of initiating bearish exposure are poor, traders are advised to wait for either an intra-7.15-to-73.70-range pop to, say, the 73.25 level OB to take a punt from the short side and/or a break below 72.15, with a recovery above 73.70 required to negate this call and warrant its cover. A break below 11-May’s 72.15 pivotal low and arguably this market’s single most important technical level and condition could expose steep losses immediately thereafter.
