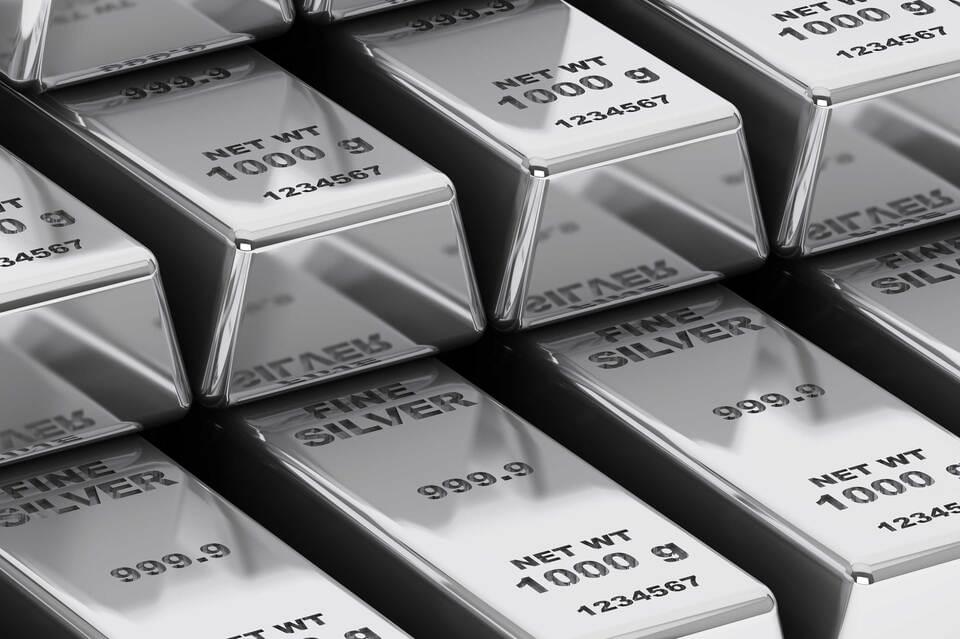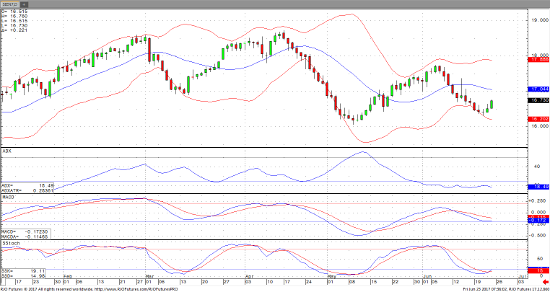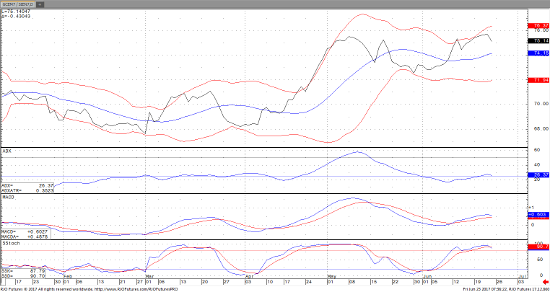
The downward washout that occurred over the past 2 weeks looks like it may be coming to an end and a possible upward sloping double bottom has formed. Silver imports in China have stepped up significantly year over year and could be the start of a new move. I would expect commentary from FED speakers to become more dovish going forward with the economy weakening and the interest rate hikes 2/3 complete this year. If you take a look at the daily silver chart keep an eye on the ADX which measures the strength of the trend. Currently the downward trend is weakening which could mean sideways to higher action lays ahead. The other chart to keep an eye on is the Gold/Silver ratio. Currently trading at 75 ounces of silver to 1 ounce of gold. This is historically high could be set for a correction with silver gaining on gold.
Jul ’17 Silver Daily Chart

Jul ’17 Silver vs. Aug ’17 Gold


