In our technical analysis workshops for clients we discuss navigating the three types of markets that exist: trending, consolidation within those trends, and reversals. If there’s such a thing as easy money or at least easier money in trading, it’s during nice, flowing, trending markets. The other two environments- consolidation and reversal processes-that we estimate occur about 2/3rds of the time are typically characterized by aimless, lateral, choppy, frustrating price action where the odds of winning trading decisions fall.
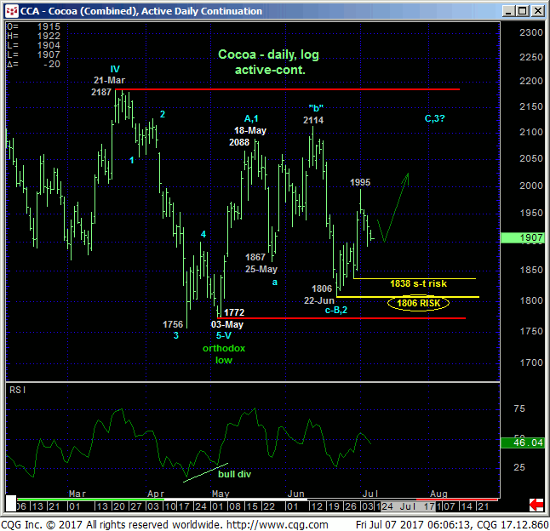
Only a glance at the past four months’ price action in the daily log scale chart below is needed to see that this cocoa market is obviously not trending. We don’t know if this price action is merely consolidative ahead of the secular bear trend’s resumption or part of a broader base/reversal environment, but it is definitely not trending. And under such environments we emphasize to traders:
- such environments are simply a fact of trading life
- odds of winning trading decisions plunge, so a more conservative approach to risk assumption is warranted
- require and wait for preferred/favorable risk/reward conditions to take a lower-risk directional punt, which typical stems from the lower- or upper-quarter of the range at hand.
On the one hand, the past few days’ slip from the middle of the 2187 – 1772-range is not surprising for lateral, consolidation environments. On the other hand late-Jun’s recovery from the extreme lower recesses of the 4-month range could be an early indication of a broader base/reversal environment that, if correct, would expose considerable gains in the weeks or even months ahead.

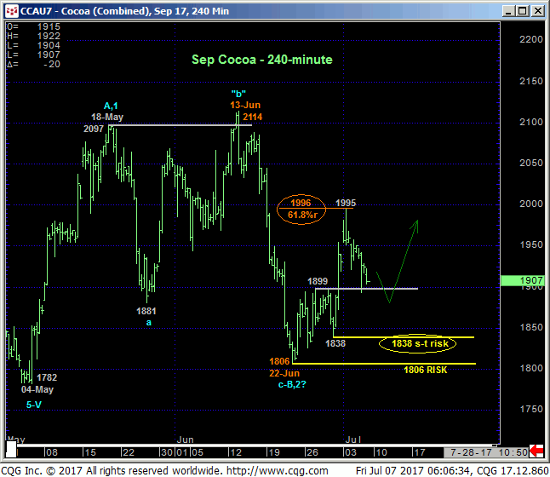
With 30-Jun’s “breakout” above 27-Jun’s 1899 initial count-trend high, the market has, in fact, confirmed at least the intermediate-term trend as up. This important by-product of this technical fact is the market’s definition of 29-Jun’s 1838 low as THE latest smaller-degree corrective low and new short-term risk parameter the bear now has to break below to squelch any broader bullish count, render the recovery from 22-Jun’s 1806 low a 3-wave and thus corrective affair and re-expose Jun’s 2114 – 1806 downtrend that preceded it.
30-Jun’s breakout also leaves former 1899-area resistance as new near-term support that we’d expect to hold IF something bigger to the bull side lies ahead. This also presents an objective and favorable risk/reward buying opportunity from the 1900-area with protective sell-stops just below 1838. A threat to this very specific bullish count stems from the Fibonacci fact that this latest rebound attempts stalled at the exact (1996) 61.8% retrace of Jun’s 2114 – 1806 decline.


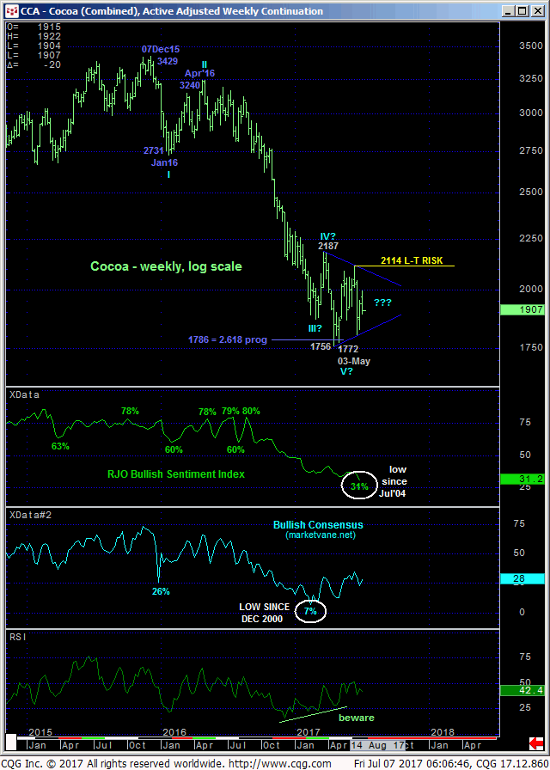
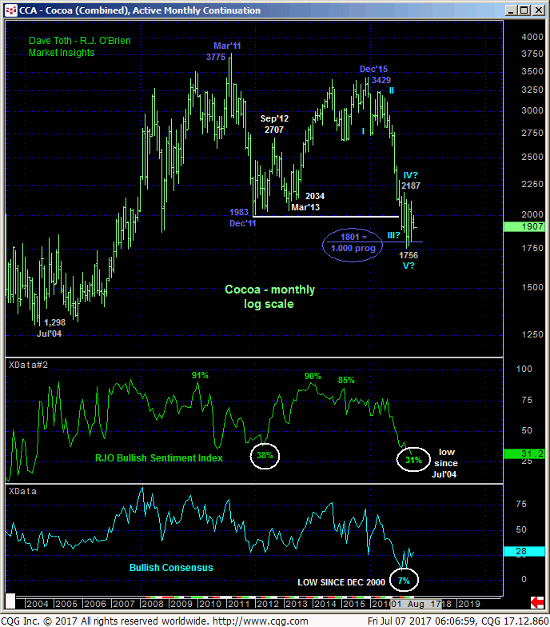
From a very long-term perspective shown in the weekly (above) and monthly (below) log scale charts there’s no question that the secular downtrend has slowed. But since the market has yet to recoup either a prior corrective high on this scale or an initial counter-trend high, it would be premature to conclude 03-May’s 1772 as the end of a 5-wave Elliott sequence from Dec’15’s 3429 high. It’s possible that this major downtrend is over. Sure. But a break above 13-Jun’s 2114 high is MINIMALLY required to confirm a bullish divergence in momentum on this broader scale. Per such we are forced to consider EITHER the bear market consolidation environment OR the broader base/reversal process.
Understandably, market sentiment levels have been bludgeoned to historically low, pessimistic levels typical of major base/reversal environments. But traders are reminded that sentiment is not an applicable technical tool in the absence of a confirmed bullish (in this case) divergence in momentum of a SCALE SUFFICIENT to break the major downtrend. Herein lies the importance of identifying a long-term risk parameter like 2114.
These issues considered, a cautiously bullish policy from 1900 OB is advised with a failure below 1838 negating this call and raising the odds that the recovery attempt from 03-May’s 1772 low is consolidative ahead of an eventual resumption of the secular bear trend. Conversely, a recovery above Mon’s 1995 high will tilt the longer-term directional scales higher and expose a run at the upper recesses of the 4-month range or beyond. In effect we believe 1995 and 1838 define this market’s key directional triggers heading forward.


