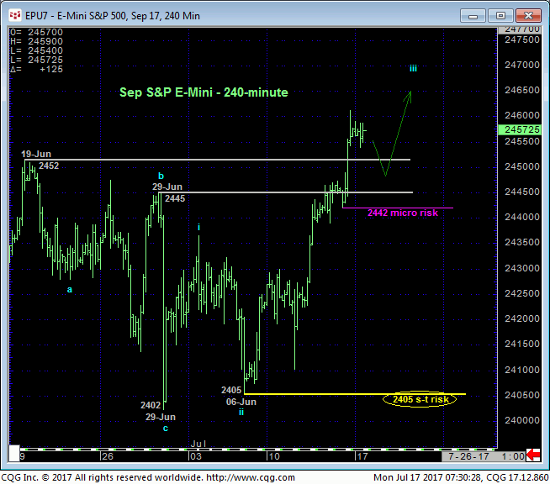
Fri’s break above the mid-to-late-Jun resistance range of 2445-to-2452 reaffirms the secular bull market and leaves recent corrective lows in its wake at 2442 and 2405 that the market is expected to sustain gains above to maintain a more immediate bullish count. Given the magnitude of the secular uptrend however, these corrective lows serve only as micro- and short-term risk parameters from which shorter-term traders with tighter risk profiles can objectively rebase and manage the risk of a still-advised bullish policy. Short-term traders are reminded however that the benefit of using such short-term risk parameters comes at the cost/exchange for whipsaw risk.
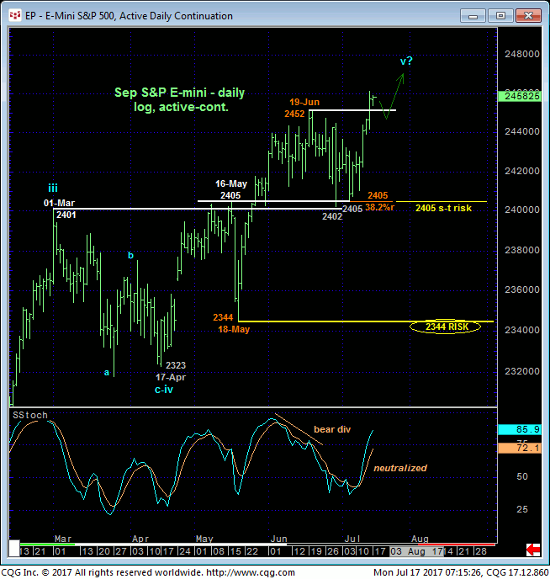
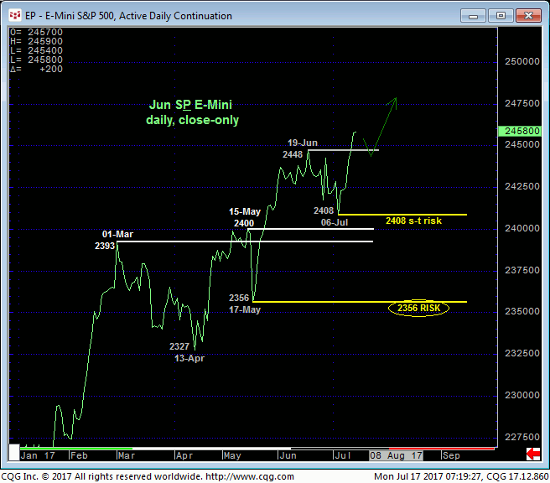
Last week’s resumption of the secular bull hardly came as a surprise as the Jun/early-Jul’s corrective relapse attempt held exactly at the 2405–to-2401-area of former resistance-turned-support and 38.2% retrace we would have expected it to within the context of a very orderly and major advance shown in both the daily log chart above and daily close-only chart below. 06-Jul’s 2405 intra-day low and/or that day’s 2408 close serve as our short-term risk parameters this market is MINIMALLY required to fail below to even defer, let alone threaten the major advance.
Indeed, by breaking to yet another new all-time high the market has exposed an area above the market that is virtually devoid of any technical levels of merit. In effect there is no resistance with ALL technical levels of merit now existing only below the market in the form of former 2445-to-2450-area resistance-turned-support and prior corrective lows like 2442 (micro) and 2405 (tight). Merely “derived” technical levels like Bollinger Bands, channel lines and even the vaunted Fibonacci progression relationships we cite often in our analysis never have proven to be reliable reasons to conclude resistance (or support) in such cases without an accompanying bearish divergence in momentum. And they NEVER will.
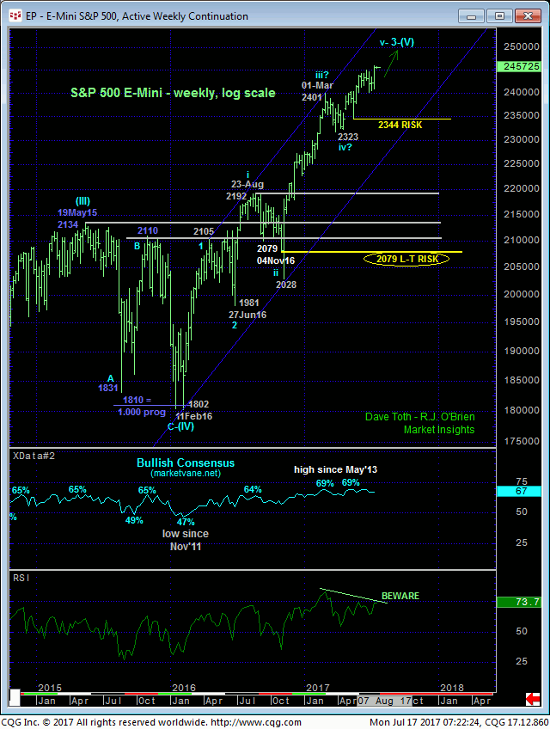
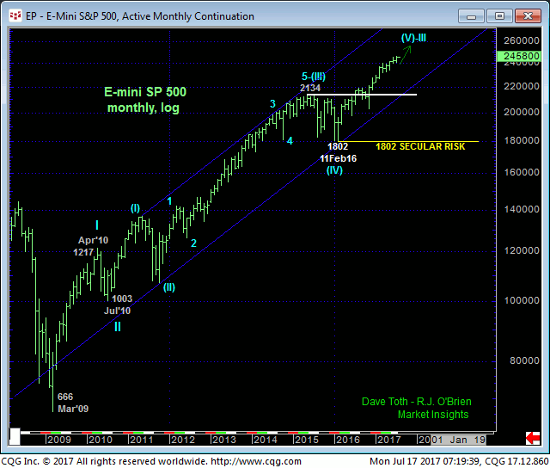
Might the rally from 17-Apr’s 2323 low be the completing 5th-Wave of a prospective 3rd-Wave rally from Jun’16’s 1981 low on a weekly log scale basis above? Yeah, sure. BUT ONLY PROOF of weakness below corrective lows like 2405 and preferably 18-May’s larger-degree corrective low and key risk parameter at 2344 will suffice in raising the odds of and then confirming such a count. Alternatively, for those trying to “pick” a 5th-Wave top “somewhere in here”, there is NO objective level or risk parameter above the market one can site that will negate such a bearish call.
In sum, the trend is once again UP ON ALL SCALES and should not surprise by its continuance or acceleration. A full and aggressive bullish policy and exposure remain advised with weakness below at least 2442 and preferably 2405 required to defer or threaten this call. Former 2450-to-2445-area resistance is expected to provide new support ahead of further and potentially steep gains to levels indeterminately higher.
