AUG GOLD
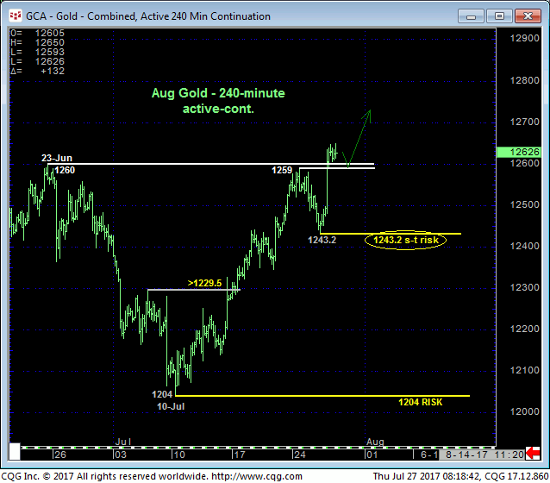
Yesterday and overnight’s break above Mon’s 1259 high AND 23-Jun’s 1260 high obviously leaves yesterday’s 1243.2 low in its wake as the latest smaller-degree corrective low and short-term risk parameter from which a cautious bullish policy discussed in 14-Jul’s Technical Webcast can be objectively rebased and managed. But this relatively minor, intra-range strength also cannot be overlooked as having potentially long-term bullish implications.
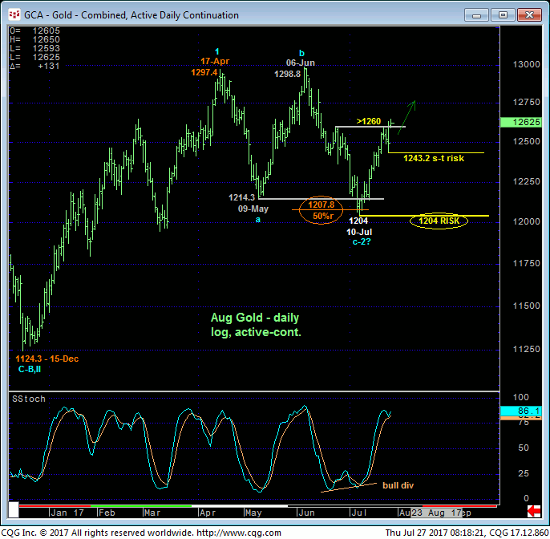
From a longer-term perspective the impulsive nature of the past couple weeks’ recovery above 23-Jun’s 1260 high not only breaks Jun-Jul’s downtrend, it exposes the price action from 17-Apr’s 1297.4 high as a 3-wave affair as labeled in the daily log scale chart above. Left unaltered by a relapse below 10-Jul’s 1204 low and approximate 50% retrace of Dec-Apr’s 1124 – 1297 rally, this 3-wave sell-off attempt may be considered a corrective/consolidative structure that warns of a resumption of the major uptrend that preceded it. In this regard that 1204 low is considered our new long-term risk parameter to a resumed and major bullish policy.
Apr-Jul’s 3-wave, 50% retracement is also crystal clear on a weekly log close-only basis below and we believe warns of what could be a dramatic, accelerated 3rd-Wave rally immediate ahead. This weekly chart also shows the market still stuck deep within the middle-half bowels of the past YEAR’S trading range where we never want to underestimate the odds of aimless whipsaw risk. Herein lies the importance of identifying tight but objective risk parameters like 1243.2 and even 10-Jul’s 1204 low.
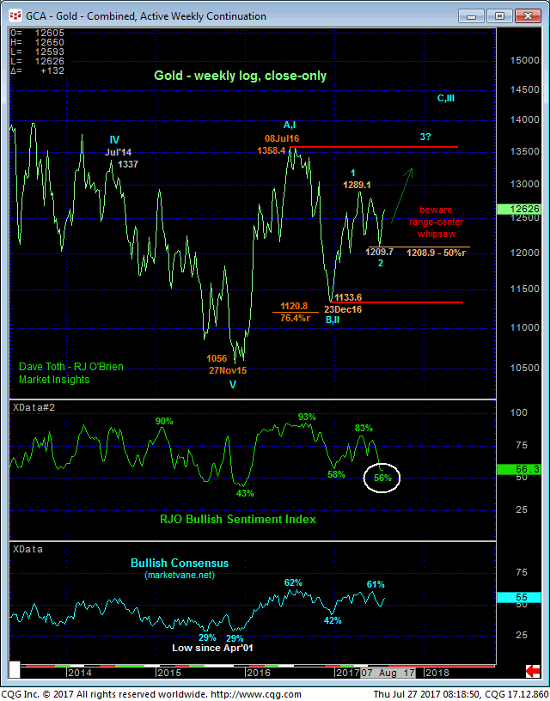
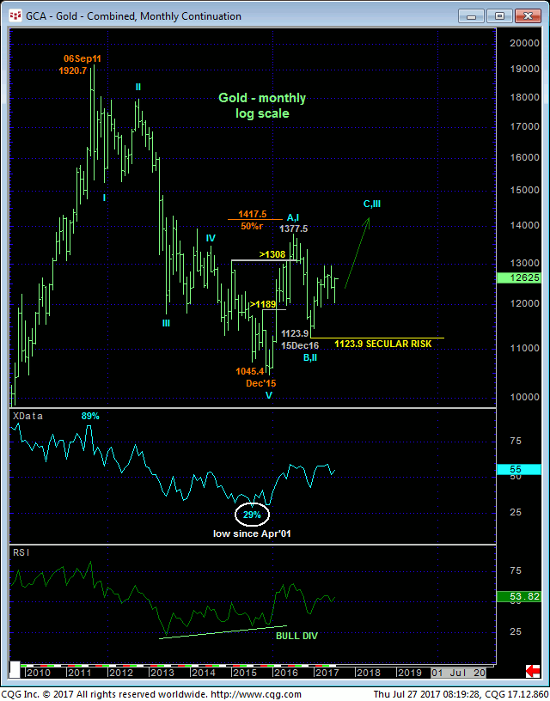
Traders are reminded that from an even longer-term perspective, the extent and impulsiveness of early-2016’s rally defines Dec’15’s 1045 low as THE END of the secular bear market from Sep’11’s 1920 all-time high and start of a base/reversal PROCESS that we believe will be major in scope, spanning quarters or even years ahead. The not unexpected extensive relapse from Jul’16’s 1377 high to Dec’16’s 1123 low is considered the B- or 2nd-Wave correction within this reversal process that now warns of a C- or 3rd-Wave rally to levels potentially well above 2016’s 1377 initial counter-trend high. This rally MAY have begun as a result of the extent and impulsiveness of the past couple weeks’ rally.
These issues considered, shorter-term traders are advised to maintain or establish a cautious bullish policy with a failure below 1243 required to defer or threaten this call enough to warrant a return to the sidelines. Longer-term players are advised to move to a new bullish policy from the 1260 level OB with a failure below 1243 required to pare this exposure to more conservative levels and subsequent weakness below 1204 to negate the call altogether. In lieu of such weakness we anticipate further and possibly accelerated gains with former 1260-area resistance considered new near-term support.
SEP COPPER
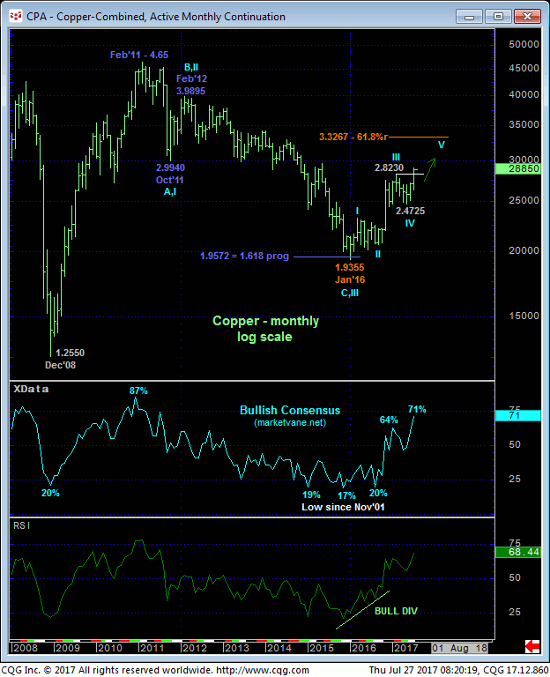
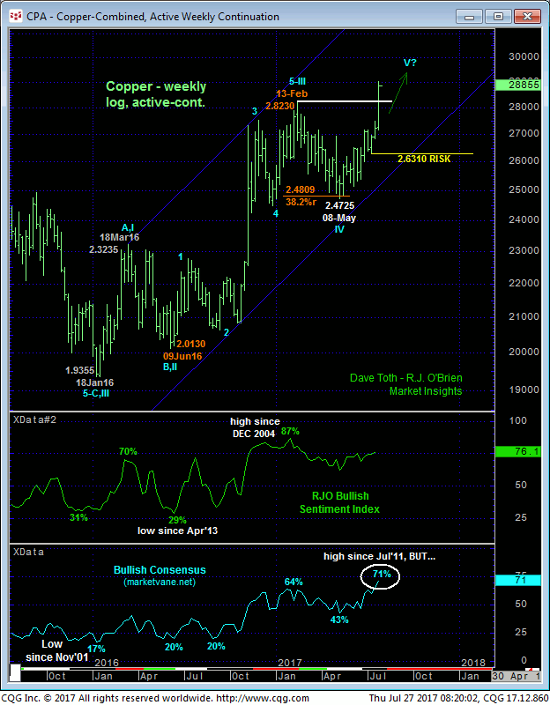
Only a glance at the monthly (above) and weekly (below) log scale charts is needed to see that the major trend is up and should not surprise by its continuance as a part of the major reversal of the secular bear market from Feb’11’s 4.65 all-time high to Jan’16’s 1.9355 low.
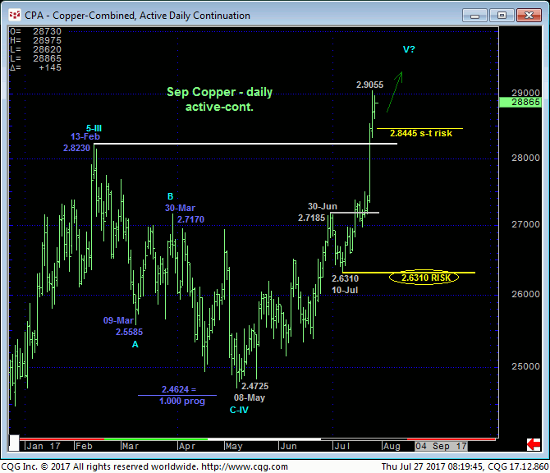
The daily chart above shows not only the clear and present uptrend, but an uptrend that has ACCELERATED over the past couple weeks following a couple months of base-building. Such accelerated trends typically have to slow down before they reverse, and this is evidenced by corrective setback attempts and subsequent resumptions of the trend.
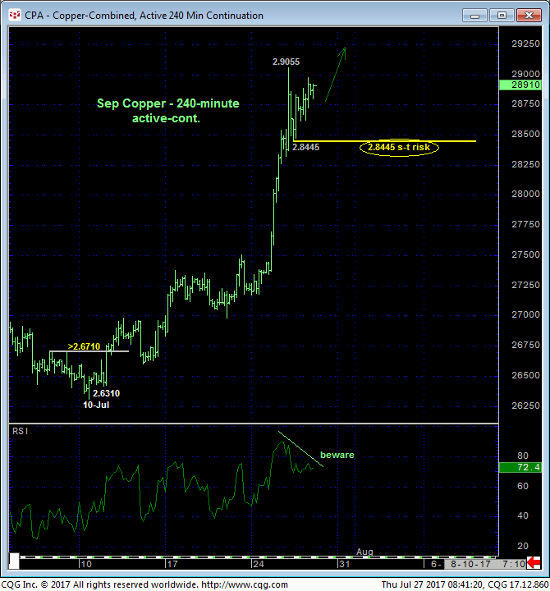
On a short-term basis detailed in the 240-min chart below, the POTENTIAL for a bearish divergence in momentum is developing, BUT ONLY PROOF of weakness below yesterday’s 2.8445 minor corrective low will CONFIRM this divergence to the point of non-bullish action like long-covers by shorter-term traders with tighter risk profiles. In lieu of such sub-2.8445 weakness the trend is up on all scales and expected to continue. Per such a full and aggressive bullish policy and exposure remain advised with protective sell-stops trailed to just below 2.8445. The market’s upside potential is indeterminable.
