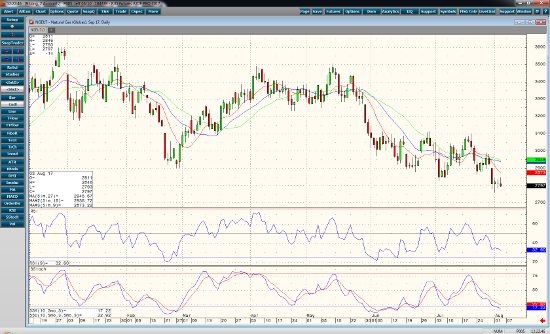
The trend in September natural gas is still down. Resistance is at 2.900 –2.850. Support comes in around 2.75. Our target objective is 2.67 -2.70. The breakout beneath July’s consolidation on a daily chart may signal a sell off below 2.70. A close above 2.90 will change the trend to new higher range.
Momentum studies are moving lower, and the 9, 18, and 27 period moving averages are also trending lower, which could signal more downside action. Today’s storage number came in at an increase 20 bcf, almost the expected 23 bcf, while the 5 year average is 44 bcf injection. Our inventory of gas surplus is still 4% above the average as well. Below normal temperatures are predicted over the next two weeks and could hold for as long as Mid-August. With no real cooling demand, gas should struggle to gain any ground. COT is not at record highs, but still shows a sizable number longs that might contribute to selloff should standing stop orders get hit. Position yourself with exposure to the down side of the market. Bear put spreads or outright shorts are something to consider until the market closes above a corrective high.
Sep ’17 Nat Gas Daily Chart


