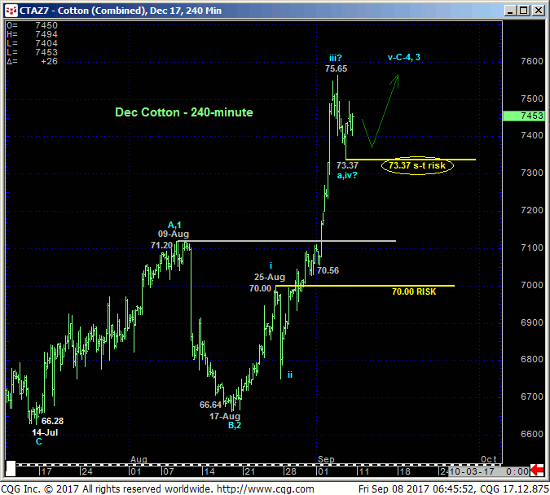
In our day-to-day technical analysis and client workshops we stress momentum as a very valuable technical as trends typically slow down via consolidation before ultimately reversing following a failed new high. In the 240-min chart below, late-Aug/early-Sep’s rally looks to be an accelerated (3rd-wave-type) component to the clear and present uptrend that we believe requires some slow-down behavior ahead of at least one more round of new highs before it becomes vulnerable to a peak/reversal threat.
Since the market has yet to breach Wed’s 75.65 high, it would be premature to conclude yesterday’s 73.37 low as the END of a correction ahead of a resumption of the current uptrend. By virtue of overnight’s rebound however, that 73.37 low can be used as a very tight but objective bull risk parameter for shorter-term traders as it breach would confirm at least the intermediate-term trend as down and reinforce Wed’s 75.65 high as one of importance and a more reliable risk parameter from which non-bullish decisions like long-covers could then be objectively based and managed.


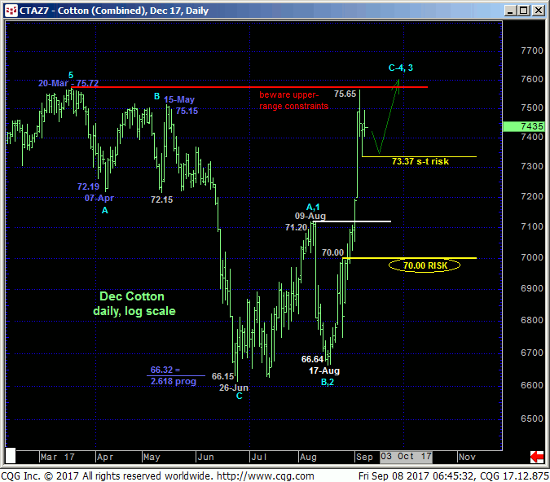
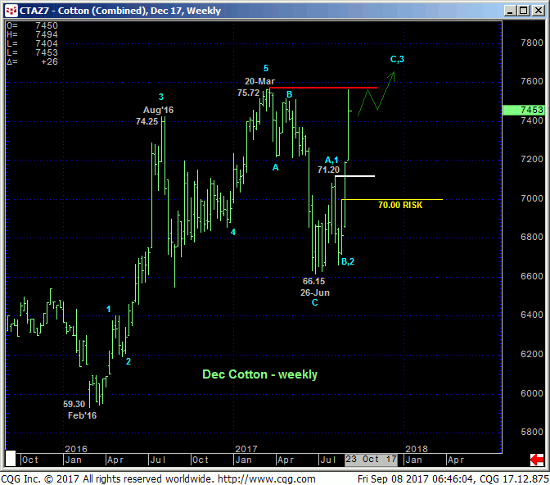
This tight but objective risk parameter at 73.37 may come in handy given the Dec contract’s close proximity to its 2017 high at 75.72 from 20-Mar. IF the past three weeks’ Harvey-resulting rally is a temporary fluke, then the extreme upper recesses of this year’s range in the Dec contract cannot be ignored as a resistance candidate for the entire world’s collective trading decisions to acknowledge. Given the extent and impulsiveness of this rally however and, we believe, and incomplete wave sequence higher, a bullish bias remains advised until this market fails below at least 73.37.

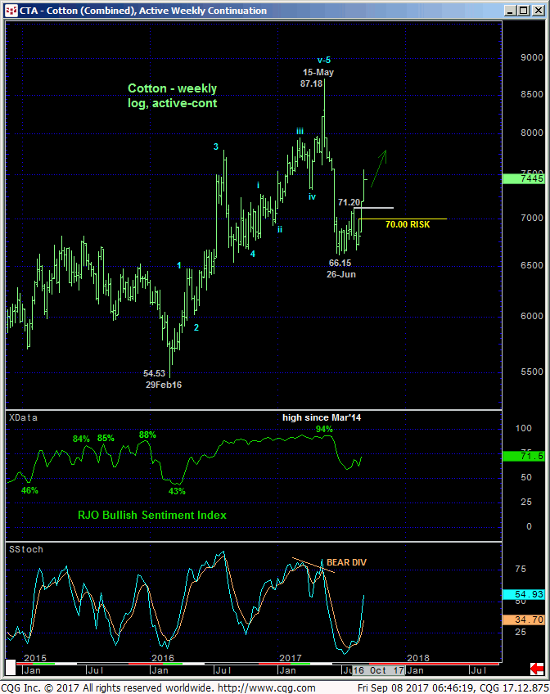
Another factor to consider on the bullish side is what this market looks like from an active-continuation chart perspective shown in the weekly log scale chart below. This perspective shows NO levels of any technical pertinence between spot and May’s 87.18 high since the market busted out above 71.20. To nullify a bullish count non this basis the market would have to prove commensurately larger-degree weakness below 25-Aug’s 70.00 minor 1st-Wave high and area just below former early-Aug 71.20-area resistance-turned-support.
The scale challenge- and this is typical after sharp, 3rd-wave-type moves like early-Sep’s that saw no battlegrounds that can now be approached as support- is that there’s a wide gap between a short-term risk parameter like 73.37 and a long-term one like 70.00. Attention and adherence to technical and trading SCALE is vital under such circumstances where we prefer whipsaw risk by exiting longs “early” below 73.37 to bigger nominal risk below a level like 70.00.
These issues considered, a bullish policy remains advised for longer-term players with a failure below 70.00 required to negate this call. A bullish policy remains advised for shorter-term decision-makers also, with a failure below 73.37 sufficient to pare or neutralize this exposure in order to circumvent the depths unknown of either just an interim whipsaw correction or a more significant reversal lower. Longer-term players can also use this 73.37 level as a risk parameter to pare some of their bullish exposure to more conservative levels in exchange for whipsaw risk.


