Investors have gained confidence that OPEC will be able to help curb the global supply leaving crude oil up over 9% on the month. The rally was initially fueled by the International Energy Agency upward revision on demand outlook. The futures value began to factor in this re-balance at the start of the quarter, leaving prices up by 14.5% putting it at the highest level since April. It is expected for global demand to rise 1.6 million barrels per day. While hedge funds and traders have been betting U.S. shale production would increase, causing the price to sell off. A recent push through $52 has sparked a short covering rally, and bearish bets could continue to unwind. The one thing to watch out for is U.S. producers locking in higher prices and hedging at these levels.
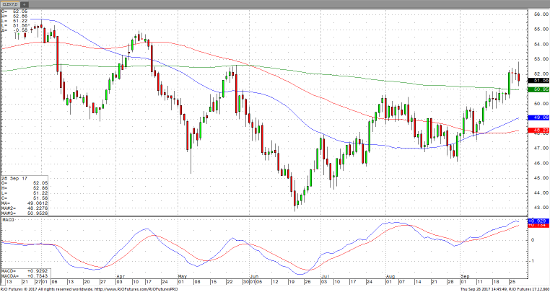
Below is a November daily chart of crude oil, where you can see that it has clearly entered into a bull market. I would back that opinion unless we have 2 consecutive closes below $50.
Nov ’17 Crude Light Daily Chart


