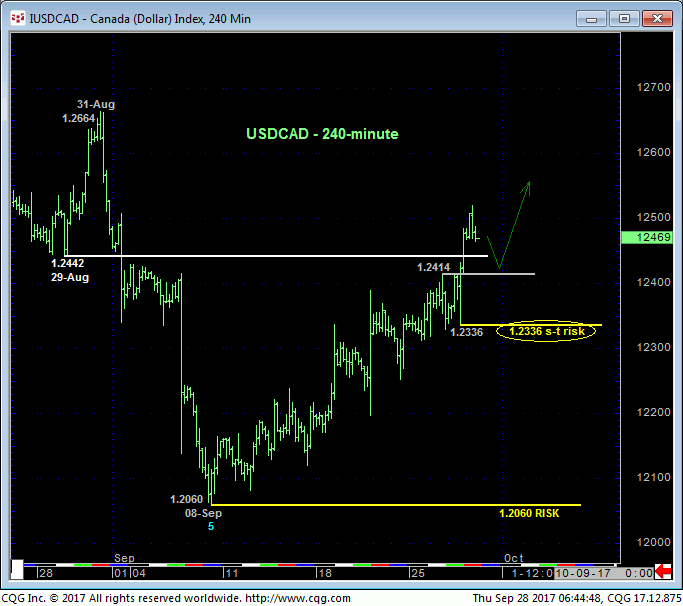
In recent updates we have discussed what we believe to be significant base/reversal prospects for the USD Index, what could be surprising, if intra-LT-range gains in USDJPY and major peak/reversal threats in EURUSD and GBPUSD. The USDCAD’s failure yesterday to sustain early-Sep losses below what we believe is a pivotal lower-1.24-handle-area exposes this market to the same and potentially major bullish-USD story.
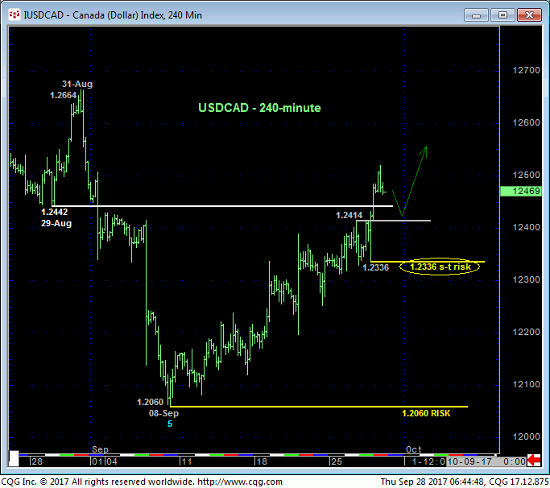
The 240-min chart above shows this month’s methodical, stair-stepping uptrend that, as a result of yesterday’s continuation, leaves yesterday’s 1.2336 low in its wake as the latest smaller-degree corrective low and new short-term risk parameter this market is now minimally required to fail below to stem the rally and expose at least an interim corrective setback. We’ll circle around as to the importance of this tight but objective risk parameter within what we believe is a broader base/reversal PROCESS that could provide a preferred risk/reward buying opportunity in the weeks ahead and from lower levels after the market gets this initial (suspected A- or 1st-Wave) rally out of the way.
While this month’s recovery remains within the realm of a prospective (bear market) correction relative to the magnitude of May-Sep’s major decline, the market’s failure to sustain early-Sep losses below an obvious former support-turned-resistance area around the lower-1.24-handle threatens such a call and warns that 08-Sep’s 1.2060 low COMPLETED the 5-wave Elliott sequence from 05-May’s 1.3794 high as labeled. Per such 1.2060 is considered our new long-term risk parameter from which all non-bearish decisions like short-covers and new bullish punts can be objectively based and managed.
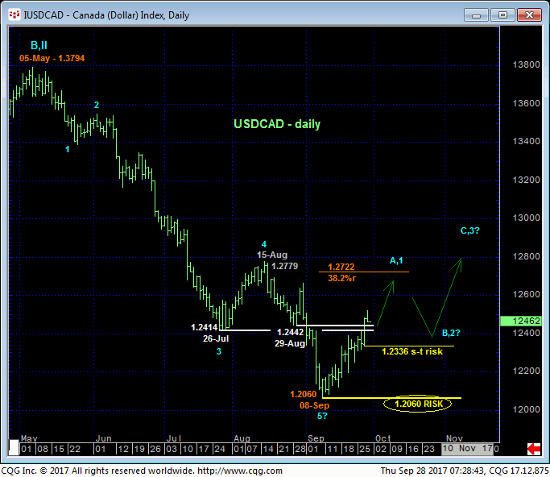
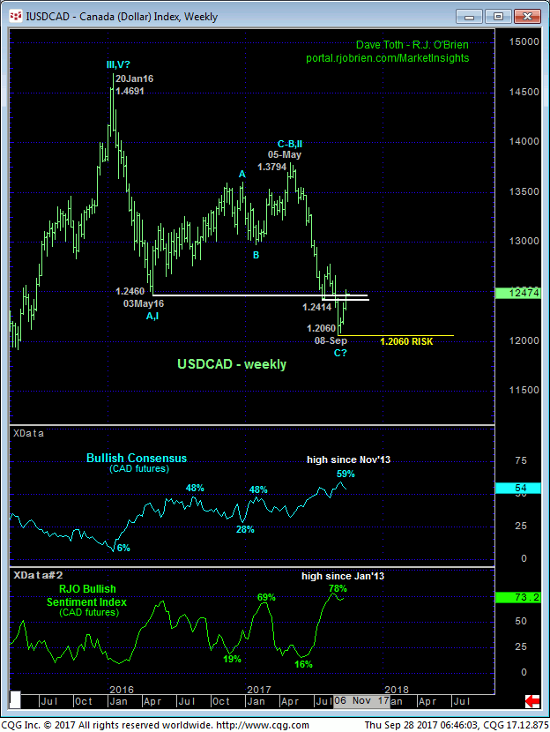
The weekly chart of USDCAD above shows the importance of the 1.24-handle that dates from May’16’s 1.2460 low and was reinforced by late-Jul and late-Aug’s lows and support. This month’s earlier break below this area, producing the lowest levels in over two years and new lows for a 20-MONTH bear trend, left this 1.24-handle as a new and key resistance candidate that should have contained corrections within a broader bearish count. This week’s continued USD gains are the initial threat to such a bearish count and suggests the best risk/reward directional play is no longer with the bear.
Contributing mightily to a major base/reversal count in USDCAD and PEAK/reversal count in the CAD futures contract is the historically bullish sentiment recently accorded the CAD. At recent 78% and 59% highs respectively, our RJO Bullish Sentiment Index and Bullish Consensus (marketvane.net) have reached their highest, most bullish levels since Jan’13 and Nov’13, a period and environment that warned of and accompanied extensive CAD losses.
Such bullishness is of no matter as long as the uptrend remains intact. The extent and impulsiveness of the past few weeks’ decline in the contract certainly threatens the May-Sep uptrend and warns of potentially extensive losses ahead.
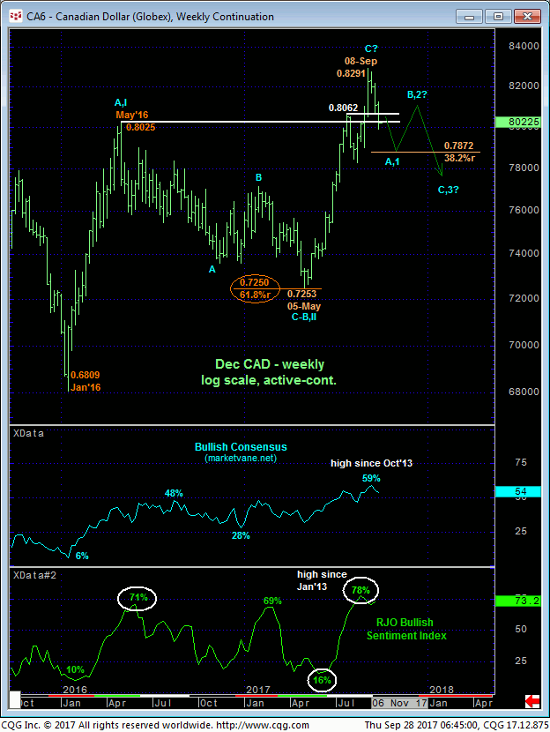
The monthly active-continuation chart of the contract below the recent 78% high in the RJO BSI and the last time (Jan’13) this indicator tickled this level and condition. The subsequent collapse was steep and relentless. Additionally, this chart also shows the market’s rejection thus far of the immediate area around the (0.8264) 38.2% retrace of 2011-2016’s entire 1.0618 – 0.6809 decline after what is thus far only a 3-wave recovery from that Jan’16 low. Might this 20-month recovery be a complete 3-wave correction ahead of the secular bear market’s resumption to sub-0.6809 levels??? It’s obviously grossly premature to conclude anything this outlandish. But until and unless this market recoups this month’s 0.8291 high in the contract and fails below 1.2060 in the cash, it would also be short-side to ignore such a prospect.
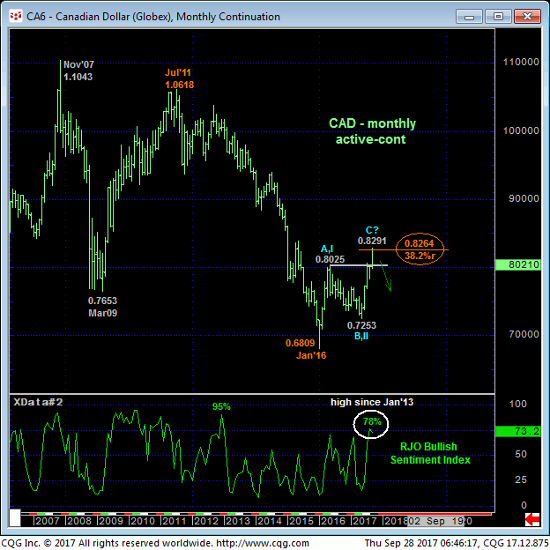
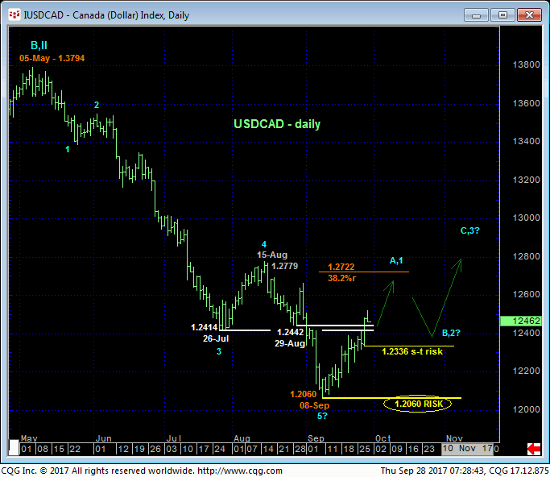
As navigating major base/reversal environments is often times a matter of SCALE, traders should be aware that INITIAL (A- or 1st-wave) counter-trend recoveries to major downtrends are typically countered, and often times EXTENSIVELY, by a (B- or 2nd-wave) correction within a major base/reversal PROCESS. This is why “chasing” bullish (in this case) exposure on the initial counter-trend rally is so risky and warrants a tight but objective risk parameter like yesterday’s 1.2336 low.
There’s never any way to know the extent of such an initial (A- or 1st-Wave) counter-trend rally. The current uptrend could easily continue or even accelerate to levels indeterminably higher. It is a fact that at least the intermediate-term trend is up and that a failure below 1.2336 is required to negate it. New cautious bullish exposure from suspected resistance-turned-support from the 1.2420-area OB is quite OK with protective sell-stops below 1.2335. Somewhere along the line however- and this could be from levels far higher than current 1.2460-area prices- traders should not be surprised by a more extensive corrective relapse that could provide an preferred and outstanding risk/reward buying opportunity for the long haul, with a failure below 1.2060 (above 0.8291 in the contract) required to negate this call.
In sum, a cautious bullish policy and exposure from 1.2420 OB is advised with a failure below 1.2335 required to negate this specific call, expose an interim correction and what we believe will be a preferred risk/reward buying opportunity from a 1.22-handle. In lieu of at least such sub-1.2335 weakness further and possibly steep, accelerated gains should not surprise.
