USD INDEX
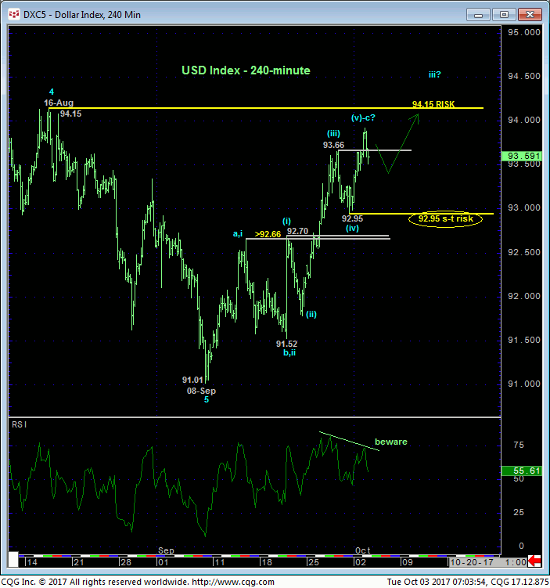
Overnight’s break above Thur’s 93.66 high reaffirms the developing recovery and potential base/reversal from 08-Sep’s 91.01 low and leaves Fri’s 92.95 low in its wake as the latest smaller-degree corrective low it’s now required to sustain gains above to maintain a more immediate bullish count. Its failure to do so will confirm a bearish divergence in short-term momentum, stem the rally and possibly chalk the recovery up as a 3-wave and thus corrective affair within this year’s major downtrend. In this regard 92.95 is considered our new short-term risk parameter from which one can objectively rebase and manage the risk of cautious bullish exposure.
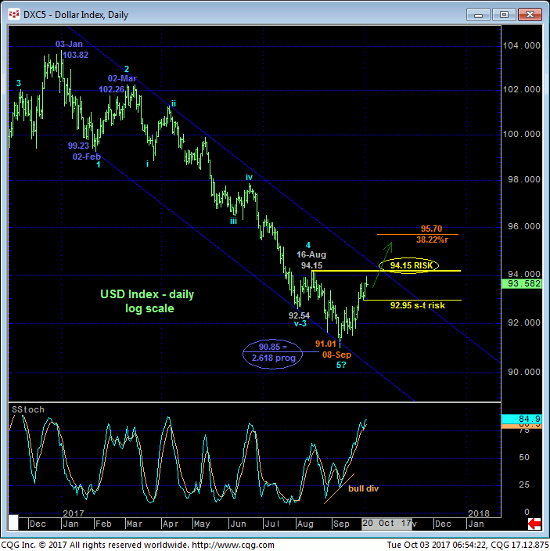
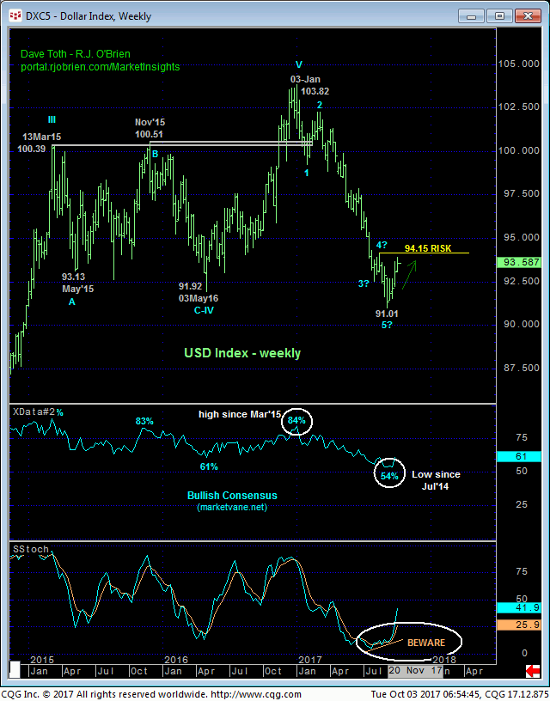
The daily (above) and weekly (below) charts show the market’s encroachment on 16-Aug’s larger-degree corrective high and key risk parameter it needs to stay below to avoid confirming a bullish divergence in WEEKLY momentum that would reinforce our long-term base/reversal premise that contends that 08-Sep’s 91.01 low COMPLETED a major 5-wave Elliott sequence down from the year’s 03-Jan high of 103.82. The recent 54% reading in the Bullish Consensus (marketvane.net) measure of market sentiment- its lowest level in three years- would seem to reinforce such a base/reversal-threat environment.
In sum, a bullish policy and exposure from 92.50 OB recommended in 21-Sep’s Trading Strategies Blog remain advised for shorter-term traders with a failure below 92.94 required to defer or threaten this call enough to warrant moving to the sidelines temporarily. Longer-term players are advised to maintain a cautious bullish stance with a failure below 91.00 required to negate this call with a break above 94.15 reinforcing this bullish call and exposing potentially extensive gains thereafter.
EURUSD
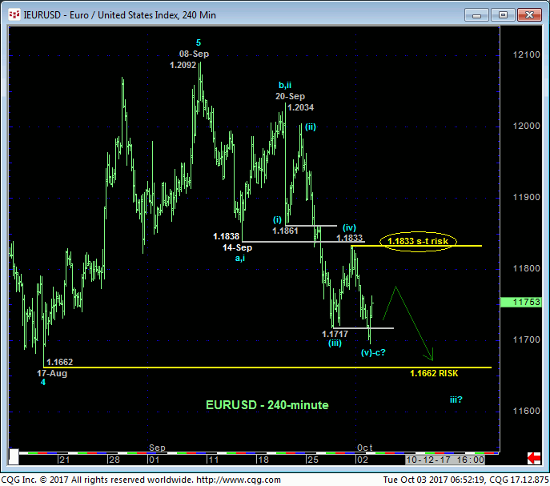
Similarly but inversely, overnight’s break below last week’s 1.1717 low reaffirms the developing downtrend and leaves Fri’s 1.1833 high in its wake as the latest smaller-degree corrective high and new short-term risk parameter this market is now minimally required to recoup to even defer, let alone threaten what we believe is a developing peak/reversal environment that could be major in scope.
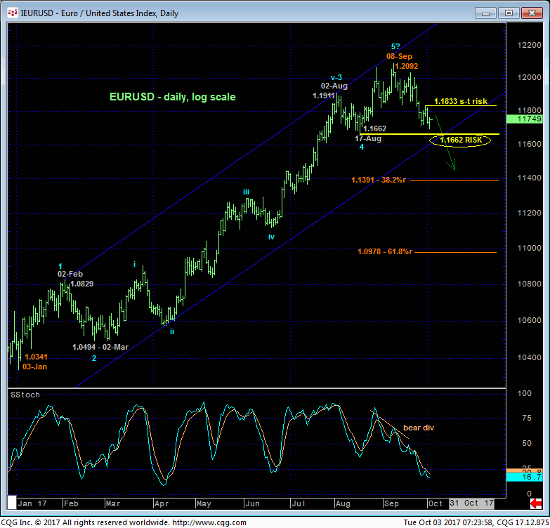
The daily log scale chart below shows the market’s encroachment on 17-Aug’s 1.1662 next larger-degree corrective low that the market needs to break to, in fact, break this year’s major uptrend. As labeled, we believe 08-Sep’s 1.2092 high may be considered the END of a major 5-wave Elliott sequence up from 03-Jan’s 1.0341 low. If this is correct and the market’s in the early stages of a correction of an 8-month, 14.5% rally, we could easily see a 3-to-5-month correction lower. And given that this year’s rebound might just be the initial counter-trend rally to a 9-YEAR secular bear market, a “more extensive” B- or 2nd-wave correction that retraces 61.8% or more of this rally could produce rates back below 1.10 over the course of 3-to-5-months.
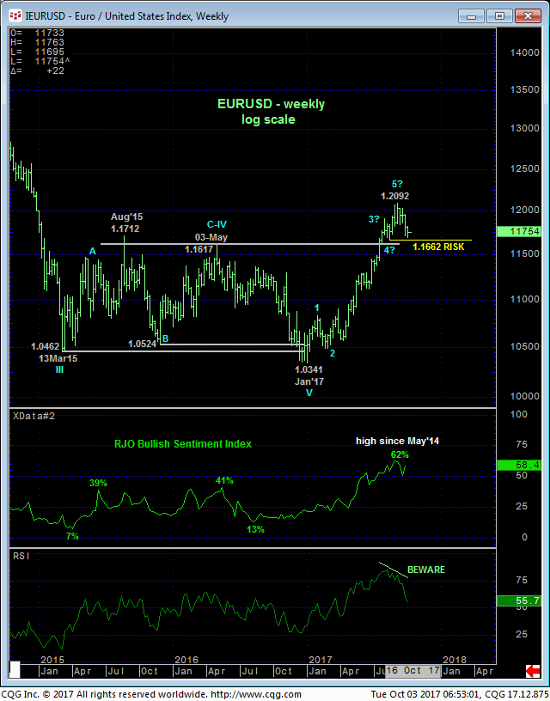
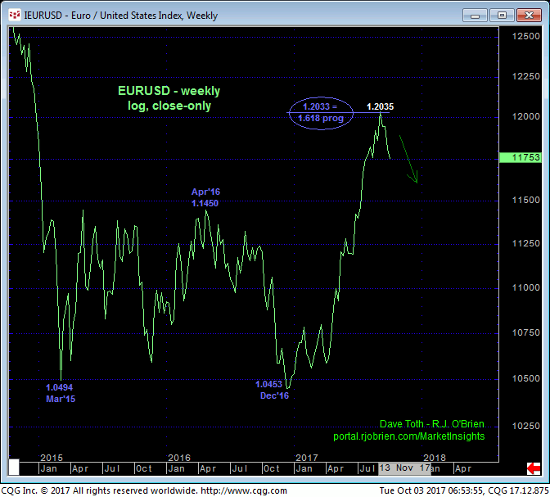
Waning upside momentum on a WEEKLY basis above amidst the most bullish sentiment accorded the Euro in over three years contributes to a peak/reversal count that could be major in scope. The Fibonacci fact that this year’s rally spanned a length exactly 1.618-time that of Mar’15 – Apr’16’s preceding rally from 1.0494 to 1.1450 on a weekly log close-only basis below provides yet another technical reason to be leery of a broader correction or reversal lower.
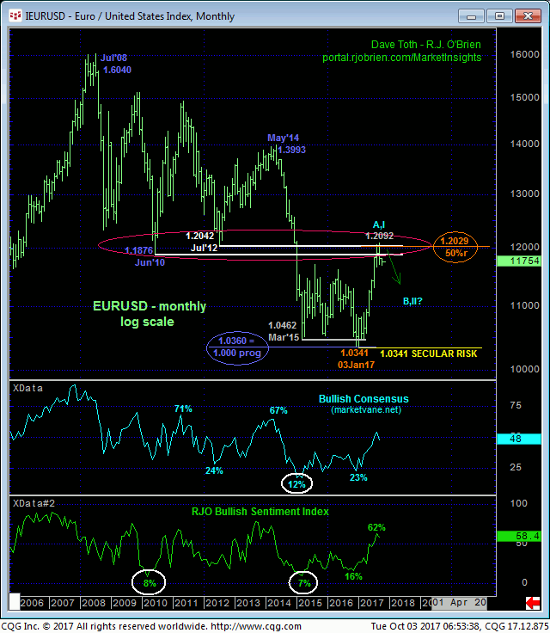
Finally and perhaps most indictingly, the monthly log scale chart below shows the magnitude of the 1.19-to-1.20-area that supported this market for YEARS before Jan’15’s meltdown through it that left it as a new and major resistance candidate. We discussed this prospective resistance weeks before the market encountered it. And now that the market has thus far rejected it, it’s hard to ignore the other facts cited above as those contributing to a major peak/reversal condition.
These issues considered, a bearish policy and exposure from 1.1850 OB recommended in 25-Sep’s Trading Strategies Blog remain advised with strength above 1.1833 required to defer this call enough to warrant a move to the sidelines for a preferred risk/reward sale down the road. Further weakness below 1.1662 will reinforce this peak/reversal count that we believe could result in months of weakness to the 1.10-area or lower.
GBPUSD
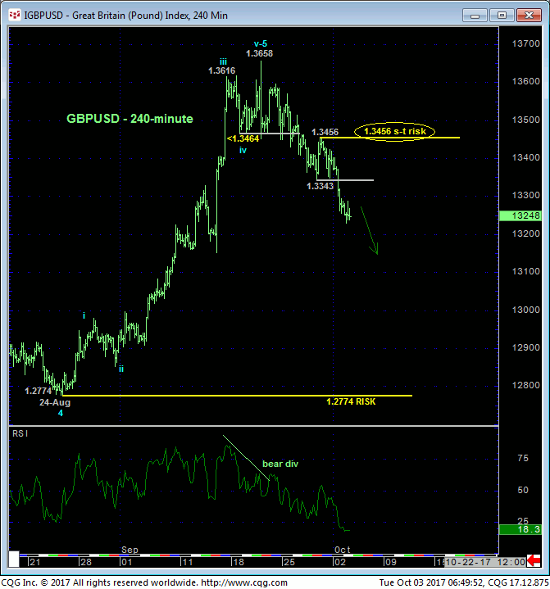
This week’s continued slide below last week’s 1.3343 low reaffirms the developing downtrend and leaves Fri’s 1.3456 high in its wake as the latest smaller-degree corrective high this market now needs to sustain losses below to maintain a more immediate bearish count. Its failure to do so won’t necessarily negate our longer-term peak/reversal count introduced in 20-Sep’s Technical Webcast, but it would defer or threaten it enough to warrant moving to the sidelines, at least temporarily. In this regard 1.3456 is considered our new short-term risk parameter from which this recommended bearish policy can be effectively rebased and managed.
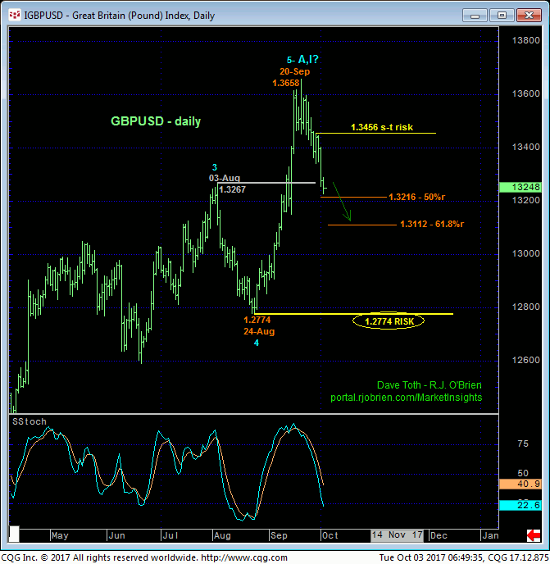
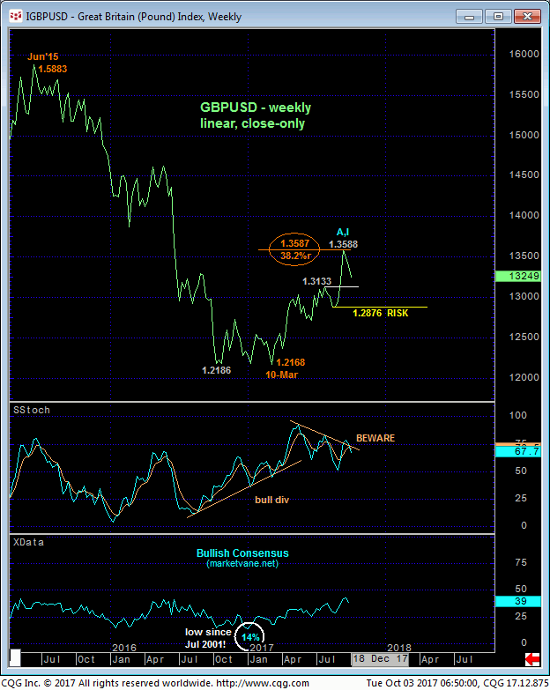
Relative to this year’s broader uptrend the past couple weeks’ relapse still easily falls within the bounds of a mere bear market correction, with a failure below 24-Aug’s 1.2774 next larger-degree corrective low still required to, in fact, break this year’s uptrend. Waning upside momentum on a WEEKLY close-only basis below and from the exact (1.3587) 38.2% retrace of 2015-17’s decline from 1.5883 to 1.2168 cannot be ignored however as contributors to a broader peak/reversal count.
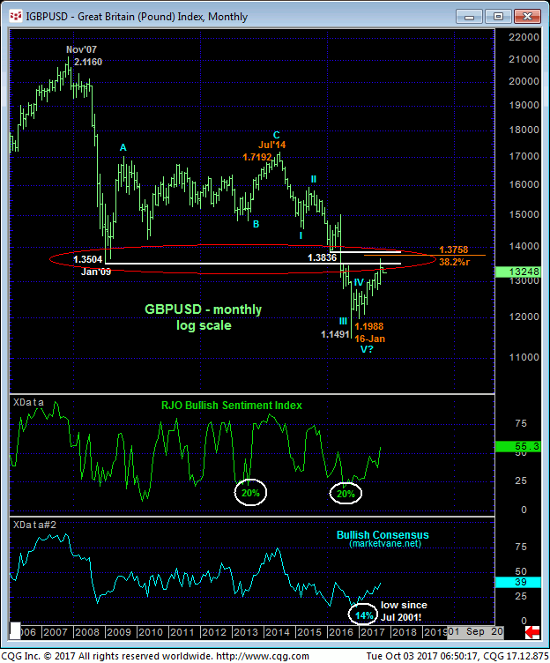
Finally and similarly to the 1.19/1.20-area in the Euro, the monthly log scale chart below shows that the 1.35-to-1.38-area in cable supported it for years before Jun’16’s breakdown below it, leaving it as a huge new resistance candidate. While the rejection of this area thus far only spans a couple weeks, the ancillary evidence of USD strength cited throughout this entire blog must be considered as contributing to a peal/reversal count in cable. Finally, 1.3758 defines the 38.2% retrace of the entire bear trend from Jul’14’s 1.7192 high to Jan’16’s 1.1988 orthodox low. 20-Sep’s high was 1.3658.
These issues considered, a bearish policy and exposure remain advised with a recovery above 1.3456 required to defer or threaten this call enough to warrant its cover. In lieu of such 1.3456+ strength we anticipate further and possibly extensive losses that could span months.
