DEC 10-Yr T-NOTES
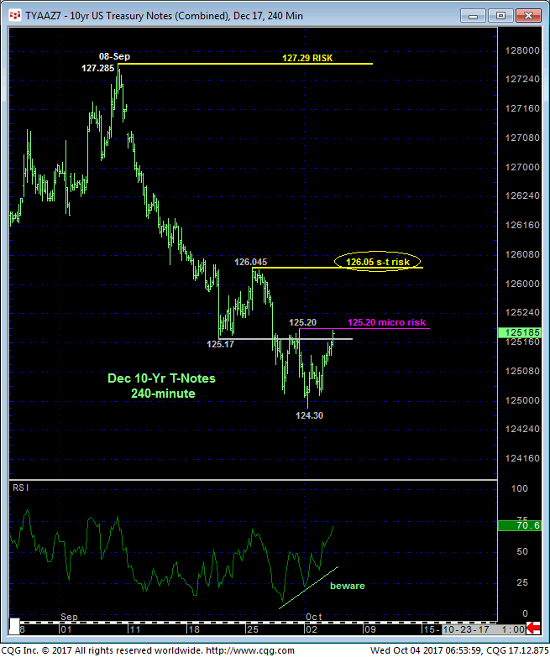
Only a glance at the 240-min chart below is needed to see that the RATE of descent over the past week-and-a-half has slowed with yesterday and overnight’s recovery now pressuring Fri’s 125.20 minor corrective high and area of former 125.17-area support from 21-Sep that is now considered a new resistance area. 25-Sep’s 126.045 corrective high remains intact as our short-term risk parameter the market’s still required to recoup to break the broader downtrend from 08-Sep’s 127.285 high. But for longer-term range reasons we’ll address below, traders are advised to move to a more conservative approach to risk assumption of pare or neutralize bearish exposure on proof of even micro strength above a level like 125.20.
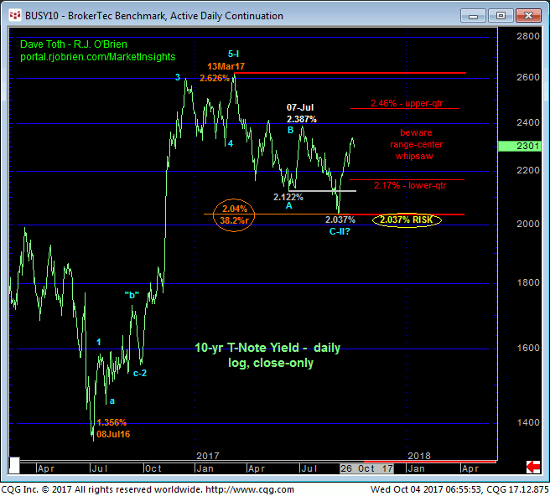
Jumping to a long-term daily log close-only perspective of 10-yr yields, the chart below shows the market’s return to the middle of the middle-half of this year’s 2.62% – 2.03%-range where we believe the odds of aimless whipsaw risk and volatile, choppy price action are higher. We maintain a very long-term bearish view that 2016-17’s rate hike is just the INITIAL 1st-Wave of a new secular move higher in rates that could span a generation.
The rate relapse from 13Mar17’s 2.626% high is considered a correction/consolidation within such a long-term count. It is indeterminable at this juncture whether 07-Sep’s 2.037% low COMPLETED this correction or merely the first part of it ahead of further and potentially extensive lateral chop for months or even quarters ahead. And the market’s current position smack in the middle of this range presents an extraordinarily poor risk/reward condition from which to make a directional bet either way. Per such a much more conservative approach to risk assumption is urged as we believe the odds of losing trading decisions are even higher than they normally are.
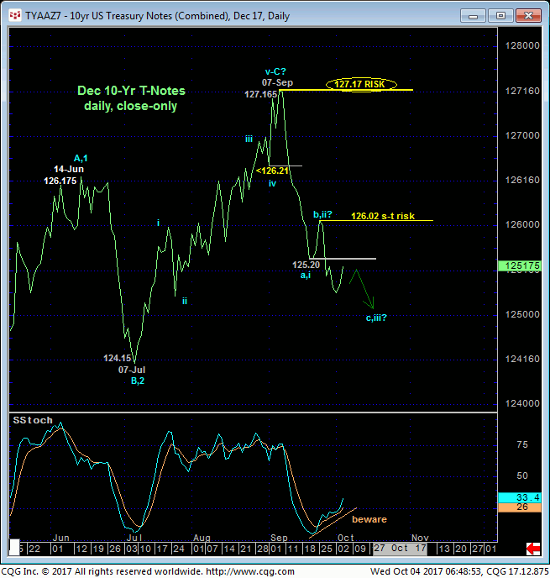
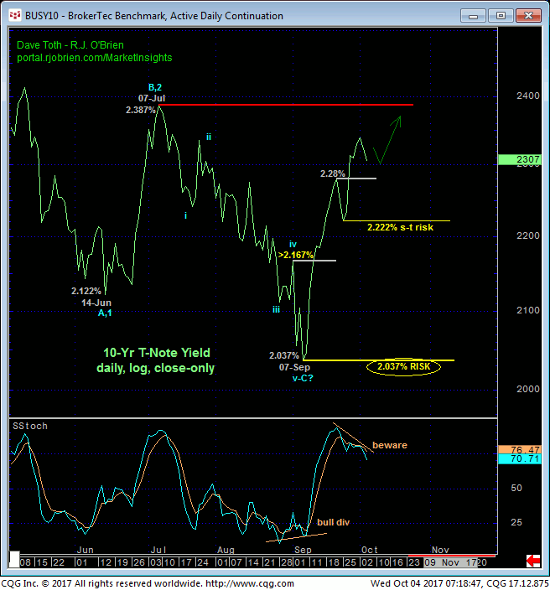
We’ve advocated a cautious bearish policy (in the contract) since 13-Sep’s bullish divergence in mo above 01-Sep’s 2.167% corrective high in 10-yr rates shown in daily log close-only chart below. As a result of the market’s return to the middle of this year’s range however, traders are advised to reduce risk assumption on this policy by tightening protective buy-stops to 125.21 in the contract. A recovery above 125.20 won;t necessarily break the broader downtrend from 127.285, but we believe this is a situation where it’ll be better being out, wishin’ you were in, than in, wishin’ you were out.
In sum, a bearish policy and exposure in the Dec contract remains advised with a recovery above 125.20 threatening this call enough to warrant it cover and move to a neutral/sideline position.
JUN18 EURODOLLARS
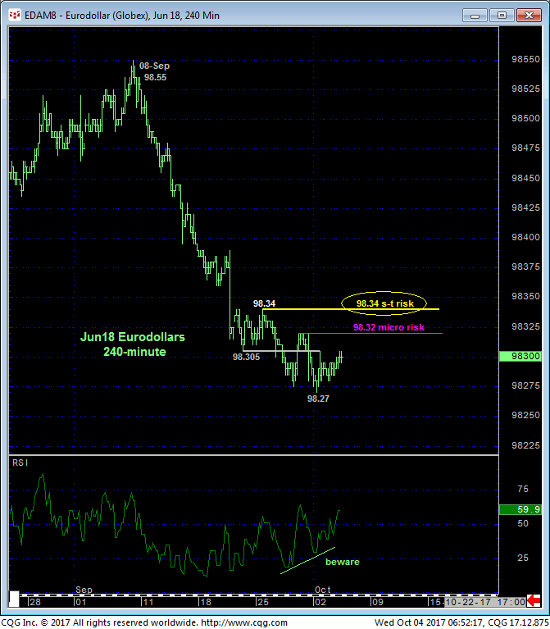
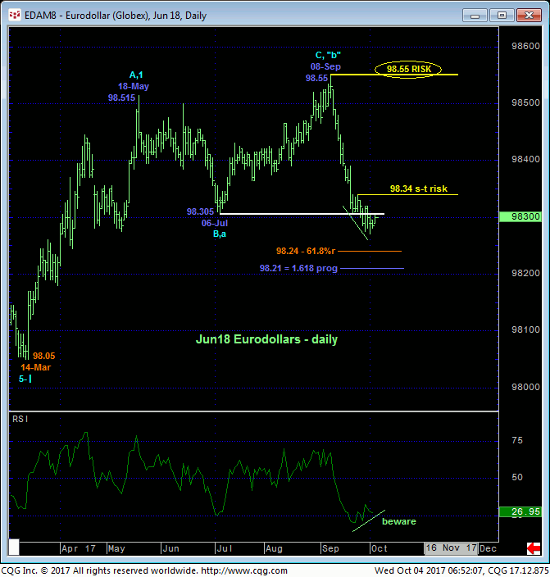
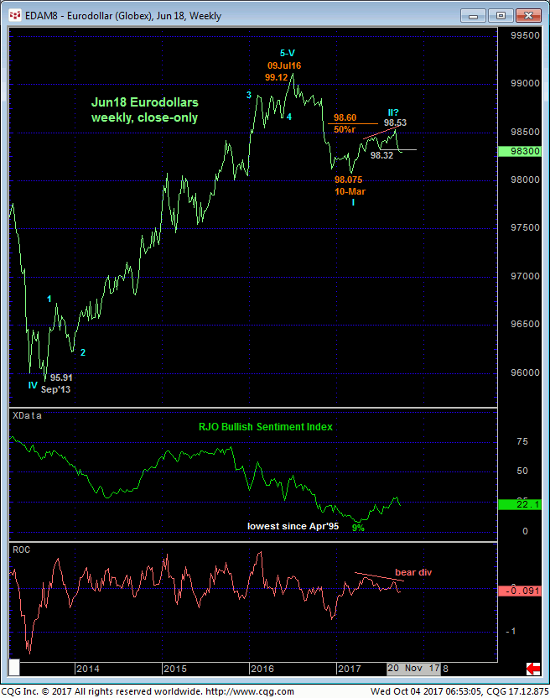
The technical construct and expectations for the Jun Eurodollar contract are virtually identical to those details above for T-notes with a recovery above Fri’s 98.32 minor corrective high and micro risk parameter threatening this call enough to warrant moving to a neutral/sideline position. In lieu of at least such 98.32+ strength the trend remains down on all practical scales and should not surprise by its continuance.
