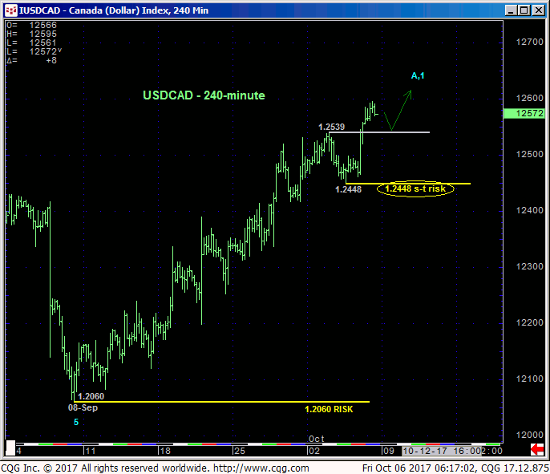
USDCAD
Yesterday’s continued uptrend above Tue’s 1.2539 high reaffirms our major base/reversal count introduced in 21-Sep’s Technical Webcast and leaves Wed’s 1.2448 low in its wake as the latest smaller-degree corrective low this market must now sustain gains above to maintain a more immediate bullish count. Its failure to do so would confirm a bearish divergence in momentum, stem the rally from 08-Sep’s 1.2060 low and expose an interim correction lower within what we believe is a base/reversal environment that could be major in scope. In this regard 1.2448 is considered our new short-term risk parameter from which a bullish policy and exposure can be objectively rebased and managed by shorter-term traders.
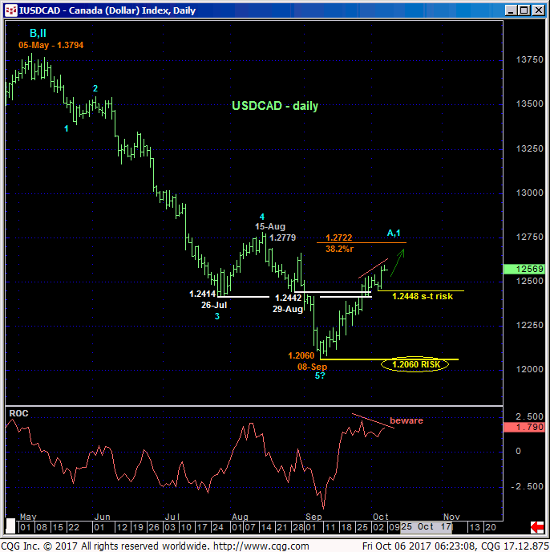
The daily chart of USDCAD above shows the developing POTENTIAL for a bearish divergence in momentum, but only a failure below 1.2448 will CONFIRM this divergence to the point of non-bullish action like long-covers. In lieu of such the new long-term trend is arguably up and warns of further and possibly accelerated gains straight away.
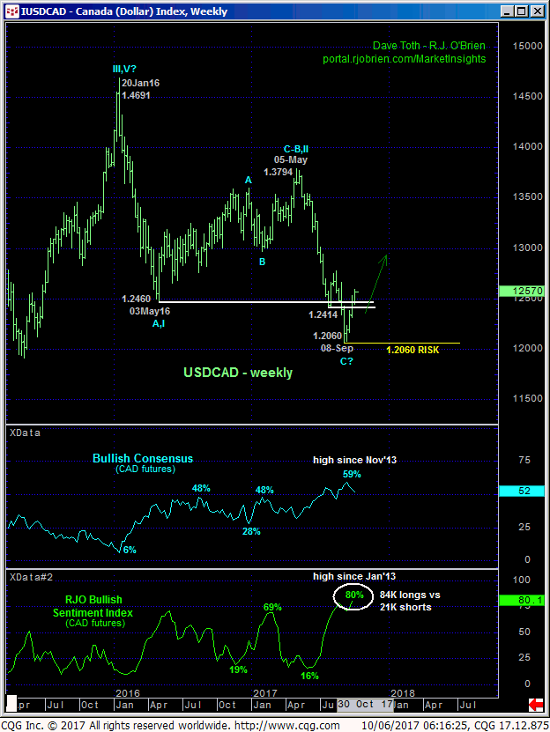
Contributing to this major base/reversal count in the USD is the stubbornly frothy bullish sentiment accorded the CAD contract over the past month by the Managed Money community DESPITE the USD’s gross failure to sustain early-Sep’s losses below an obviously pivotal lower-1.24-handle support area that dates from May of 2016 shown in the weekly chart below. This historic extent to which this managed funds community has its neck sticking out on the long side in CAD is fuel for downside vulnerability in the contract and upside vulnerability in the USD that could result in steep, even relentless USD gains. Combined with a complete 5-wave Elliott sequence down from 05May17’s 1.3794 high labeled in the daily chart above, all the factors consistent with a major base/reversal environment are in place.
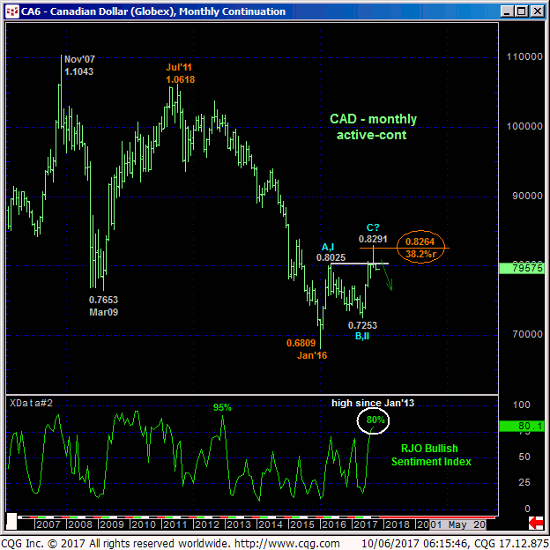
Finally and also contributing to a major peak/reversal environment in the CAD contract, the monthly active-continuation chart below shows the unique and very compelling combination of:
- historically bullish sentiment not seen since that that warned of and accompanied 2012’s collapse
- a clear 3-wave and potentially corrective recovery from Jan’16’s 0.6809 low and
- a 2016-17 recovery attempt that stalled within ticks of the (0.8264) 38.2% retracement of the entire 2011 – 2016 bear market from 1.0618 to 0.6809.
Left unaltered by a recovery above 0.8264 (below 1.2060 in the cash market), we believe the USD is poised for gains that could be major in scope. These issues considered, a bullish policy remains advised with a failure below 1.2448 minimally required to defer this call and warrant paring or neutralizing exposure depending on one’s personal risk profile, In lieu of such sub-1.2448 weakness further and possibly accelerated USD gains remain expected straight away.
GBPUSD
Similarly, yesterday’s continued slide in cable below Tue’s 1.3222 low reaffirms our major peak/reversal count introduced in 20-Sep’s Technical Webcast and leaves Wed’s 1.3291 high in its wake as the latest smaller-degree corrective high and new short-term risk parameter this market is now minimally required to recoup to even defer, let alone threaten this broader bearish count.
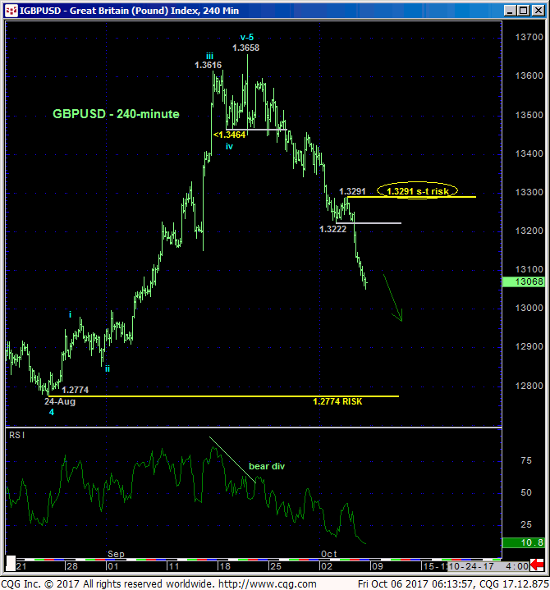
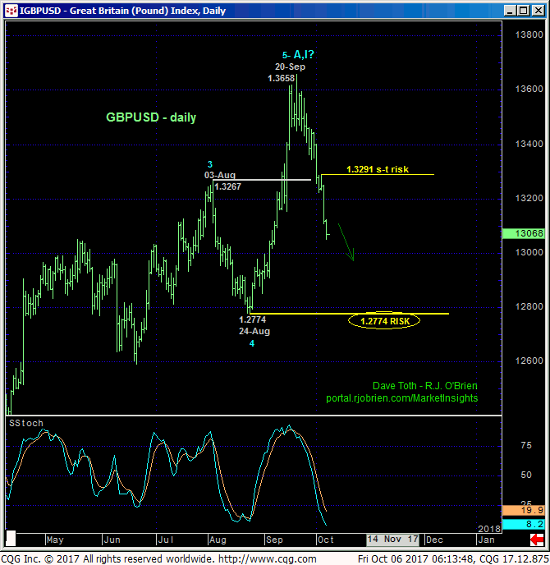
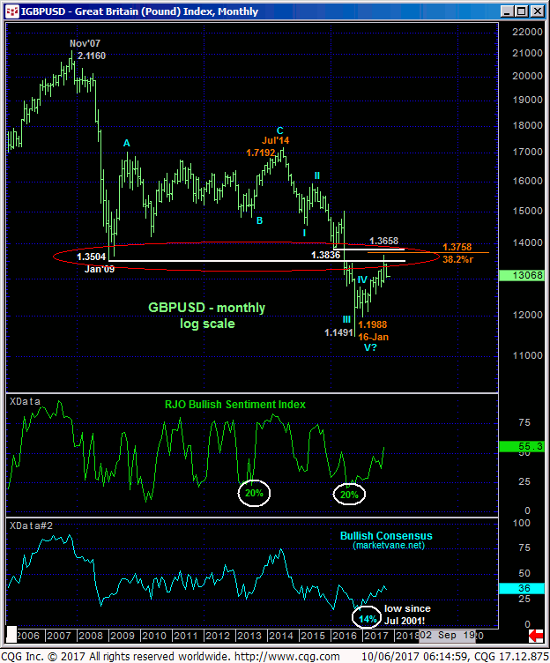
Arguably, commensurately larger-degree weakness below 24-Aug’s 1.2774 larger-degree corrective low remains required to confirm a bearish divergence in WEEKLY momentum shown in the weekly close-only chart below to, in fact, break this year’s major uptrend. But as discussed a couple weeks ago, the market’s rejection of the exact 38.2% retrace of the entire 2015 – 2017 decline on a weekly close-only basis below, the bearish divergence in daily momentum and major resistance from the 1.35-to-1.38-area we’ll discuss below, we believe the market has begun a major correction of this year’s GBP rally that could span 3-to-5-months.
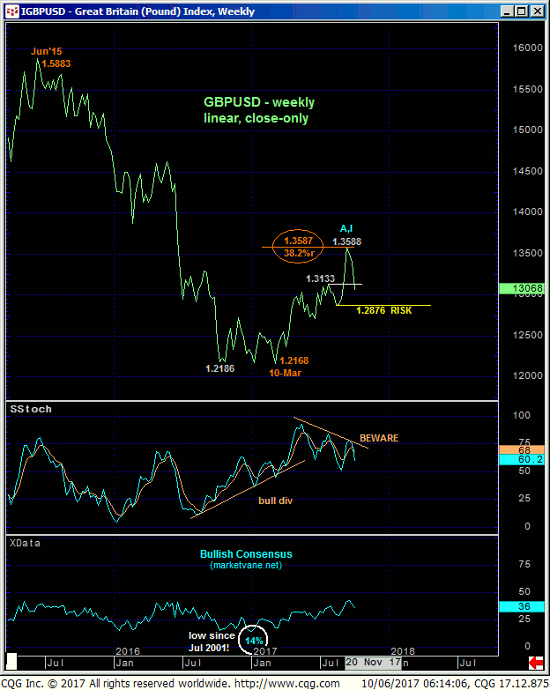
In the many weeks leading up to 20-Sep’s 1.3658 high, we discussed the 1.35-to-1.38-range that provided major support from Jan 2009 until Jun’16’s collapse below it, rendering this area a major new resistance candidate. 20-Sep’s bearish divergence in admittedly short-term momentum provided the very first indication that the market was recognizing this pivotal long-term area and condition. Subsequent losses these past couple weeks does nothing but reinforce this count that calls for a major correction of this year’s entire bull trend from 16-Jan’s 1.1988 low.
In sum, a bearish policy and exposure remain advised with minimum strength above 1.3291 required to pare or neutralize positions. In lieu of such strength further and possibly accelerated losses should not surprise.
