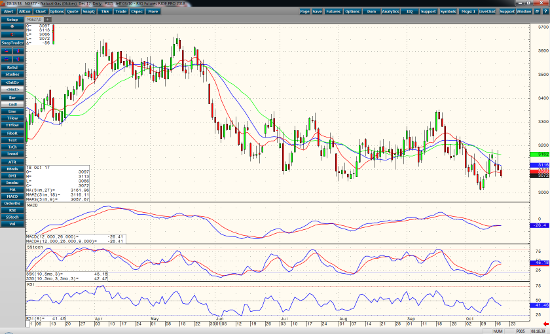
Natural gas for December is trending lower today by 40 points. The general overall trend is sideways to down. Momentum studies MACD, Stochastics, and RSI are at mid-levels and rolling over to lower levels. This might increase selling pressure as lower levels are penetrated. Short term moving averages are also trending lower. Support on daily chart is at 3.013. Resistance is fairly strong at 3.200. A close above the corrective high of 3.180 is need to negate the current trend, and may signal a move to a higher trading range with 3.200 becoming support. A close beneath 3.010 would do technical damage to the chart and may reach for swing lows not seen for almost a year.
The natural gas storage number is an expected build of 59 bcf. This number is below the 5-year average. Last week the build was 87 bcf. Total storage is slightly below the 5-year average as well. The past few weeks of weather forecasts were above average, but the next 8-14 day report suggests average temperatures. This may cause a smaller build or even a draw, because of heating demand. Cautious exposure to the short side is recommended. Put spreads or short plays with tight stops fit the bill.
Dec ’17 Natural Gas Daily Chart


