In Friday’s early morning trade, December gold has bounced back off its overnight low. This is mostly due to the Catalonian lawmakers vote to split from Spain, taking the country’s political crisis into uncharted territory. Also, after the ECB announced their long-awaited QE tapering, the US dollar went sharply higher Thursday, which caused commodities across the board to come down. The US House of Representatives are another catalyst that was pushing the dollar up and gold down, as they adopted a budget that could further the President’s agenda on re-writing the tax code.
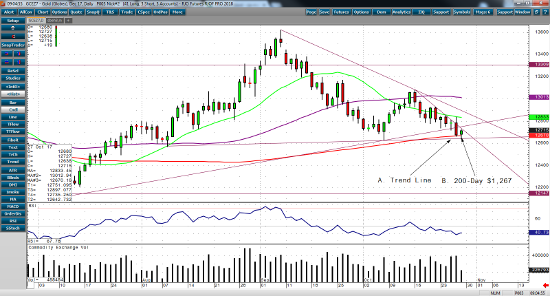
If we take a quick look at the daily December gold chart, you’ll clearly see that gold broke the long-term trend line that began back on July 10. However, gold is trying to hold onto the 200-day moving average of $1,267. If it does, look for a rally back up to $1,285-$1,300 a troy ounce. I have highlighted below the technical levels in this article on our RJO Futures Pro charts.
Dec ’17 Gold Daily Chart


