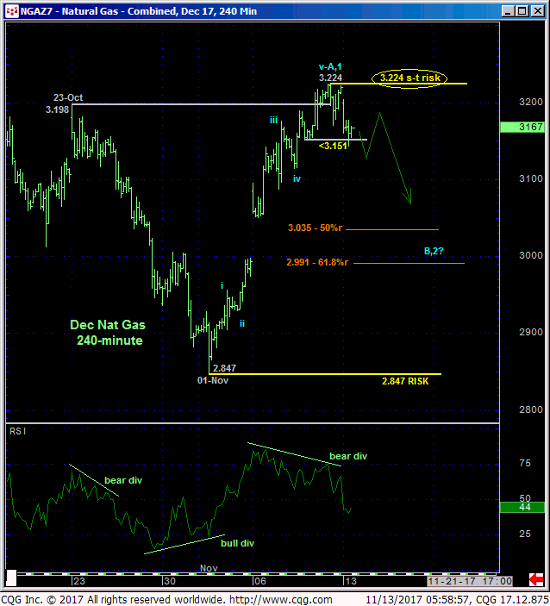
In Fri’s Technical Blog we discussed the longer-term pertinence of Thur’s recovery above 23-Oct’s 3.198 larger-degree corrective high as well as the obviousness of this month’s initial counter-trend rally that rarely goes unanswered, especially in this market that has a history of extensive (b- and 2nd-wave) corrections to such initial counter-trend moves. On an admittedly short-term basis we identified last Wed’s 3.151 corrective low as the smaller-degree corrective low and short-term risk parameter the market needed to sustain gains above to maintain a more immediate bullish count. Its failure to do so overnight confirms a bearish divergence in momentum that stems the recent uptrend and defines Fri’s 3.224 high as one of developing importance and possibly the END of a 5-wave Elliott sequence up from 01-Nov’s 2.847 low. Per such, we are considering this 3.224 high as our new short-term risk parameter from which non-bullish decisions like long-covers and cautious bearish punts can be objectively based and managed.


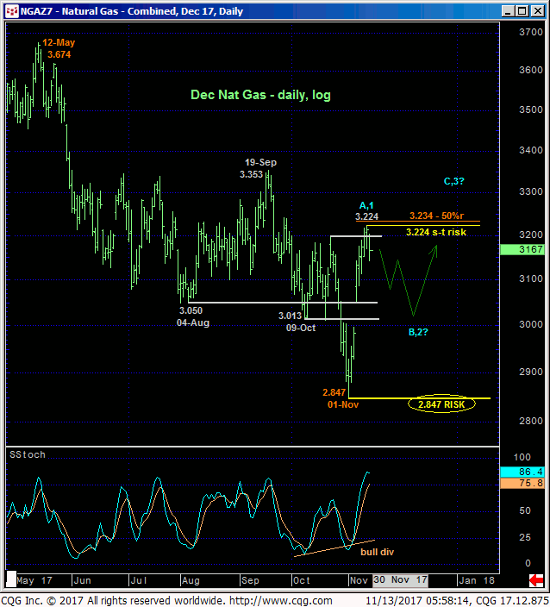
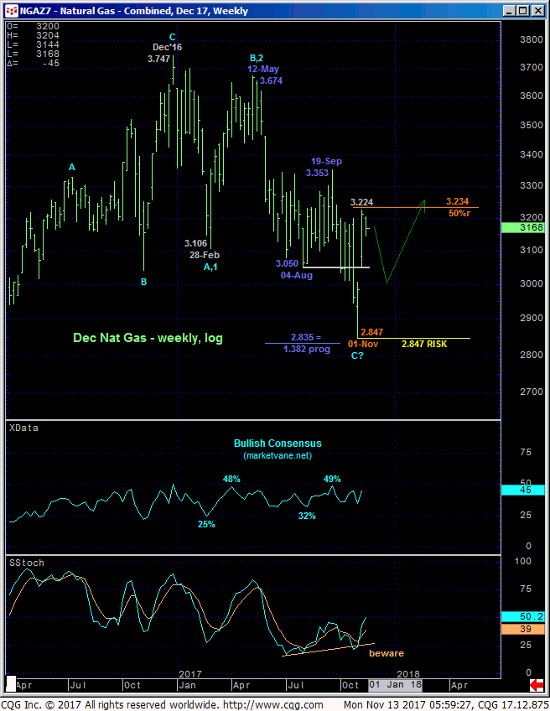
The Fibonacci fact shown in the daily (above) and weekly (below) log scale charts of the Dec contract that Fri’s 3.224 high was just a penny removed from the (3.234) 50% retrace of May-Nov’s entire 3.674 – 2.847 decline would seem to reinforce at least an interim peak/reversal threat following today’s bearish divergence in short-term mo. Also as we pointed out Fri, the obviousness of gaps, so early in a prospective reversal process, rarely go unanswered as both the technical and fundamental factors that have driven the market lower for all of 2017 to this point rarely evaporate into thin air. Rather, they take TIME to erode, and during this time the market typically produces that (b- or 2nd-wave / right-shoulder) correction of the initial abrupt counter-trend move that then provides a preferred risk/reward opportunity to establish bullish (in this case) policy. During this year’s earlier peak/reversal process shown below, the market actually went through this process twice, once after Dec/early-Jan’s initial counter-trend break that included a gap down and secondly after Dec-Feb’s emotional, obvious plunge.

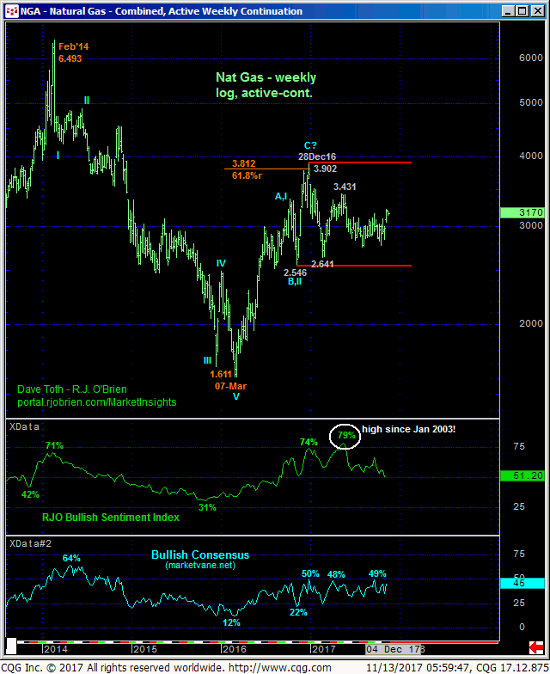
Finally, on a weekly log active-continuation chart basis below, the market remains deep within the middle-half bowels of the past YEARS’ lateral range where we always approach the odds of aimless whipsaw risk as higher, warranting a more conservative approach to risk assumption that involves admittedly tight, short-term risk parameters like Wed’s 3.151 low we discussed Fri and Fri’s 3.224 we’re introducing today.
These issues considered and while the extent and impulsiveness of the early-Nov rally is impressive and warns of potentially further gains in the months ahead, today’s bearish divergence in short-term mo identifies Fri’s 3.224 high as the prospective end to this initial counter-trend rally ahead of a correction lower that could easily retrace more than 61.8% of the rally to the 2.99-area or lower in the weeks ahead. Strength above 3.224 is required to negate this call, reinstate the uptrend and expose potentially significant gains thereafter. Per such a neutral-to-cautiously-bearish policy from 3.200 OB is advised with a recovery above 3.224 required to negate this call and warrant its cover.


