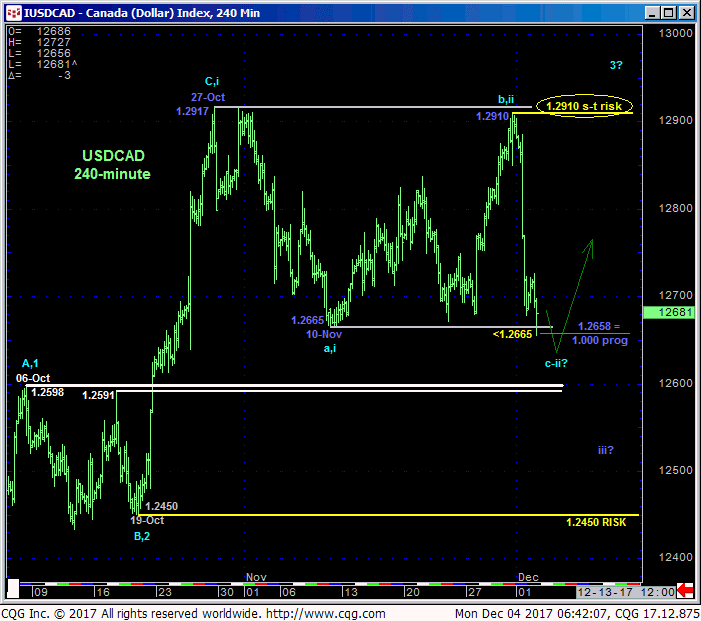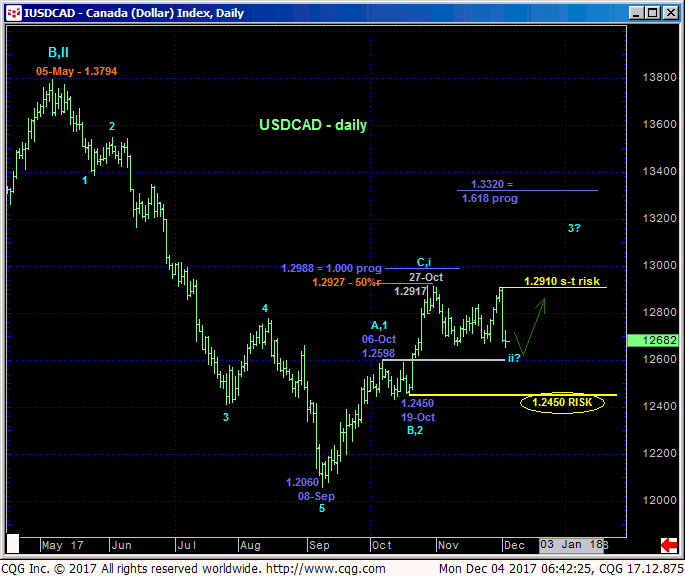
After this morning’s early break below our short-term risk parameter defined by 10-Nov’s 1.2665 low, the market is at a key correction-vs.-reversal crossroads. There’s little question that Fri’s sharp relapse and rejection of the past five weeks’ 1.2917 range cap that the market is acknowledging the lower-1.29-handle as a developing and key resistance area. And as a result we can identify Thur’s 1.2910 high as our new short-term risk parameter the market now needs to recoup to mitigate any peak/reversal threat and reinstate what we believe is a longer-term developing uptrend in USD.
Within the context of a still-arguable 3-month uptrend however, the past couple days’ relapse easily fits the bill as the completing c-Wave of a 3-3-5 “flat” (bull market) correction down from 27-Oct’s 1.2917 high. In Fibonacci fact, the 240-min chart below shows that the past three days’ impulsive (prospective c-Wave) break from 1.2910 came within two pips of its (1.2658) 1.000 progression relationship of late-Oct/early-Nov’s (suspected a-Wave) break from 1.2917 to 1.2665. As importantly the market remains above key former resistance-turned-support from the 1.2590-to-1.2600-area from mid-Oct.


Indeed and despite the recent relapse, the past five weeks’ still-lateral chop falls well within the bounds of a mere corrective/consolidative event relative to Sep-Oct’s uptrend. Former 1.2590-area resistance-turned-support has yet to be challenged, let alone 19-Oct’s 1.2450 larger-degree corrective low and our key risk parameter the market needs to break to, in fact, break Sep-Oct’s uptrend.
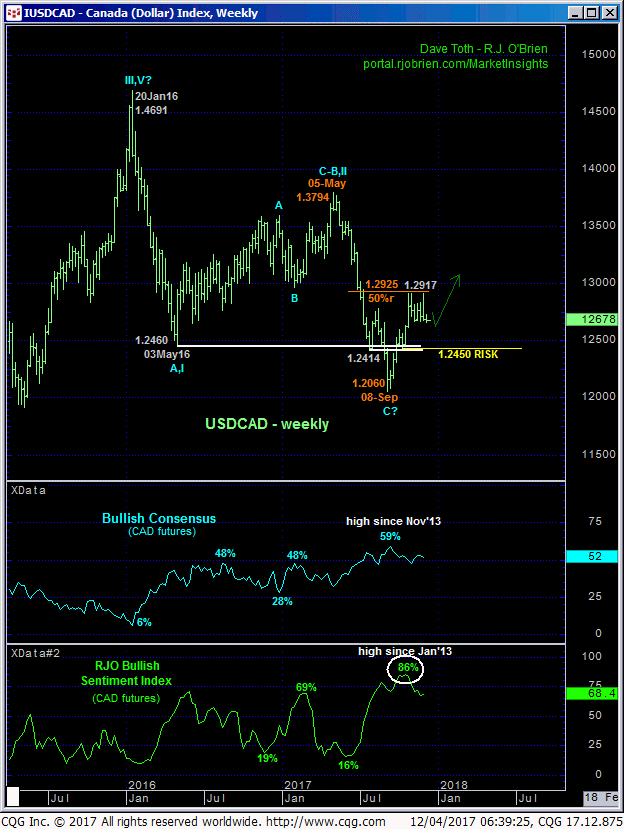
Historically frothy bullish sentiment accorded the CAD futures in Sep/Oct- a key component of our bullish-USD count- has understandably waned following late-Oct’s forced capitulation of some of the exposure. Nonetheless, combined with the market’s gross failure to sustain Sep’s break below a ton of former resistance from the 1.2460-area dating back to May’16, historically bullish CAD sentiment has done its job of warning of a major BASE/reversal environment in USDCAD rates. And on this larger-degree basis the market has yet to provide the sub-1.2450 evidence needed to threaten this count.

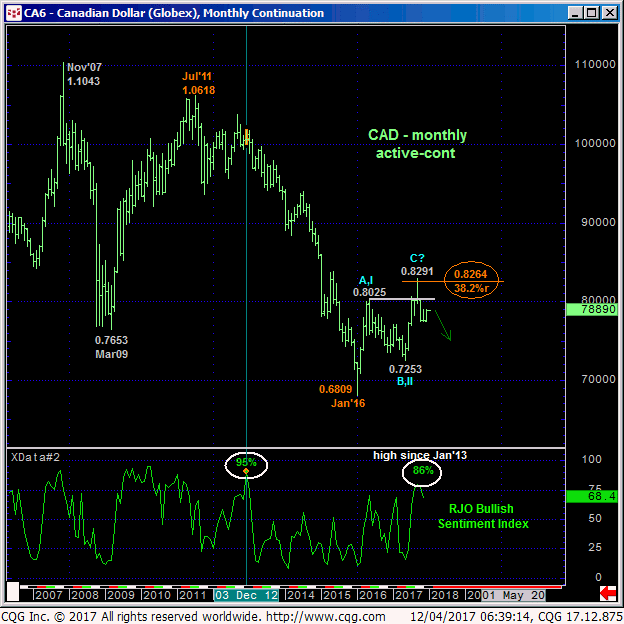
The weekly chart above shows the market’s failure thus far to breach the 1.2925-area that marks the 50% retrace of May-Sep’s 1.3794 – 1.2060 decline that some may use as a bearish-USD factor. A USD-bull could counter with the CAD contract’s rejection of the (0.8264-area) 38.2% retrace of the 2011 – 2016 decline from 1.0618 to 0.6809 decline AND clear 3-wave and thus corrective recovery attempt on a monthly active-continuation chart below.
Relative to the past three months’ price action we believe the issue comes down to whether the market can sustain the past couple days’ impulsive break to levels below 19-Oct’s 1.2450 low. IF Sep-Oct’s recovery attempt was a 3-wave bear market correction, then today’s break below 1.2665 gives the bear the opportunity to perform. And “performance” will be gauged by continued trendy, impulsive behavior below 1.2590 initially and then 1.2450. If, alternatively, the past few days’ break is stemmed by a bullish divergence in short-term mo and then ultimately recoups 1.2910, our broader base/reversal count will be reinforced and expose potentially significant gains thereafter.
These issues considered, shorter-term traders have been advised to move to a neutral/sideline position as a result of today’s failure below 1.2665. Longer-term players are OK to pare bullish exposure to more conservative levels, but commensurately larger-degree proof of strength below 1.2450 remains required to negate our long-term bullish call, jettison remaining bullish exposure and prepare for more significant USD losses thereafter. In effect the market is pretty much smack in the middle of what we believe are the two key directional triggers of 1.2910 and 1.2450 and flexibility to either directional outcome is urged.


